Market Recap for Tuesday, July 23, 2019
Utilities (XLU, -0.63%) was the only sector to end Tuesday's session in negative territory as most groups and stocks advanced. The XLU has been faltering on a relative basis ever since the overall market bottomed in early June. That has not been the case for aggressive sectors like technology (XLK, +0.55%) and consumer discretionary (XLY, +0.68%), however, as these two sectors have been powering the advance.
Yesterday's primary strength, though, came from unsuspecting groups like materials (XLB, +2.06%) and financials (XLF, +1.04%). Industrials (XLI, +1.26%) also were strong and are once again beating on the door of major overhead price resistance. A breakout would be extremely bullish:
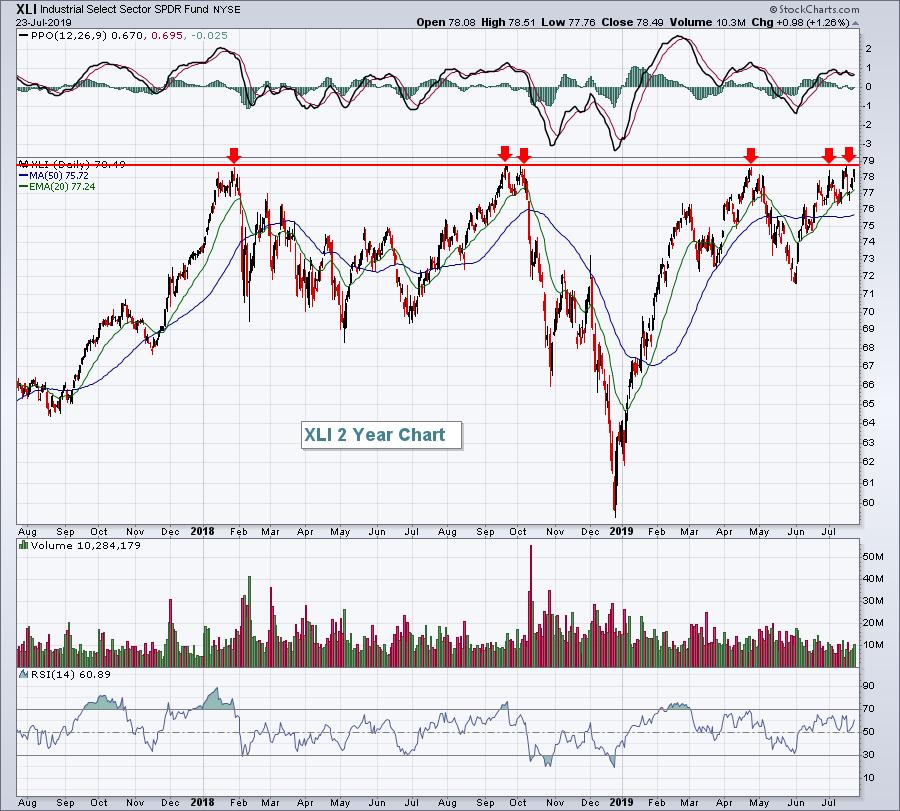
When a group tries that many times to clear overhead resistance and fails, the successful attempt generally results in solid follow-through action. That's what I'd look for here, but will we get the breakout?
Earnings are helping to aid the current market rally. Companies like Coca Cola (KO, +6.07%) and United Technologies (UTX, +1.50%) saw gaps higher following revenue and earnings beats and that helped to lift the Dow Jones ($INDU, +0.65%) to a near record high, one set last week.
Pre-Market Action
U.S. futures are lower as traders pause after the recent rally to all-time highs. Caterpillar (CAT) is down 5% this morning after disappointing quarterly results were released. Boeing (BA) is down roughly 1% after it too reported results below expectations.
Gold, bonds and crude oil are all higher this morning. We saw strong action in Asia overnight, but more mixed action this morning in Europe.
Currently, Dow Jones futures are pointing to a lower start, perhaps close to 100 points.
Current Outlook
Small caps continue to lag their larger cap counterparts as we've now reached bull market relative lows (vs. the benchmark S&P 500). Most major bull market advances occur because investors/traders have a big risk appetite. That normally translates into money rotating heavily towards small caps. We haven't seen that development yet, although relative strength from this area of the market could be a confirmation signal of a big rally ahead. But first, this relative downtrend must come to an end:
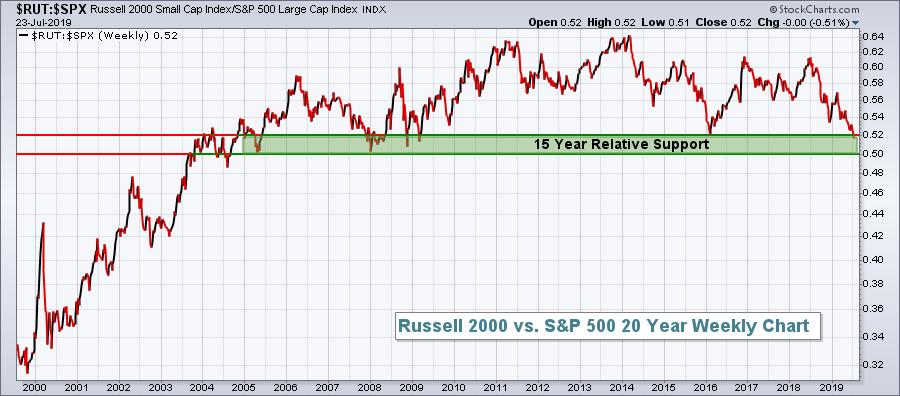
The RUT:SPX ratio just closed beneath its 2016 relative low, setting a fresh 10+ year relative low. We saw relative support at the .50-.52 level on several occasions from 2005 to 2009. Small cap bulls will once again be looking for more buyers as we approach this relative low.
Sector/Industry Watch
Communication services (XLC) sure does look poised for a big push to the upside and Facebook's (FB) earnings tonight could be the catalyst. After reaching its earlier April high just above 51, the XLC has pulled back in what appears to be a handle:
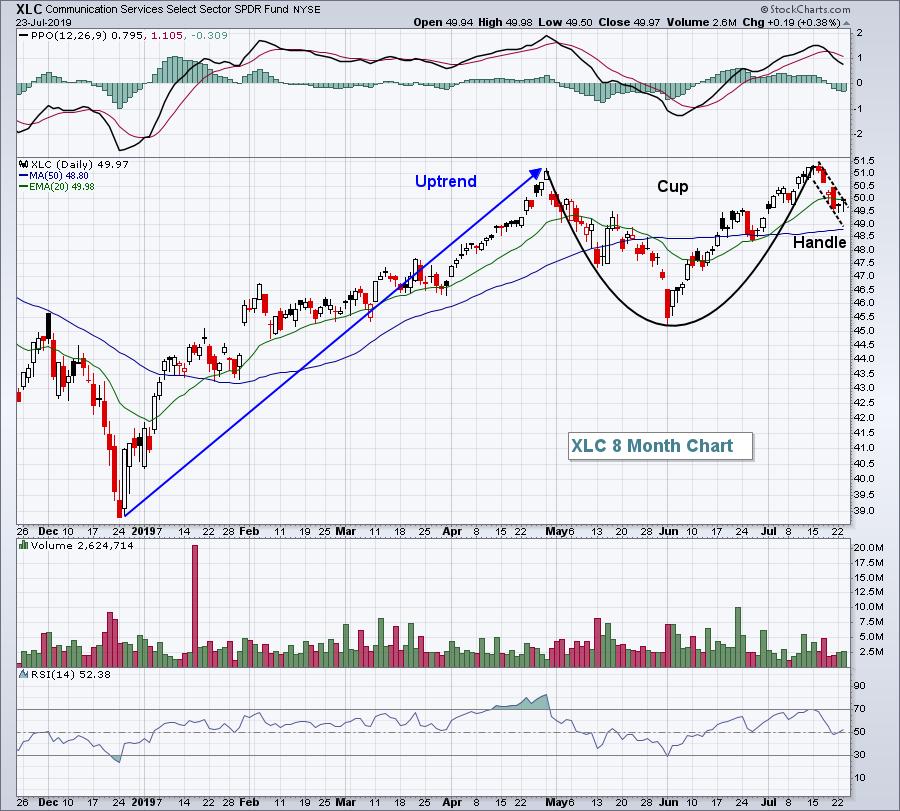
This is a very bullish cup with handle continuation pattern. It's also nice to see that volume was heavier as the right side of the cup formed, then tailed off a bit during the handle. The pattern is set up on a tee for FB after the bell. Will they deliver? Relative strength says they will:
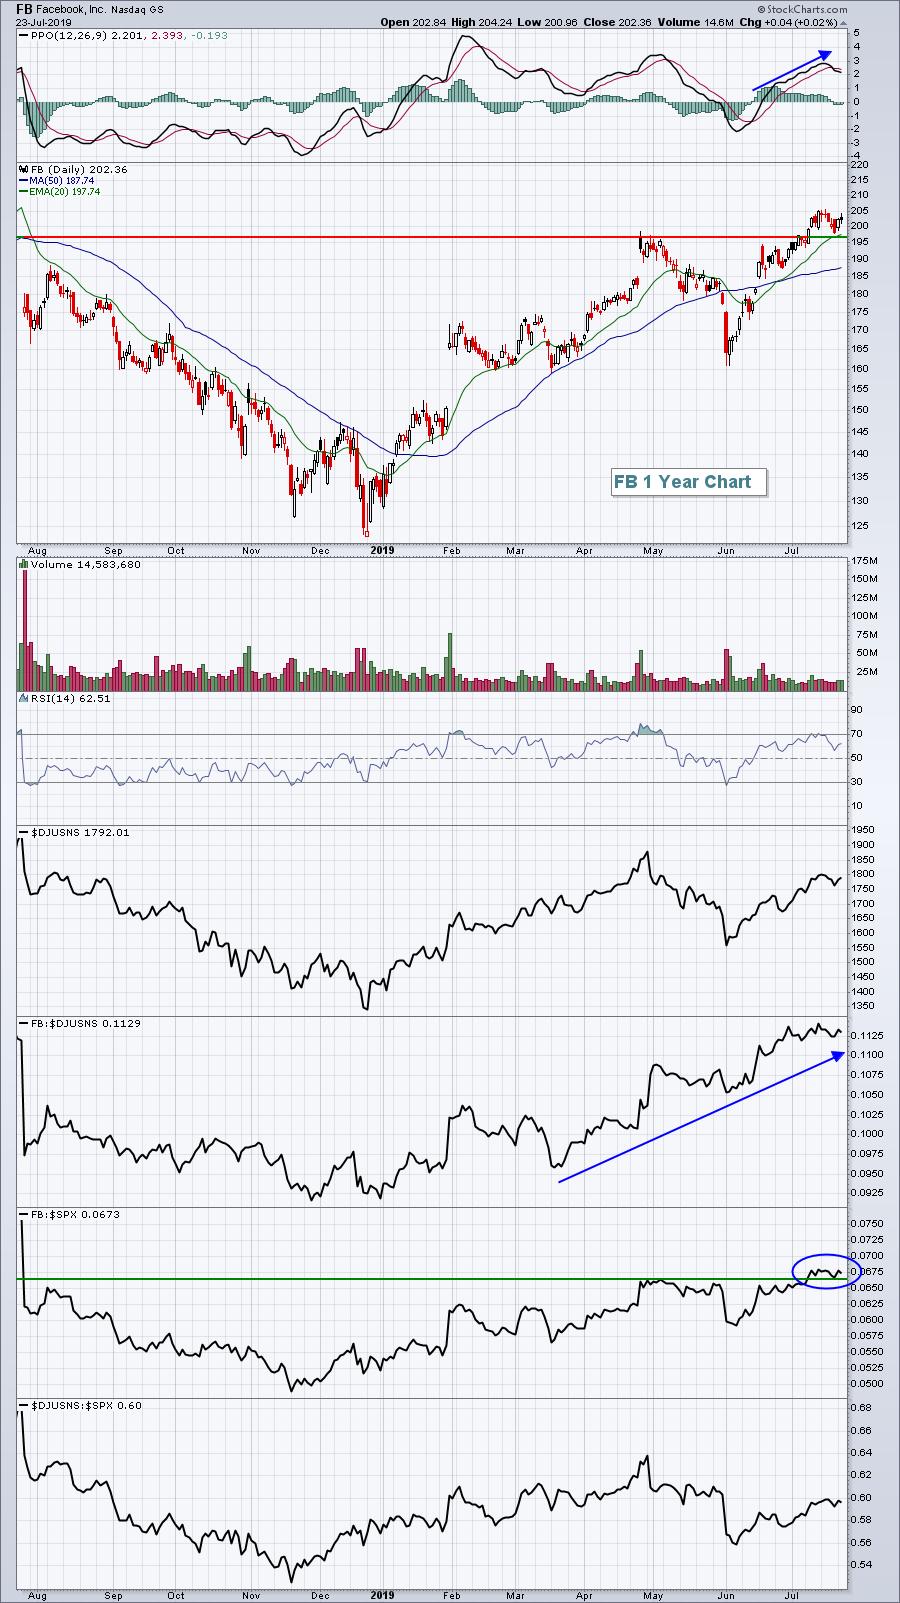
FB's PPO is very strong, indicative of accelerating bullish price momentum. Also, internet stocks ($DJUSNS) have been leading the rally off the June low and FB has been a prominent reason why. Wall Street is expecting a big report tonight and that could be the catalyst to really jumpstart the XLC.
Historical Tendencies
Since gapping higher in mid-April, Walt Disney Co (DIS) has been a solid performer. It does, however, face stiff historical headwinds as we head into August:
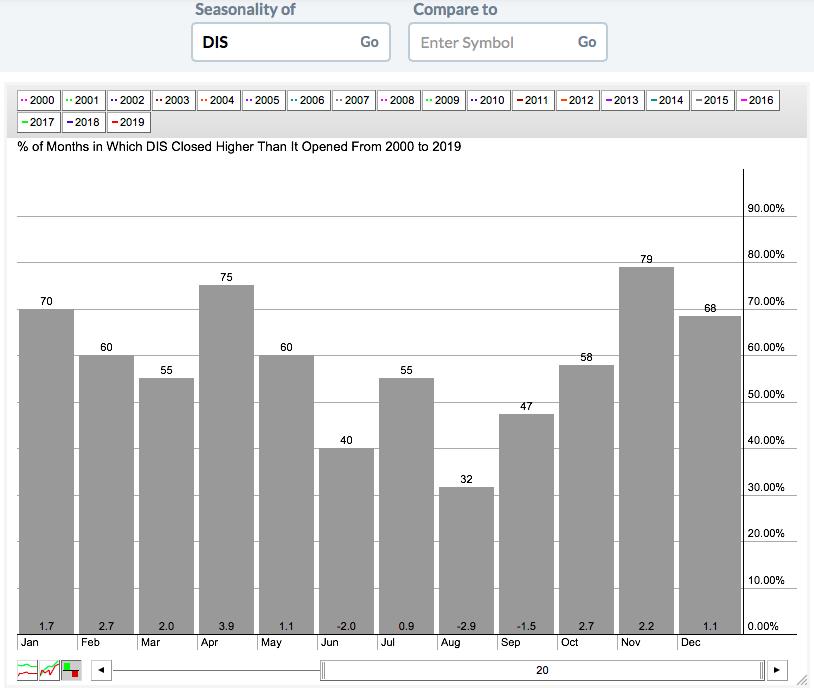
The summer months tend to be particularly rough for DIS as it's averaged losing 5.5% per year from June through September over the past 20 years. DIS has risen just 32% of Augusts over that timeframe, easily its worst calendar month.
Key Earnings Reports
(actual vs. estimate):
ALXN: 2.64 vs 2.36
ANTM: 4.64 vs 4.61
APH: .92 vs .93
BA: 2.92 vs 1.85
BSX: .39 vs .38
CAJ: .30 vs .40
CAT: 2.83 vs 3.12
CHKP: 1.38 vs 1.37
DASTY: .92 vs .86
DDAIF: 2.09 vs 1.07
DTE: .99 vs 1.09
FCX: (.04) vs (.05)
GD: 2.77 vs 2.68
GWW: 4.64 vs 4.65
HLT: 1.06 vs 1.01
IQV: 1.53 vs 1.49
MKTX: 1.27 vs 1.30
MLCO: .24 vs .20
NDAQ: 1.22 vs 1.19
NEE: 2.35 vs 2.28
NOC: 5.06 vs 4.64
NSC: 2.70 vs 2.77
NTRS: 1.75 vs 1.68
ROL: .21 vs .21
T: .89 vs .89
TDY: 2.80 vs 2.40
TEL: 1.50 vs 1.42
TMO: 3.04 vs 3.01
UPS: 1.96 vs 1.93
VFC: .30 vs .28
(reports after close, estimate provided):
AEM: .03
ALGN: 1.51
AMP: 4.00
CERN: .64
CTXS: 1.33
EFX: 1.36
ESS: 3.26
F: .30
FB: 1.90
FFIV: 2.57
FTI: .35
LVS: .81
NOW: .64
ORLY: 4.67
PTC: .35
PYPL: .75
RJF: 1.86
SU: .69
SUI: 1.13
TMK: 1.65
TSLA: (.54)
VAR: 1.14
XLNX: .94
Key Economic Reports
July PMI composite flash to be released at 9:45am EST: 51.7 (estimate)
June new home sales to be released at 10:00am EST: 660,000 (estimate)
Happy trading!
Tom


