Special Event
I am hosting a HUGE event on Monday, August 19th at 4:30pm EST as I release my Top 10 Stocks for my Model, Aggressive and Income portfolios. Each of these portfolios has crushed the benchmark S&P 500 since their respective inceptions and for a mere $7 30-day trial, you can see my picks for the next quarter. (Note: no need to register if you're already an EarningsBeats.com member.) I base my selections on companies with excellent fundamentals and very strong technical outlooks, stocks that show, in particular, both absolute and relative strength. I ride the leaders for 90 days, then ride the next group of leaders for 90 days, and so forth and so on. My Model Portfolio has outperformed the S&P 500 by an astounding 40 percentage points since its inception on November 19, 2018, successfully negotiating the Q4 market decline and the latest May and August 2019 stumbles. As I transition from Sr. Technical Analyst here at StockCharts.com to my return as Chief Market Strategist at EarningsBeats.com, I would really love your support. For just $7, you can check out our service for 30 days to see if it's right for you. What will you receive?
- a 30 day trial membership to everything EarningsBeats.com offers
- a copy of our exclusive Strong Earnings ChartList that, as of Monday, will likely include approximately 300 companies that have beaten Wall Street consensus estimates as to both revenues and earnings, are liquid and have solid technical charts
- all of our daily alerts to include entry price(s), targets and stops
- our archive of past webinars, to include prior Top Stock Picks for my portfolios, and a very popular webinar "Power of Relative Strength"
- a seat to all webinar events throughout your trial period
- a daily market update providing intraday market information and updates on any current alert stocks
- and much, much more
Please join me on Monday by CLICKING HERE to start your 30 day trial. Thanks!
Market Recap for Wednesday, August 14, 2019
It was a bloody day on Wall Street. There was a significant gap lower and the selling never really slowed. A continuing flight to safety sent the 10 year treasury yield ($TNX) down to 1.58%. All of our major indices fell in the neighborhood of 3% as fear levels increased with the yield curve inverting (10 year treasury yield falling beneath 2 year treasury yield). That had market participants selling with both fists as inverted yield curves were all over the headlines as the media scared everyone with "end of the world" headlines. See my Current Outlook section below for a calmer interpretation.
All 11 sectors fell and I won't sugar coat it. It was ugly. Energy (XLE, -3.92%), the weakest sector in 2019, added to its woes. Financials (XLF, -3.71%) and communication services (XLC, -3.55%) were not far behind. I really don't need to explain how bad things were. These next 2 stats should do the trick:
- The Dow Jones' best performer was Coca Cola (KO), which fell only 0.95%
- The S&P 500 had 6 stocks end the day in positive territory
It was a white wash.
Pre-Market Action
Only time will tell if this morning's futures rally will stick throughout the trading day, but Wall Street does have one thing in its favor. After a few days of dwindling earnings reports and very little economic news, the agenda completely changes this morning. I'm not sure if I've ever seen a day with so many economic reports. And that news could be extremely timely as focus has suddenly shifted to the inverted yield curve and a possible recession.
Overnight, Asian markets were mixed as Hong Kong's Hang Seng Index ($HSI) jumped 0.76%. It was timely as this index approaches key support established in late-2018 and early-2019 (last night's action is not reflected in this chart):
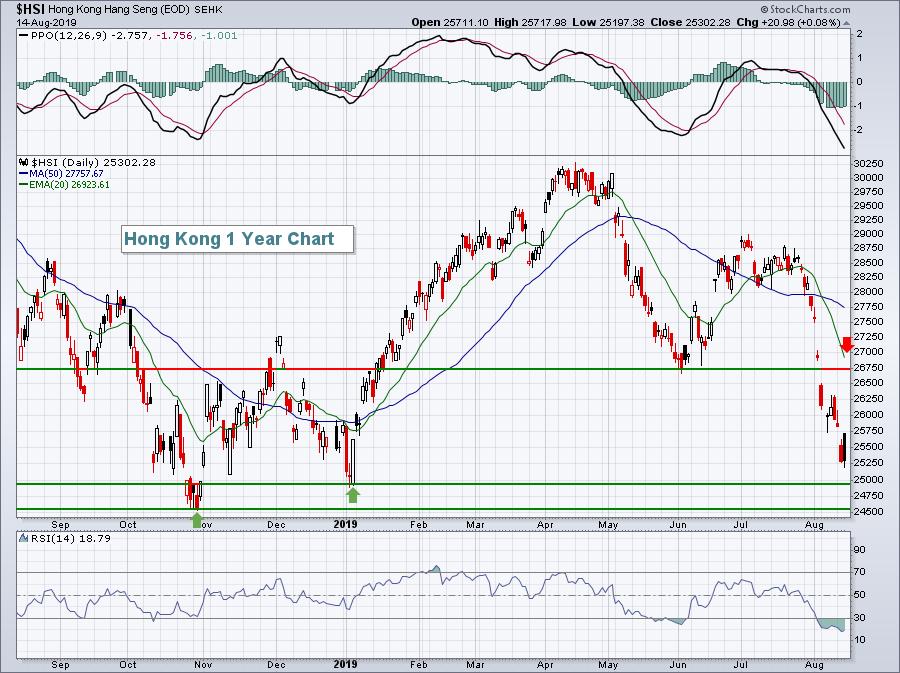
Europe markets are currently lower this morning, so we'll see if U.S. stocks can regain their longer-term bullish footing. With roughly 20 minutes left before the open, Dow Jones futures are higher by 163 points as this index of conglomerates attempts to recover some of its 800 point loss from Wednesday.
Current Outlook
I'm not buying any of this recession talk. It's scuttlebutt. Listen, when you are nearly the only country in the world that will actually pay you interest on your loan, EVERYBODY wants in. So outside foreign influences are currently buying up our treasuries, sending the long end of the yield curve lower. Then you have the slowest central bank in the world to act, one that over-hiked short-term interest rates in the first place and now are completely failing to recognize the need to lower interest rates now. I am a firm believer that the Fed's actions are creating way too much uncertainty for Wall Street and also playing a major role in the yield curve inversion.
We'll see how the economic reports play out today, but honestly most of them are in the rear view mirror, telling us what happened last month or last quarter. The stock market is our best leading economic indicator and it's pulling back now, waiting for direction from the Fed in my 0pinion. If the Fed stubbornly remains the most hawkish central bank in the world, this won't end well for U.S. equities.
What I'm counting on is the Fed eventually getting it right again. Maybe it's wishful thinking.
Sector/Industry Watch
A lot of things today look like they did in late May. The stories are the same - a Fed out of touch, escalating trade tensions, falling equity prices, etc. - and, in many cases, so are the charts. Take the Dow Jones U.S. Footwear Index ($DJUSFT) as an example:
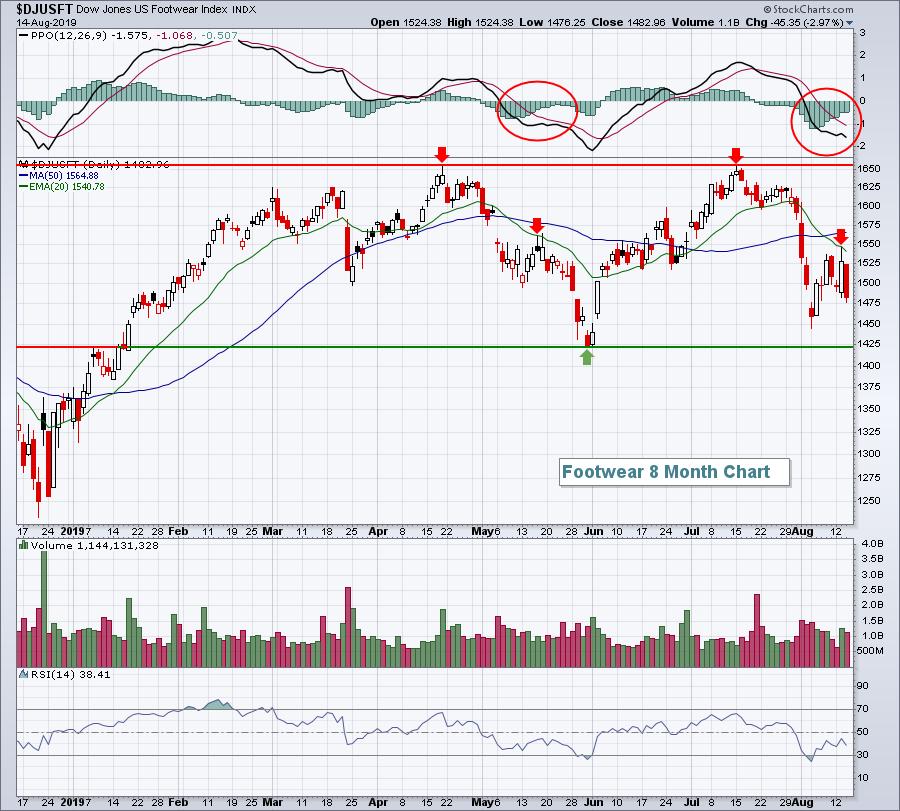
The DJUSFT topped near 1650, lost its 20 day moving average, experienced a death cross (20 day dropping below 50 day), witnessed a PPO that didn't budge on a bounce to test its overhead 20 day EMA resistance, and then suffered a final decline. Well, this time we don't know about that final decline. But I'd be watching that 1420 closing support level quite closely, especially given the historical data provided in the Historical Tendencies section below.
Historical Tendencies
Yesterday, I pointed to internet stocks ($DJUSNS) as an area of the market that tends to see a pickup in strength during September and October. Add to the mix footwear stocks ($DJUSFT), which also begins to see strength in September:
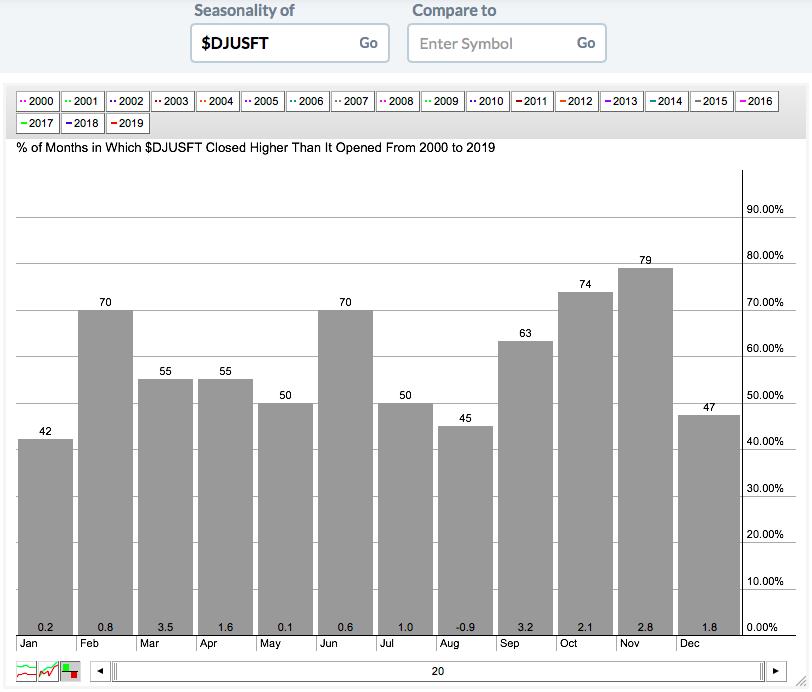
You can see that the odds of a monthly gain really begin to increase from September through November and the cumulative average gain during those three months has been 8.1% over the past two decades. That's enough historical strength to put me on notice for strengthening charts in that space.
Key Earnings Reports
(actual vs. estimate):
BABA: 1.83 vs 1.50
TPR: .61 vs .61
WMT: 1.27 vs 1.22
(reports after close, estimate provided):
AMAT: .70
NVDA: 1.15
PAGS: .26
ZTO: .24
Key Economic Reports
Initial jobless claims released at 8:30am EST: 220,000 (actual) vs. 208,000 (estimate)
August Philadelphia Fed Survey released at 8:30am EST: 16.8 (actual) vs. 11.1 (estimate)
July retail sales released at 8:30am EST: +0.7% (actual) vs. +0.3% (estimate)
July retail sales less autos released at 8:30am EST: +0.9% (actual) vs. +0.5% (estimate)
August empire state manufacturing survey released at 8:30am EST: 4.8 (actual) vs. 2.5 (estimate)
Q2 productivity released at 8:30am EST: 2.3% (actual) vs. 1.5% (estimate)
July industrial production to be released at 9:15am EST: +0.1% (estimate)
July capacity utilization to be released at 9:15am EST: 77.8% (estimate)
June business inventories to be released at 10:00am EST: +0.1% (estimate)
August housing market index to be released at 10:00am EST: 66 (estimate)
Happy trading!
Tom


