Market Recap for Thursday, August 8, 2019
Thursday was a trend day for U.S. stocks, one in which the action was positive from start to finish. It's generally viewed bullishly and as a sign of accumulation. However, I don't know if I'd grow overly bullish as it is occurring in the middle of a wide and volatile trading range. Still, it beats the alternative. And it was also a positive to see follow-through after Wednesday's intraday reversal.
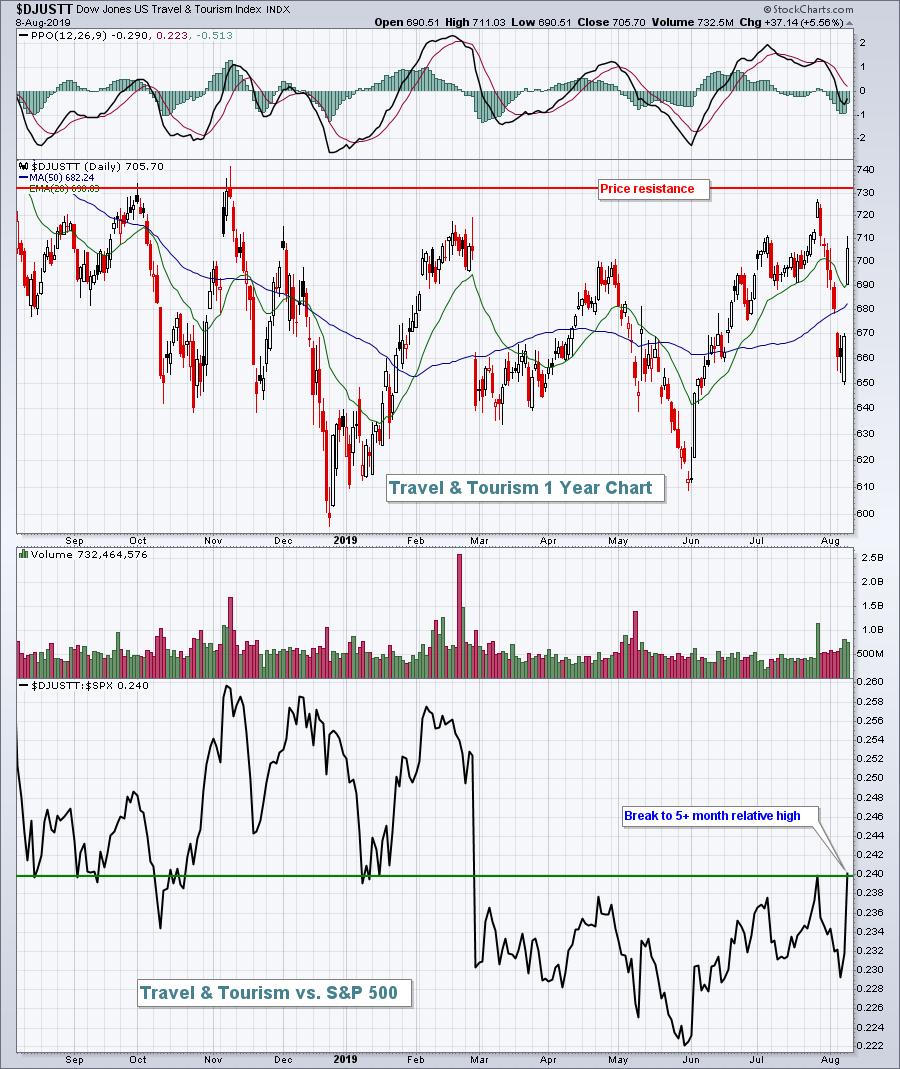
Leading the move higher were energy (XLE, +2.87%), technology (XLK, +2.45%), and communication services (XLC, +2.01%) stocks. Travel & tourism ($DJUSTT, +5.56%) got a huge lift from Booking Holdings' (BKNG, +6.56%) solid quarterly earnings report, but the group still has overhead resistance to negotiate:
Energy benefited from crude oil ($WTIC) bouncing off key price support:
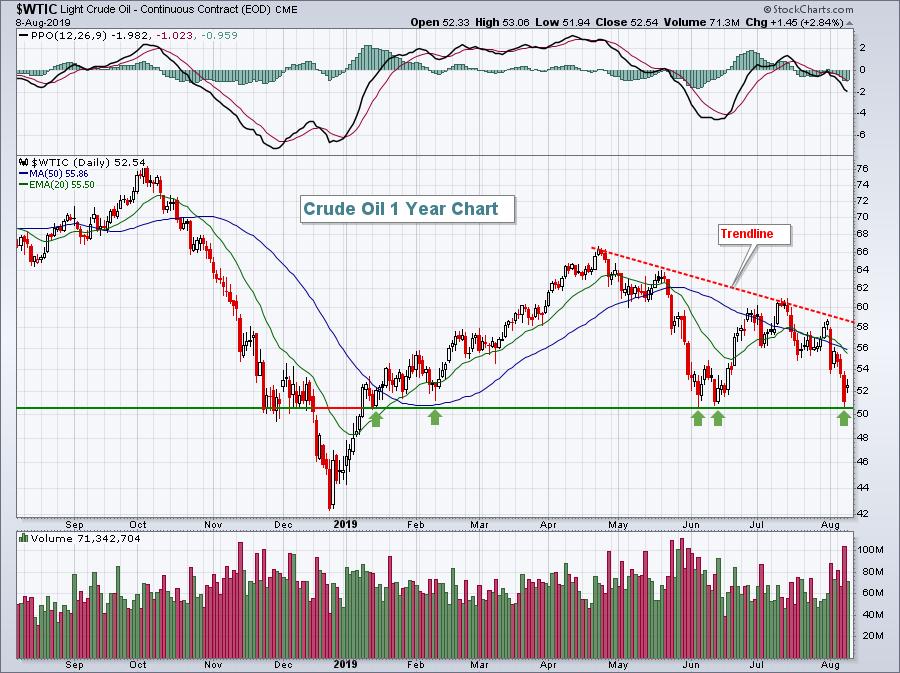
One day of bounce doesn't reverse the 3 1/2 month downtrend that we've seen in crude oil prices, but it's a small start. A close below $50 per barrel would likely send energy shares spiraling lower once again.
Pre-Market Action
U.S. futures are weak after a steady trend of higher prices the past day and a half. The 10 year treasury yield ($TNX) is down 2 basis points and has dipped back just below 1.70%.
Dow Jones futures are lower by 118 points with 30 minutes left to the opening bell.
The core PPI unexpectedly dropped to -0.1% for July, well below the expected +0.2% level, putting further pressure on the Federal Reserve to continue its path of lowering interest rates.
Current Outlook
The short-term rally lasted longer and moved higher than I was anticipating. There were several short-term resistance levels that were cleared rather easily, including the declining 20 hour EMA, 50 hour SMA, PPO centerline, and gap resistance. Here's a chart illustrating this on the NASDAQ:
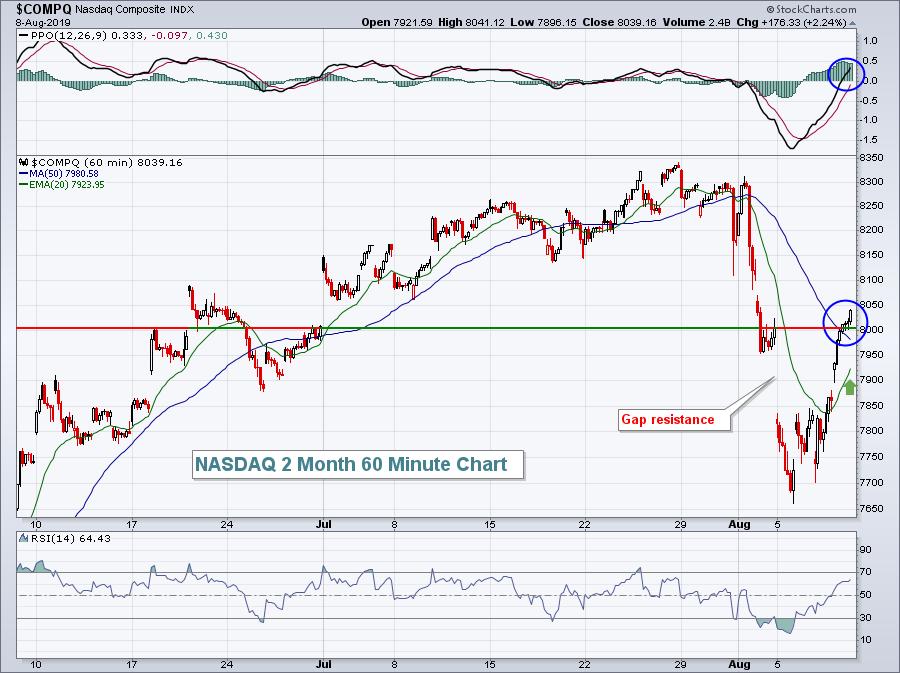
From a bullish perspective, selling that's contained above the now-rising 20 day EMA is what we should look for. A move back below 7900 could trigger more intense selling again, so watch that level.
Sector/Industry Watch
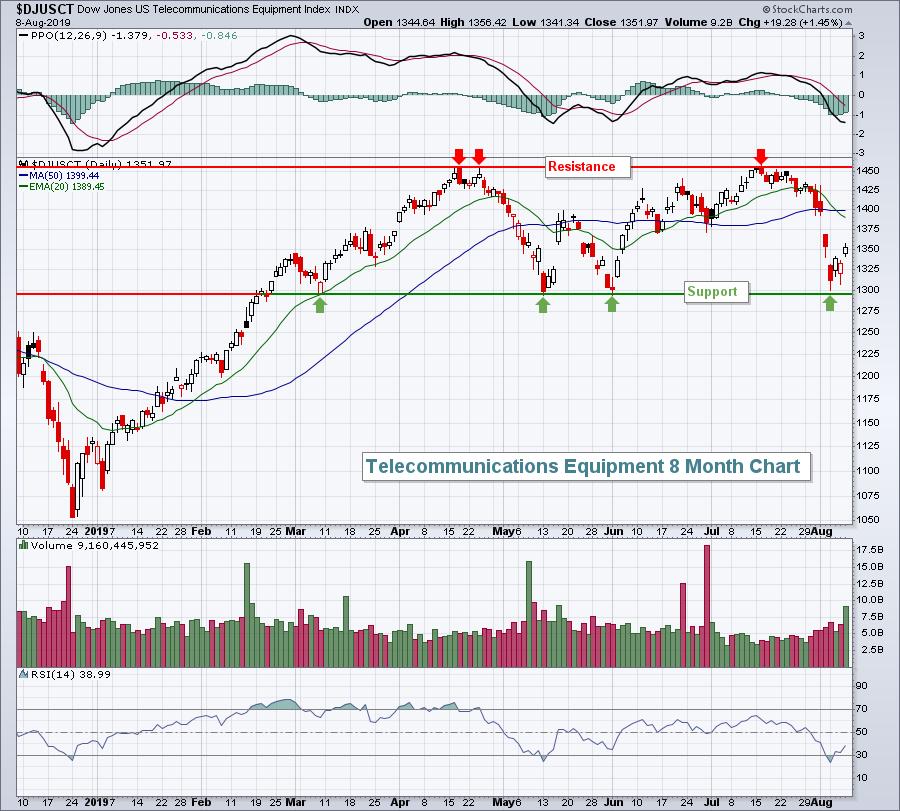
Telecommunications equipment ($DJUSCT) has outperformed the S&P 500 for the past two years, but if it's going to continue, that relative strength likely needs to resurface soon. On its absolute chart, it's consolidating and holding onto key support, but its relative strength has moved below its 50 week SMA for the first time since 2017.
First, the absolute chart:
....and now the relative chart:
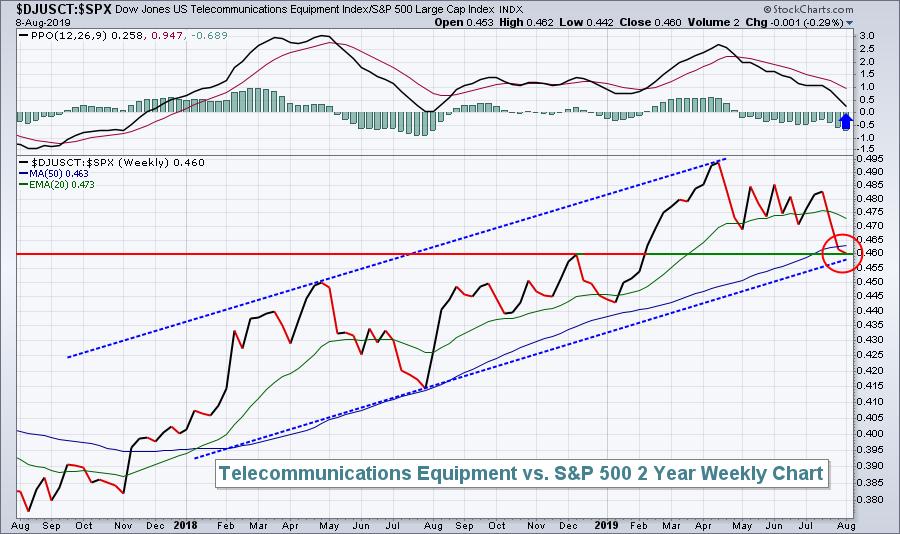
The weekly relative PPO is quickly descending upon its zero line, a level it has not been below since 2017. In other words, it's been nearly two years since this group has shown bearish relative momentum. There's a relative uptrend channel that's being tested, along with relative support and the relative 50 week SMA. Now's the time for telecommunications equipment stocks.
Historical Tendencies
Proctor & Gamble (PG) has shown a tendency to perform much better during the second half of calendar years. Over the past 20 years, here's PG's average performance, broken down by 1st half vs. 2nd half:
Jan-June: -3.6%
July-Dec: +11.8%
Here's the seasonality chart for a better visual:
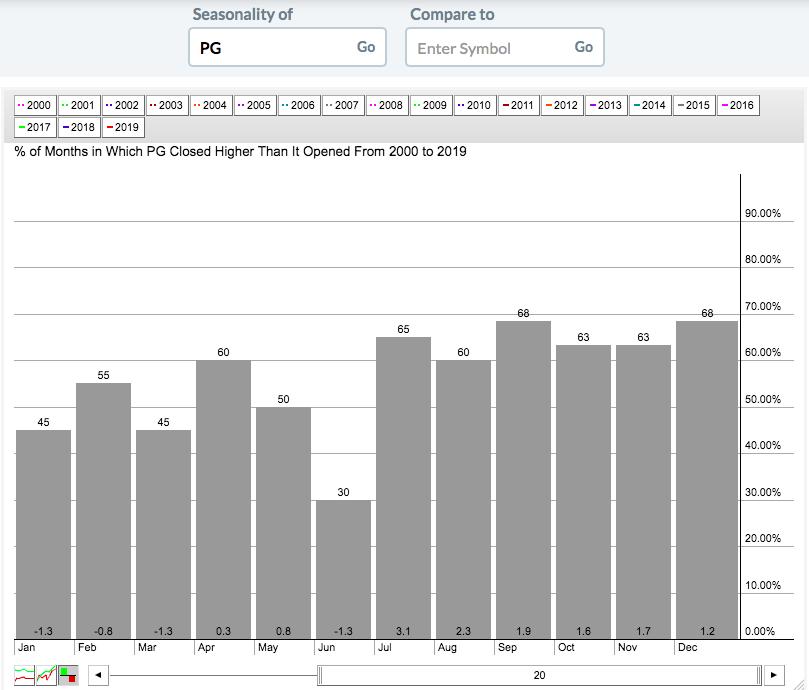
The good news is that PG looks really solid technically after released solid quarterly results recently. It'll be a candidate for my Income Portfolio for sure, with it being a more defensive stock with excellent relative strength and sporting a nice 2.64% dividend yield.
In this latest quarter, here are the returns on my various portfolios vs. the S&P 500 (since the new stocks were released on May 19th):
Aggressive Portfolio: +19.85%
Model Portfolio: +14.47%
Income Portfolio: +7.03%
S&P 500: +2.75%
I'll be discussing my portfolio strategies and results at a 4:30pm EST Monday webinar with EarningsBeats.com. It's completely FREE and will give you insights as to how to put a portfolio of relative winners together. CLICK HERE for details on how to join.
Key Earnings Reports
(actual vs. estimate):
CLNY: .11 vs .16
HPT: 1.03 vs 1.01
TERP: (.02) vs (.07)
Key Economic Reports
July PPI released at 8:30am EST: +0.2% (actual) vs. +0.2% (estimate)
July Core PPI released at 8:30am EST: -0.1% (actual) vs. +0.2% (estimate)
Happy trading!
Tom


