Market Recap for Wednesday, August 7, 2019
It appeared as though we were heading for another big down day as our major indices opened down 2% or thereabouts. There was a huge rush into treasuries with the 10 year treasury yield ($TNX) dropping to an almost unfathomable 1.59% shortly after the stock market opened. We're not far from the double bottom established in 2012 and 2016 at 1.34%. That's crazy. The good news is that if we remain near historic lows in interest rates with very low inflation, it's a great environment for growth and the U.S. economy is arguably the strongest in the world already. Those facts seemed to resonate with traders yesterday as buyers returned in a big way. The early losses were mostly erased with the more aggressive NASDAQ ending higher by 0.38%.
Results, while bullish given what we started with, were still mixed, however, as leadership came from materials (XLB, +1.38%), consumer staples (XLP, +1.17%), and real estate (XLRE, +0.93%). Technology (XLK, +0.62%) and consumer discretionary (XLY, +0.40%) did participate, though, providing the bulls with some ammunition as they fight to reclaim key price resistance levels overhead.
Central bankers continue to be extremely dovish around the globe. Central banks in New Zealand, India and Thailand cut interest rates sharper than expected yesterday. Hey Fed Chair Powell, are you paying attention? We need to cut rates further here in the U.S. and the bond market is imploring the Fed to act! Failure to do so will only strengthen the U.S. Dollar ($USD), sending commodity prices lower and starting the disinflation spiral that nobody wants. ACT NOW!
Pre-Market Action
The 10 year treasury yield ($TNX) is up 6 basis points this morning to 1.75%, a welcome relief for equities. Also, global stock markets were higher overnight in Asia and this morning in Europe and that's helping U.S. futures as well.
Dow Jones futures are higher by 100 points as we approach a new trading day.
Current Outlook
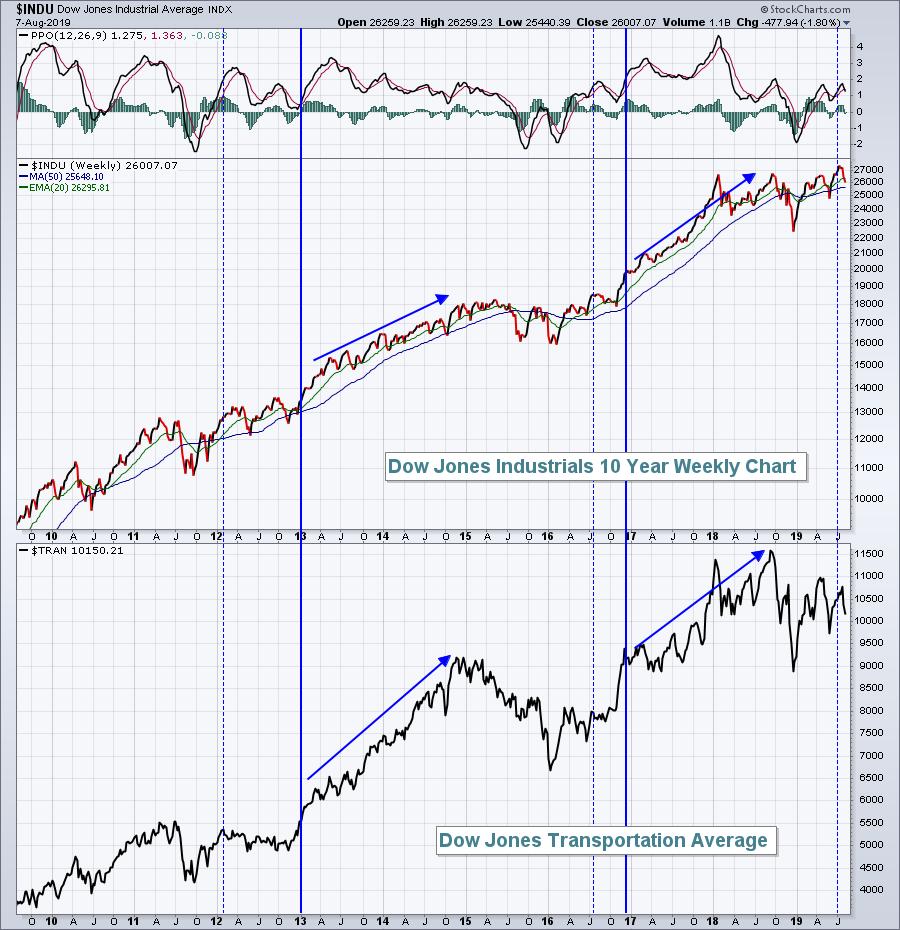
I discussed the Dow Theory on MarketWatchers LIVE yesterday with Carl Swenlin. As I looked at the Dow Jones Industrials ($INDU) vs. the Dow Jones Transportation Average ($TRAN), I realized that during the current bull market, when one confirms the other in breakout mode, the market explodes higher. Check this out:

The lighter-blue-dotted vertical line shows the Dow Jones Industrials breaking out. The darker-blue vertical line shows the Dow Jones Transportation Average also breaking out to confirm. The action in stocks price goes nearly parabolic after those confirmations. We've seen the $INDU break out, but thus far the $TRAN hasn't confirmed. If and when it does, we can expect a major advance in U.S. equities.
Sector/Industry Watch
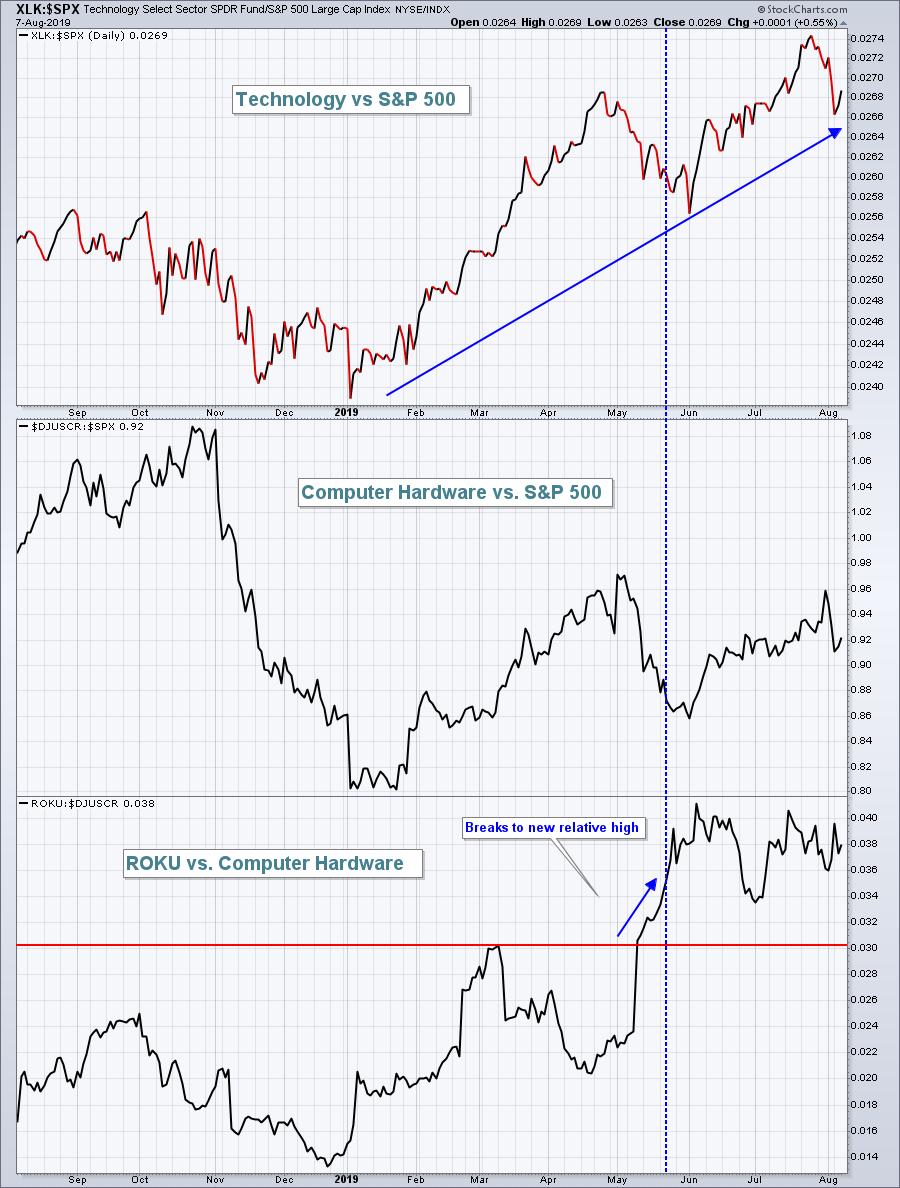
It's been a great year for technology stocks on a relative basis. But in a diversified portfolio, you don't want to own ALL technology stocks. You've got to pick a couple stocks that show very strong relative strength. Let me give you a perfect example. Computer hardware ($DJUSCR) is a technology industry group that's been "ok" in 2019. If you're going to own one, you want one that is showing tremendous relative strength. Roku, Inc. (ROKU) was added to my Model Portfolio on May 19th because it was breaking out to a new relative high and it had beaten Wall Street consensus estimates as to both revenues and EPS in their latest quarter. That combination is powerful. Here's the chart:

Do you see ROKU's relative breakout in May? That is a signal of Wall Street accumulation. I added ROKU at 84.03 on May 19th. Last night, after the bell, ROKU reported its latest results, again blowing away consensus estimates. At last check, ROKU is up more than 16% in pre-market trading today at 117.61. That's a 40% gain in less than three months. That return pales in comparison to Enphase Energy (ENPH), which has led a powerful rally in my Aggressive Portfolio. ENPH is up over 100% in less than 3 months. Crazy outperformance!
I am joining John Hopkins, EarningsBeats.com President, on Monday at 4:30pm EST. I'll be discussing the methodology for selecting these relative strength winners. Change the way you approach the market and join me for this FREE webinar. CLICK HERE for more information and details.
Historical Tendencies
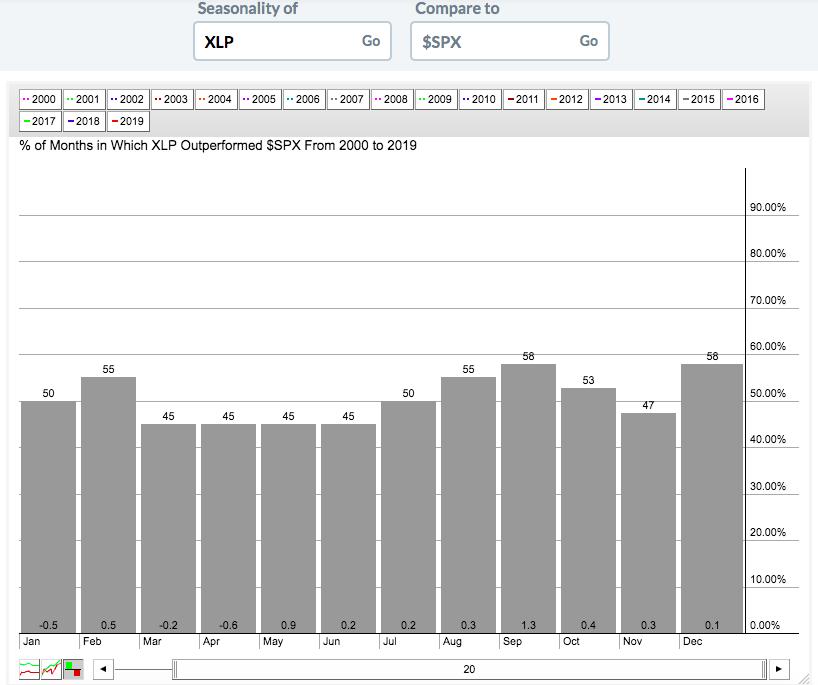
During the more bearish months of August and September, defensive sectors tend to outperform. This is quite clear when you look at the following seasonality chart for consumer staples (XLP) vs. the benchmark S&P 500 ($SPX):

Over the past 20 years, the XLP has outperformed the SPX in 55% of Augusts and 58% of Septembers and the average outperformance is +0.3% and +1.3%, respectively.
Key Earnings Reports
(actual vs. estimate):
AZUL: .09 - estimate, awaiting results
CAH: 1.11 vs .93
EPAM: 1.28 vs 1.23
KDP: .30 vs .29
KHC: .78 vs .75
LNG: (.44) vs .15
MGA: 1.59 vs 1.57
NCLH: 1.30 vs 1.26
NICE: 1.25 vs 1.21
NOMD: .30 vs .25
OGE: .50 vs .48
PNW: 1.43 - estimate, awaiting results
PRGO: .86 vs .81
TRGP: (.33) - estimate, awaiting results
TW: .25 vs .23
VIAB: 1.20 vs 1.13
(reports after close, estimate provided):
AQN: .13
ATVI: .26
BAP: 4.13
CBS: 1.13
COLD: .28
DBX: .08
DXC: 1.71
EQH: 1.03
FTCH: (.20)
NKTR: (.80)
NWSA: .02
PCTY: .25
SYMC: .32
TTD: .68
UBER: (3.33)
WPM: .10
Key Economic Reports
Initial jobless claims released at 8;30am EST: 209,000 (actual) vs. 215,000 (estimate)
June wholesale inventories to be released at 10:00am EST: +0.2% (estimate)
Happy trading!
Tom


