Market Recap for Tuesday, August 27, 2019
U.S. equities were strong out of the gate on Tuesday, but had little follow-through as sellers re-emerged. Early gains on our major indices quickly vanished and these key indices were left trying to minimize losses into the close. There were no significant breakdowns, but definitely more anxiousness with the Volatility Index ($VIX) rising 5% and still above 20. We can make an argument that there's a steady downtrend in the VIX since early August, but that comforts me little with the absolute reading still above 20:
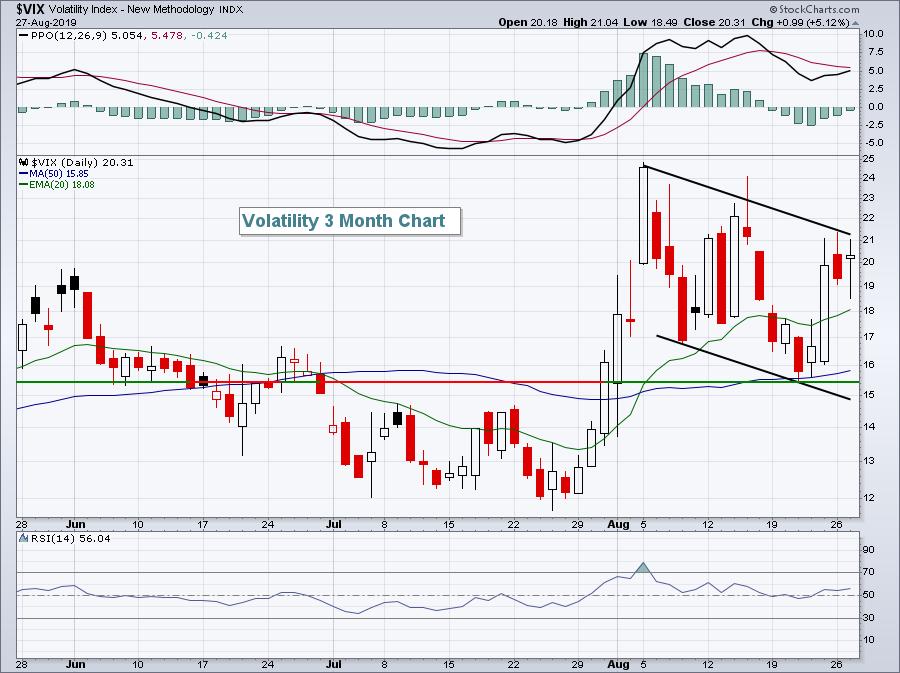
A definitive break in the VIX beneath 15 would be a bullish development for equities. Until then, and especially with the volatile month of September awaiting, we should remain very cautious. I would not be shorting anything, but building cash in this current environment and during this time of year isn't a bad strategy at all, even if the market breaks higher and you miss some upside. Here's what the VIX historically does in September:

This is for the last 20 years. The VIX shows high average returns during the summer months, which makes sense because that's when U.S. equities have traditionally struggled. Those with a shorter-term view might find the last 5 years history interesting:
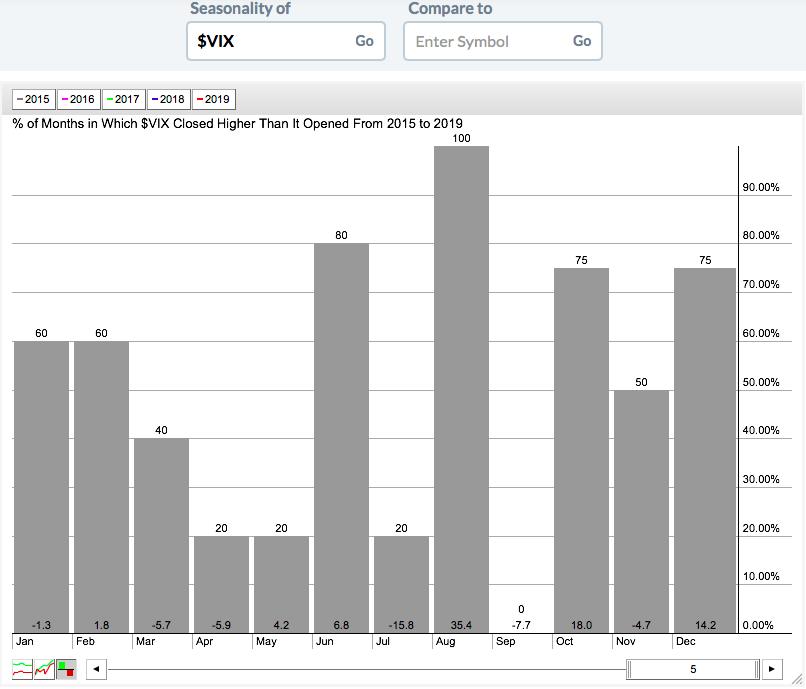
We've seen massive spikes in the VIX during August, but the VIX has gone down each of the last 5 years during September. The bulls are hoping this streak is extended to 6 years in 2019.
While the VIX is one of the biggest stories right now, there was actually market action yesterday. Energy (XLE, -0.62%) and financials (XLF, -0.61%) were the two worst performers. The XLF was hit yet again by falling treasury yields as the 10 year treasury yield ($TNX) tumbled 6 basis points to finish at 1.49%, its lowest close in 3 years and moving perilously close to the all-time low set in 2016 at 1.34%. The TNX is lower again this morning.
Pre-Market Action
The TNX is a big story once again. It's down another 3 basis points to 1.46%, which is likely to squeeze financials once again. Banks ($DJUSBK) and life insurance companies ($DJUSIL) have been the biggest losers. Over the past three months, the DJUSIL has fallen nearly 10%, completely cratering on a relative basis vs. the S&P 500.
Asian markets were mixed overnight, but the bias is much more negative in Europe as the German DAX ($DAX) is down more than 1% this morning. That could set the stage for a rough day here in the U.S.
Dow Jones futures are lower by 59 points with a little over 30 minutes left to today's opening bell. Be very careful if the S&P 500 loses its key short-term support zone that I illustrate next in Current Outlook.
Current Outlook
Volatility ($VIX) remains elevated and above 20, which means we need to remain somewhat cautious. The S&P 500 remains firmly entrenched in a short-term trading range that I've pointed out here a couple times over the last week or two. But it's worth mentioning again as a breakout of this range could give us a major directional clue:
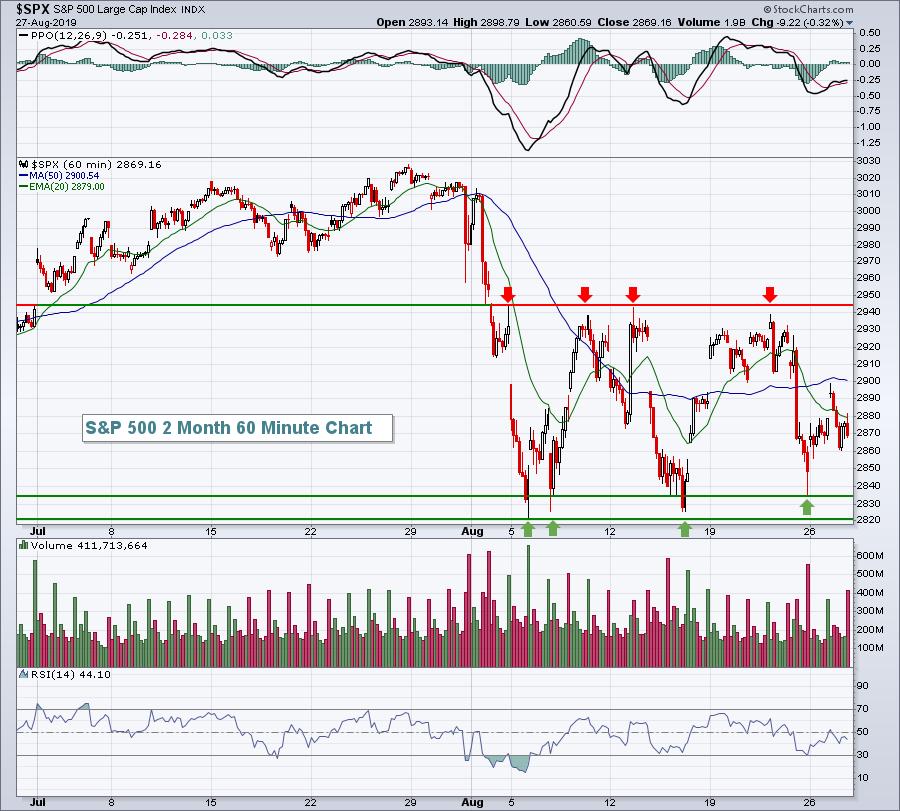
Key price support lies between 2820 and 2835, while key price resistance is in the 2935 to 2945 area. That's a fairly wide 100-125 point trading range for our benchmark index.
Special Note
On Monday, during the Earnings Spotlight segment on MarketWatchers LIVE, I provided near-term outlooks for probably a dozen stocks that were about to report quarterly results. Using relative strength and volume trends, I indicated which stocks had the best chance for a solid report and guidance. Thus far, most of my analysis has been correct. Here was one of my quotes re Autodesk (ADSK). "I don't know what's coming out of their earnings report, but I would not trust this one at all".
UPDATE: ADSK, while beating both revenues and EPS for its current quarter, lowered its EPS guidance for next quarter and its revenue and EPS guidance for FY20. ADSK is down $18 or 12% in pre-market trading. We need to understand what Wall Street is telling us. This is a primary focus of my EarningsBeats.com Digest newsletter, which is completely FREE. CLICK HERE to subscribe to the newsletter and join our community of knowledgeable traders. Thanks!
Sector/Industry Watch
The Dow Jones U.S. Soft Drinks Index ($DJUSSD) has mostly ignored all the market volatility of late, instead charging to new highs. But there is a warning sign that would suggest keeping a stop in place on any trades made in this group. Here's a weekly chart, clearly illustrating the negative divergence that's in play:
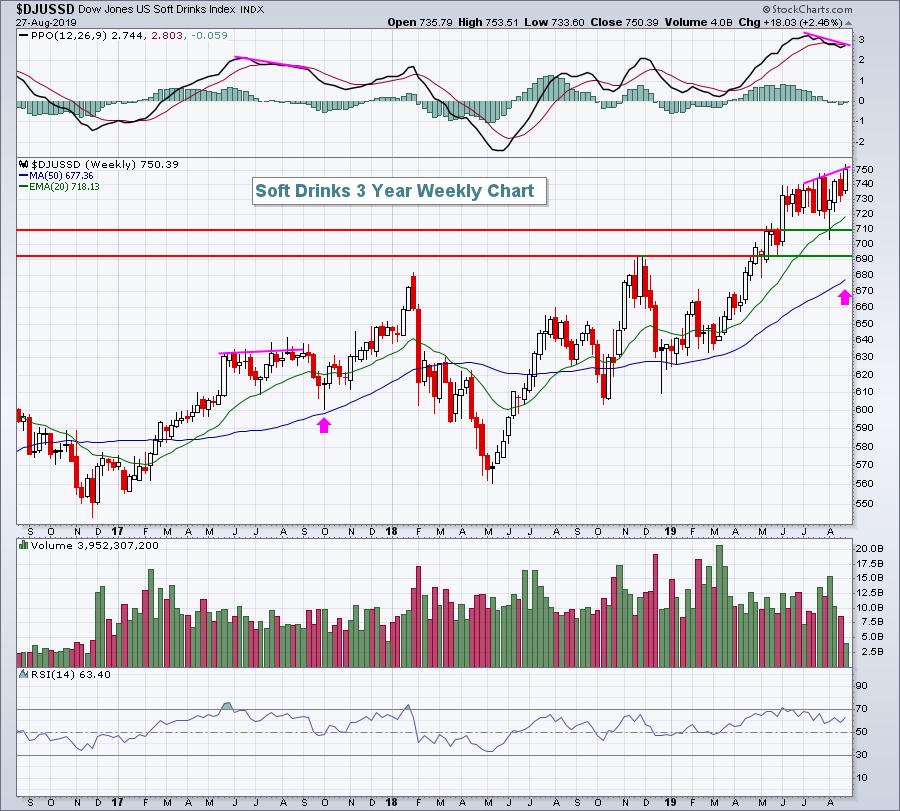
The last time we saw anything similar to this was in August 2017 and, less than two months later, there was roughly an 8% correction to approach its 50 week SMA. These divergences do not necessarily signal that a downtrend is approaching. Many times, it's simply a warning that the current uptrend is losing its momentum and needs a "reset", accomplished by a 50 week SMA and/or PPO centerline test.
Looking at the two big names in the group, Coca Cola Co (KO) appears to be more solid technically than Pepsico, Inc. (PEP), which is sporting a weekly negative divergence of its own.
Historical Tendencies
Advanced Micro Devices (AMD) has been a solid performer, albeit volatile, for the past couple years. And while the semiconductor group ($DJUSSC) as a whole has been flat the past 16 months, AMD has tripled in value. There's a headwind ahead, however, and it comes in the form of September and October, arguably the worst two months for AMD over the past two decades:
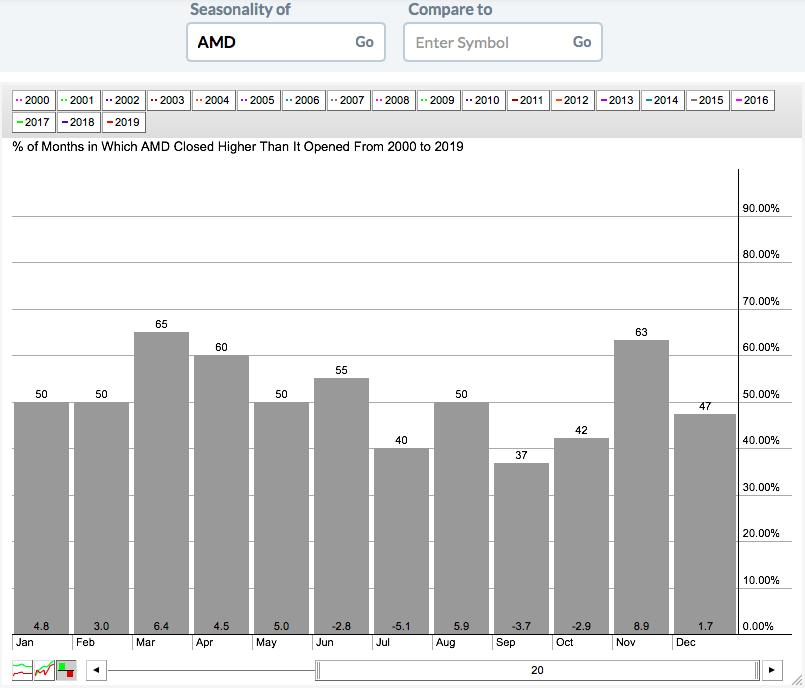
Yes, average returns in June and July have been a bit worse, but the odds of September and October moving higher have been less as the bars reflect. Septembers have risen 37% of the time, while Octobers aren't much better, rising just 42% of the time. Of course, this isn't a guarantee we'll see lower prices, but it's historical knowledge worth having, especially in the event we see a technical breakdown on AMD over the next two months.
Key Earnings Reports
(actual vs. estimate):
BF/B: .39 vs .37
COTY: .16 vs .16
DY: 1.09 vs .84
TIF: 1.12 vs 1.05
(reports after close, estimate provided):
AMK: .22
BOX: (.01)
ESTC: (.42)
FIVE: .50
GEF: 1.18
GES: .29
HRB: .76
NTNX: (.64)
OKTA: (.10)
OLLI: .46
PVH: 1.89
SMTC: .36
WSM: .83
ZUO: (.14)
Key Economic Reports
None
Happy trading!
Tom


