Special Event Today!
This is probably the most excited that I've been for an event ever. I honestly believe that the lineup of products and services that we've put together at EarningsBeats.com will benefit thousands of followers/subscribers across the globe. After spending 20 years in public accounting, 10 years at Invested Central/EarningsBeats.com, and the last 4 1/2 years at StockCharts.com, I announced last month that I was returning to EarningsBeats.com as its Chief Market Strategist. I've paid more than my fair share of stock market "tuition" over the years and I'm quite prepared to transfer those "credits" to the EarningsBeats.com community, so that everyone can skip those "courses". :-)
While September 15th is the "official" date of my move back to EarningsBeats.com, you won't notice a huge difference here at StockCharts.com. I plan to continue writing my daily Trading Places blog articles, but they'll likely be shorter, providing lesser content out of necessity given my new role at EarningsBeats.com. I will also be leaving MarketWatchers LIVE on StockCharts TV at the end of September, but I'll be starting a brand new show, "Trading Places LIVE!", that will air on Tuesdays and Thursdays, from 9:00am-9:30am EST, just before the stock market opens.
My approach to the stock market is one that should benefit both short-term traders and longer-term investors. I value both fundamentals and technicals and am uniquely qualified to do so. My mission is to do everything in my power to stack the investing odds in your favor - to make a positive difference in your financial future. If I can do that, then my mission will have been a success.
It all starts with today's event!
I will be hosting a 4:30pm EST webinar that is open to EVERYONE. There's no cost to attend this event. If you'd like more information, CLICK HERE. There are instructions for joining the webinar at the bottom of the information provided.
Market Recap for Friday, September 6, 2019
The August employment report was released on Friday and it unfortunately came in below expectations. I suppose we could argue that is bullish given that the Fed is watching economic reports closely to see if another interest rate cut is in the cards for later this month. However, I'd avoid connecting economic reports to what the Fed might do. Honestly, I don't believe the Fed's interest rate discussions and decision is all about economic conditions and performance. If it was, they wouldn't have cut rates earlier this year. The Fed's mandate includes "price stabilization". Given the dollar's strength, cutting rates may provide a bit of weakness in the dollar, helping to "inflate" prices a bit. The Fed has room for a bit more inflation so an interest rate cut could make sense on that front, while it also would help to bolster confidence at a time when the trade war has been eroding that confidence.
U.S. equities were mixed on Friday with the Dow Jones and S&P 500 finishing with slight gains, while the Russell 2000 and NASDAQ ended the session with minimal losses. It was likely a consolidation day after we saw our major indices mostly breakout from a wide August trading range earlier in the week.
Energy (XLE, +0.53%) and materials (XLB, +0.39%) were the two leading sectors - we haven't seen that too often in 2019, but a flat U.S. Dollar Index ($USD) likely contributed to it. In the meantime, utilities (XLU, -0.40%) suffered from the 10 year treasury yield ($TNX) climbing above its 20 day EMA for the first time in five weeks.
All of the aggressive sectors languished in the middle of the sector pack, providing no further catalyst for rising equity prices.
Pre-Market Action
The 10 year treasury yield ($TNX) is higher by 4 basis points, helping U.S. futures this morning. With 30 minutes left to the opening bell, Dow Jones futures are up 58 points. Asian and European stocks are mostly, but modestly, higher as well.
Current Outlook
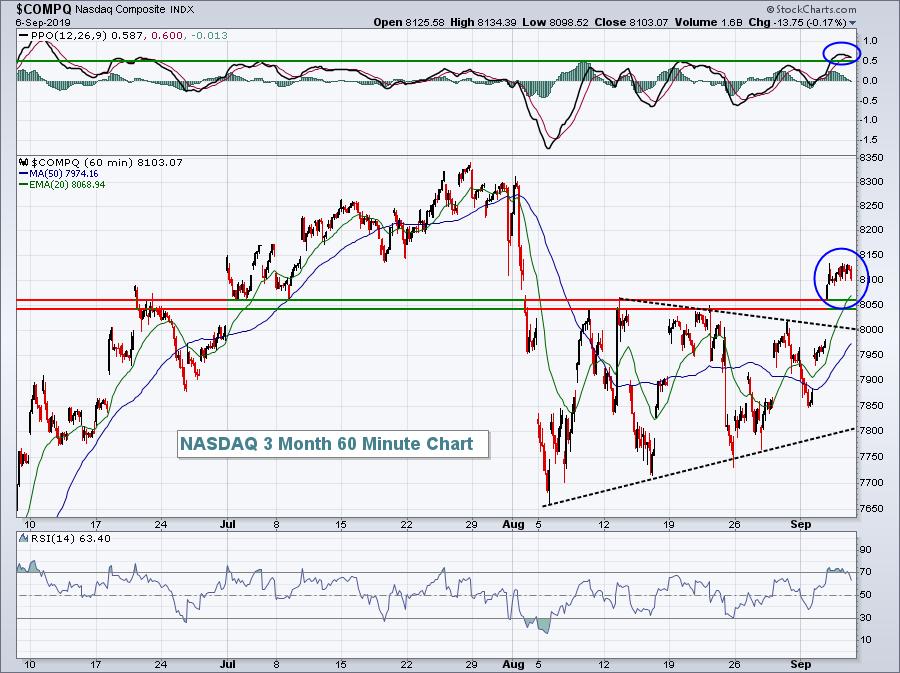
I've looked very closely at the S&P 500 hourly chart over the past several weeks as it consolidated during August and into early September. Here's a look at the NASDAQ, which is fairly similar:

On the breakout last week, perhaps one noteworthy technical development emerged other than the obvious price breakout. The hourly PPO surged to more than 0.5, which was its highest reading since mid-June. While that guarantees us nothing in terms of future performance, it does highlight what appears to be the NASDAQ's strongest upside momentum in nearly three months, a bullish development.
Sector/Industry Watch
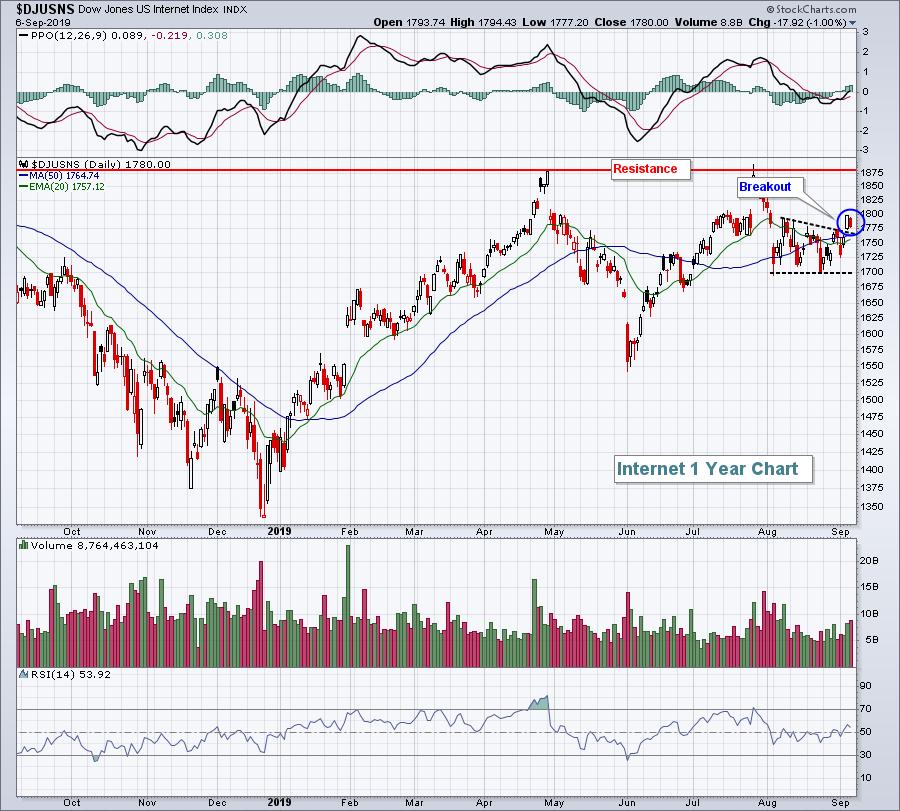
Internet stocks ($DJUSNS, -1.00%) saw some profit taking on Friday, but certainly appear poised for further gains:

First, there was a triangle breakout on Thursday, which should lead to further short-term strength, perhaps to test the double top price resistance near 1880. Second, September and October have been the best back-to-back calendar months for internet stocks over the past two decades, posting average gains of +12% during just these two months. That's an average return over the past 20 years!
If you think it works every year, however, you simply need to look back to 2018 to be brought back down to earth. Internet stocks, along with the overall market, were hit hard in October 2018.
Monday Setups
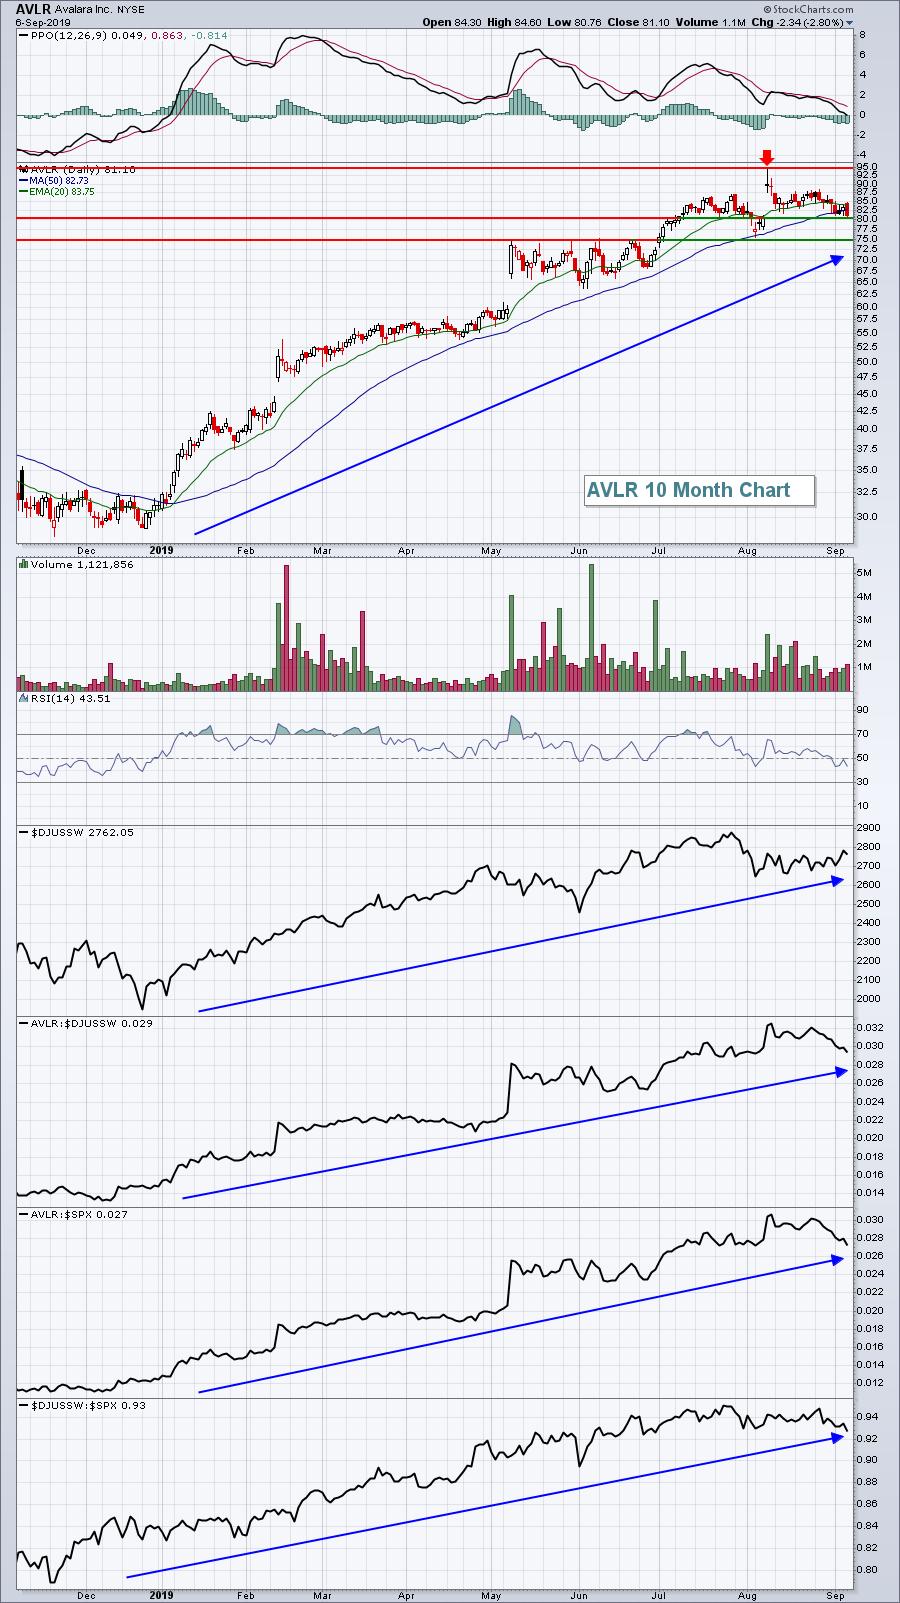
I posted over the weekend in the Don't Ignore This Chart blog and identified one of my Strong Earnings ChartList stocks that belongs to the very strong software industry group ($DJUSSW). It easily soared past both revenue and EPS estimates in its latest quarter and had quite a positive reaction, establishing a new all-time high. Since then, however, we've seen profit taking kick in as Avalara, Inc. (AVLR) has fallen from 95 to 81. I believe the support zone is in the 75-80 area. I like entry at the current price and again near 75 with a closing stop beneath 74. My initial target would be a test of 95 resistance. Here's the chart:

My favorite trades are those companies that are leaders within strong industry groups. I think AVLR fits the bill.
Historical Tendencies
We know September historically has been a bad month. But there are different levels of "bad". Here's a breakdown of September S&P 500 performance throughout the month (since 1950):
Sept 1-19: +7.76%
Sept 20-26: -38.88%
Sept 27-30: -6.94%
While the majority of the month has annualized returns fairly close to zero, the week that we really need to pay attention to is September 20-26. To add more spice in 2019, Friday, September 20th this year is also monthly options expiration Friday.
Let's also keep in mind that the Fed meets on September 17-18 and their policy announcements in December 2018, May 2019, and July 2019 preceded the last three big drops in U.S. equity prices.
Key Earnings Reports
(reports after close, estimate provided):
CTRP: .30
Key Economic Reports
None
Happy trading!
Tom


