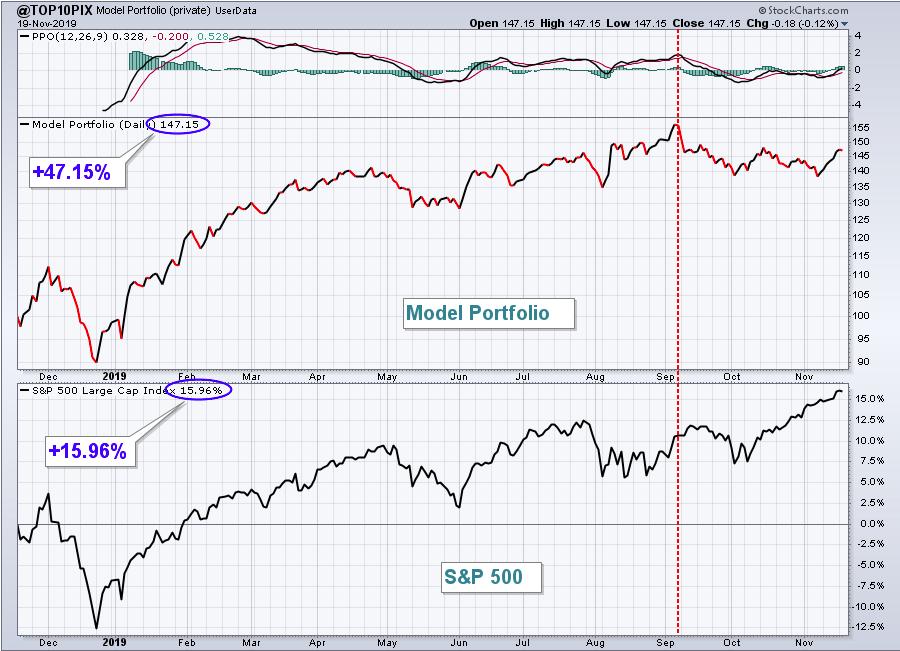
While there's no sugar coating that the market's sudden shift in August from growth stocks to value stocks cut into my returns, I'm still quite proud of my Model portfolio's performance after its one year anniversary yesterday. On November 19, 2018, I unveiled 10 stocks that were equal-weighted and in 10 different industry groups. They all had two common ingredients, however. First, they all beat Wall Street consensus estimates as to both revenues and earnings per share (EPS) in their most recent quarterly earnings report. Second, they all showed relative strength to their peers and to the benchmark S&P 500. In other words, they were all relative leaders. I've continued this practice every three months since then and just completed my 4th quarter. The cumulative results are in for Year 1 and here they are:

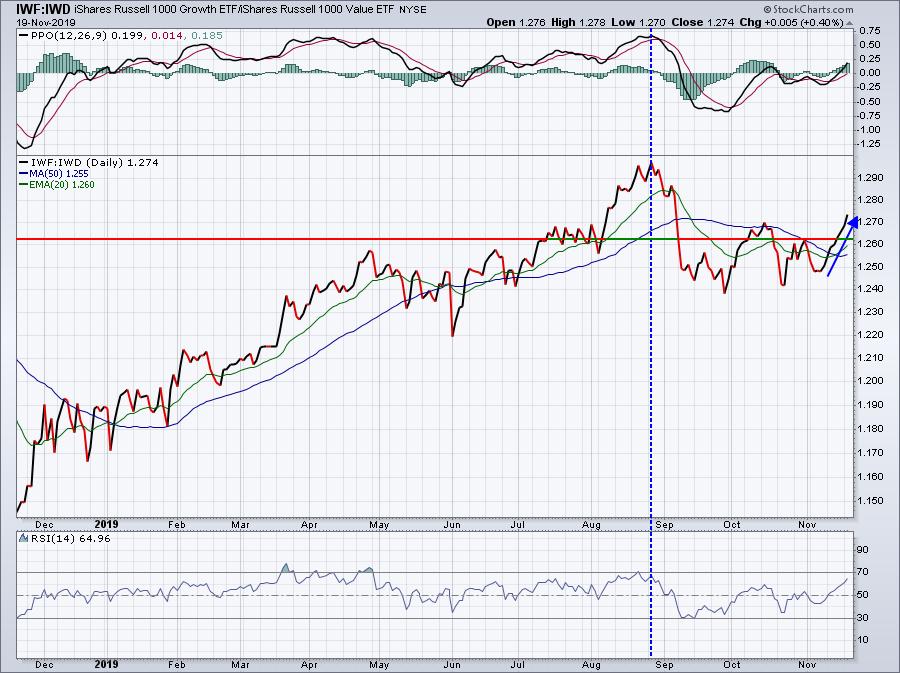
I drew a red-dotted vertical line on the chart above as that's when the strategy seemed to struggle. It was fairly well explained, however, by the market's shift from growth stocks to value stocks:

Growth stocks (IWF) led value stocks (IWD) throughout the past year, but the ratio (IWF:IWD) took a dive beginning in late-August. That coincided with my Model portfolio's rough performance in its latest quarter. However, you can see the ratio surging back in November. In November, my Model portfolio absolutely crushed the S&P 500 to regain more than half of its earlier underperformance.
I track the daily performance on my portfolio using the User-Defined Index here at StockCharts.com. Beating the S&P 500 by 1 percentage point over the course of the year would be significant, but trouncing it by more than 31 percentage points? That's just crazy. It's the culmination of trading industry group leaders for 3 months, then loading up with 10 more industry leaders the next quarter. And so on and so forth.
Few companies perform well nearly every quarter. There's aren't many Apples (AAPL) and Microsofts (MSFT) out there. Many companies have a great quarter or two and then six months later are right back where they started. Holding onto them yields little, but holding them only while they're leaders makes great sense and the results prove it.
Last night, I unveiled my 10 stocks for the next three months in my Model portfolio. I also have an Aggressive portfolio and Income portfolio that commenced May 19, 2019 and here are their "since inception" returns vs. the benchmark S&P 500:
Aggressive Portfolio: +13.08% vs. +9.12%
Income Portfolio: +11.76% vs. +9.12%
Keep in mind that my portfolio performance does not take into consideration any dividends. The S&P 500 does. So the outperformance, with dividends, would be even greater.
In addition to releasing the 10 stocks in each of the 3 portfolios - Model, Aggressive, and Income - I also unveiled a new "Value Portfolio" that comprises 10 stocks in 10 different industries that saw a change in character in their charts after their last earnings releases. In other words, they surprised Wall Street with a solid quarter and appear to have reversed prior downtrends. If that turns out to be the case, a few of these stocks could be looking at significant gains ahead. Time will tell.
There you have it. 4 portfolios. 40 stocks. 40 relative leaders. All beating the S&P 500 since inception.
My Top 10 Stocks event last night was recorded. I'd love to have you join me at EarningsBeats.com and grab a copy of the recording. CLICK HERE to start your $7 30-day trial. That's all it takes to receive the recording - 7 bucks!
Happy trading!
Tom


