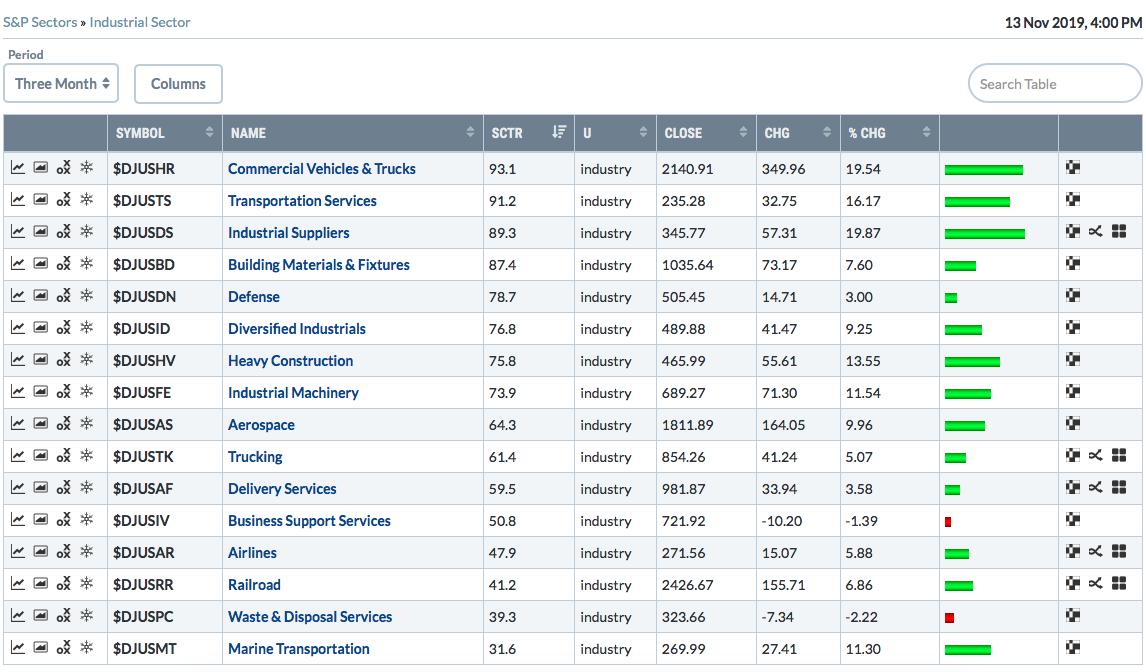
In my last article, I illustrated the relative breakout in industrials vs. the benchmark S&P 500. The market goes through cycles and leadership rotates - even during the same bull market. StockCharts.com recently added SCTR scores for industry groups, so if you're unsure as to which industries are leading, there's now a mechanical formula originally developed by John Murphy to help. Within the industrials space, here are the current SCTR scores, top to bottom:

I also showed under "Period" the returns for each industry group over the past three months. I'm planning to dive into a few of these groups later this morning on my Trading Places LIVE show on StockCharts TV during a popular segment called "Break It Down". If you'd like to join me, my show starts at 9am EST and runs for 30 minutes. When on Your Dashboard, simply click on the StockCharts TV in the top left corner of your page. This is how it looks:

Right in the middle you'll see StockCharts TV. I look forward to seeing you so we can "break down" the industrials.


