Any time you can beat the benchmark S&P 500, it's saying something. Many professionals managing money set the S&P 500 as the standard and try to beat it....and most fail. It's not an easy thing to do. But I do believe there's a secret sauce to beating the S&P 500. It doesn't work every quarter as I'm finding out in the latest quarter as money has rotated from growth stocks to value stocks, but it is a longer-term formula for success. The recipe only includes two primary ingredients:
Strong earnings and relative strength.
By selecting companies that beat Wall Street consensus estimates as to both revenues and EPS, you're eliminating companies that didn't and probably a number of companies that The Street has lost faith in. And by selecting only companies showing relative strength, you're likely buying into companies that Wall Street is accumulating.
On November 19, 2018, I unveiled my first Model Portfolio, which consisted of 10 leading stocks in 10 different and mostly strong industries. The idea is putting your money to work in the "best of the best" for 90 days and letting the chips fall where they may. All 10 stocks are held the entire 90 day period. No stops are used. You must hold each stock through one earnings report along the way. While I've never been an advocate of holding individual active trades into earnings reports, knowing that you'll be holding 10 into earnings reports helps to balance the risk. Will all 10 leaders that just beat Wall Street estimates lay eggs in their next quarterly report? All 10? Probably not. In fact, my experience thus far has been that the majority report strong results again in the next quarter, although plenty of eggs have been laid. The good has clearly outweighed the bad and here's the daily tracking of this Model Portfolio using the User-Defined Index here at StockCharts.com since its inception on November 19, 2018:
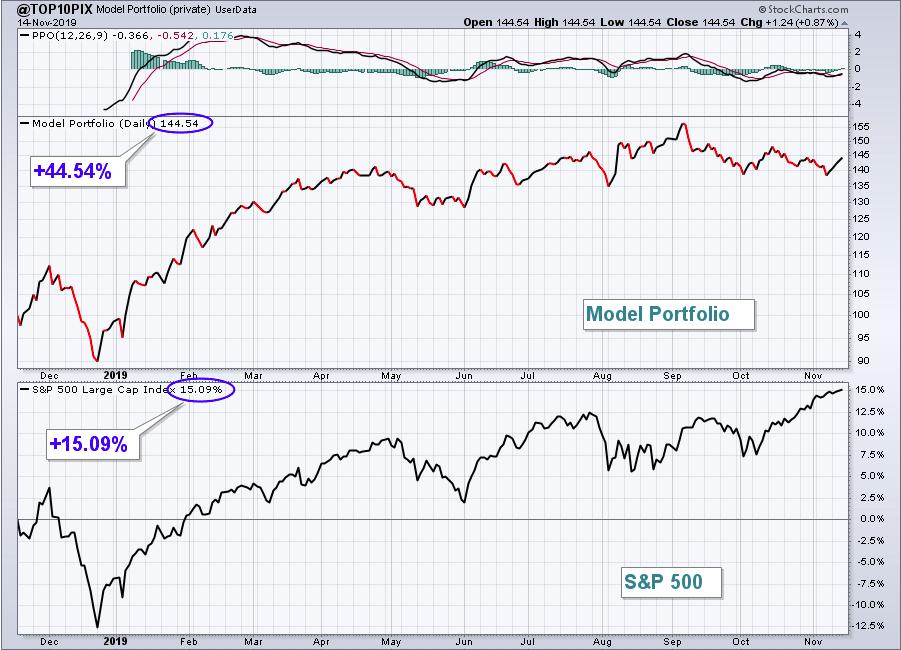
On Tuesday, it will be November 19, 2019 and I will have my first year of Model portfolio performance under my belt. Through Thursday's (yesterday's) close, the Model Portfolio is up 44.54% with 3 trading days left. The S&P 500 has risen 15% over that same period. I'd say outperforming by nearly 30 basis points in one year is rather exceptional, despite having a rough last quarter. Can the overall strength be sustained over multiple years? Well, we'll begin to find out on Tuesday, because that's the date I'll unveil my next 10 stocks for the Model Portfolio to kick off the second year of portfolio performance.
I have two other portfolios - Aggressive and Income - that began on May 19th and the new stocks for each will also be announced on Tuesday. Since May 19th, the S&P 500 is up 8.29% while my Aggressive and Income portfolios are up 11.53% and 11.54%, respectively, over that same time period. None of the returns of my portfolios include dividends and the Income portfolio in particular has an average yield of nearly 2% among its portfolio component stocks.
If you'd like to be there on Tuesday as I announce these companies that will comprise each of my 3 portfolios, it only takes a $7 30-day trial membership to EarningsBeats.com. CLICK HERE to get started.
As a membership benefit, you'll receive my Daily Market Report (DMR) every day. Here's a sample - Wednesday's DMR:
****************************
Executive Market Summary
- Once again, futures were weak and buyers were ready at the opening bell
- October CPI was a bit hotter than expected, rising 0.4% vs. the expected 0.3%; October PPI will be released tomorrow
- Alphabet (GOOGL) announced an initial partnership with Citigroup (C) and a California credit union to provide checking accounts through its Google Pay app
- Today's rebound from opening losses is nice, except for one issue: Defensive sectors are leading today's action
- Energy (XLE) is the lagging sector today
- Our two Active Trade Alerts are down today as retail stocks (XRT) test their rising 20 day EMA
Market Outlook
The mostly sideways consolidation over the past few days may be getting close to its conclusion. While I've discussed the recent issue associated with a short-term 60 minute negative divergence, the intermediate-term and long-term outlook for the S&P 500 remains quite bullish. Should we see a bit more selling near-term, just keep in mind that the rising 20 day EMA on the daily chart would be a reasonable place to expect buyers to return:
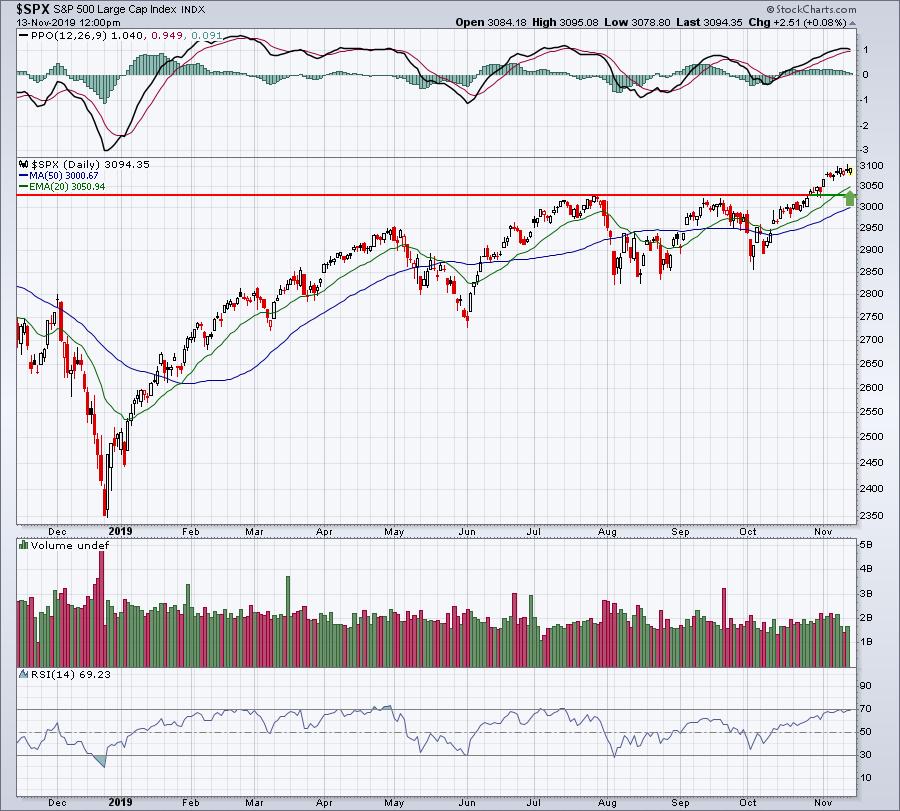
The 20 day EMA is now up to 3050 and there's price support just beneath that level. I don't believe we'll see short-term action beneath these two levels, not with a daily PPO that looks as strong as the current one. And if guests at your next dinner party ask why this S&P 500 breakout is different from the past two in May and August, be sure to let them know that the U.S. stock market is (1) no longer acting as if trade tensions are a problem with the Volatility Index ($VIX) in the 12-13 range and beneath its 20 day EMA and, (2) being led by transportation stocks, which the prior two were not. Remind them of the Dow Theory and be a hero. :-)
Sector/Industry Focus
Transportation stocks ($TRAN) have led this latest S&P 500 rally and breakout, and if the rally is to continue, it'll likely depend on further participation and leadership among transportation stocks. We're currently seeing a pullback which, given the short-term overbought conditions, is not a problem. I would like to see the 20 day EMA hold, followed by another breakout, however:
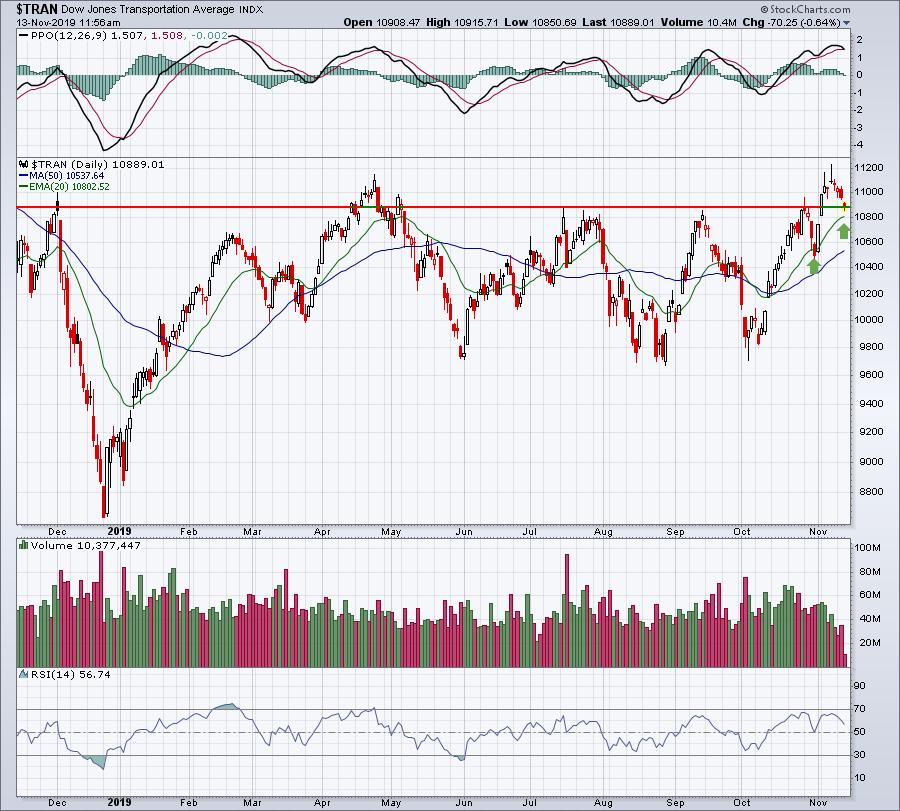
We've lost roughly 300 points thus far on the recent bout of profit taking, but this provides an opportunity for entry in my opinion. If you don't like to trade individual stocks, the iShares Transportation Average ETF (IYT) would be a more diversified alternative.
Strong Earnings ChartList (SECL)
We have completed our latest update of our SECL and we now have 307 stocks on our list. We have sent out our SECL to all EarningsBeats.com members that are also at least Extra members at StockCharts.com. If you are currently a StockCharts.com Extra member or above and are NOT receiving the SECL from us, we simply need your StockCharts User ID so that we can send you the list. You can contact "support@earningsbeats.com" with any questions.
Today, I ran a scan of INTRADAY high volume stocks on our SECL as of 11am EST. I looked for any stock that had traded at least 60% of its average daily volume over the past 90 days. 60% of normal volume through just the first 25%-30% of the trading day suggests we might want to look at the stocks. Here are the 15 stocks (out of 307 stocks on the SECL) that met this criteria today and sorted in SCTR order (highest to lowest):
QRVO, APPS, NVRO, RNG, CMRE, ATRS, ICHR, SSD, ELF, JCOM, HRC, CTAS, MR, CLVS, CRSP (no SCTR score for CRSP)
I found a few interesting. Here they are:
ATRS:
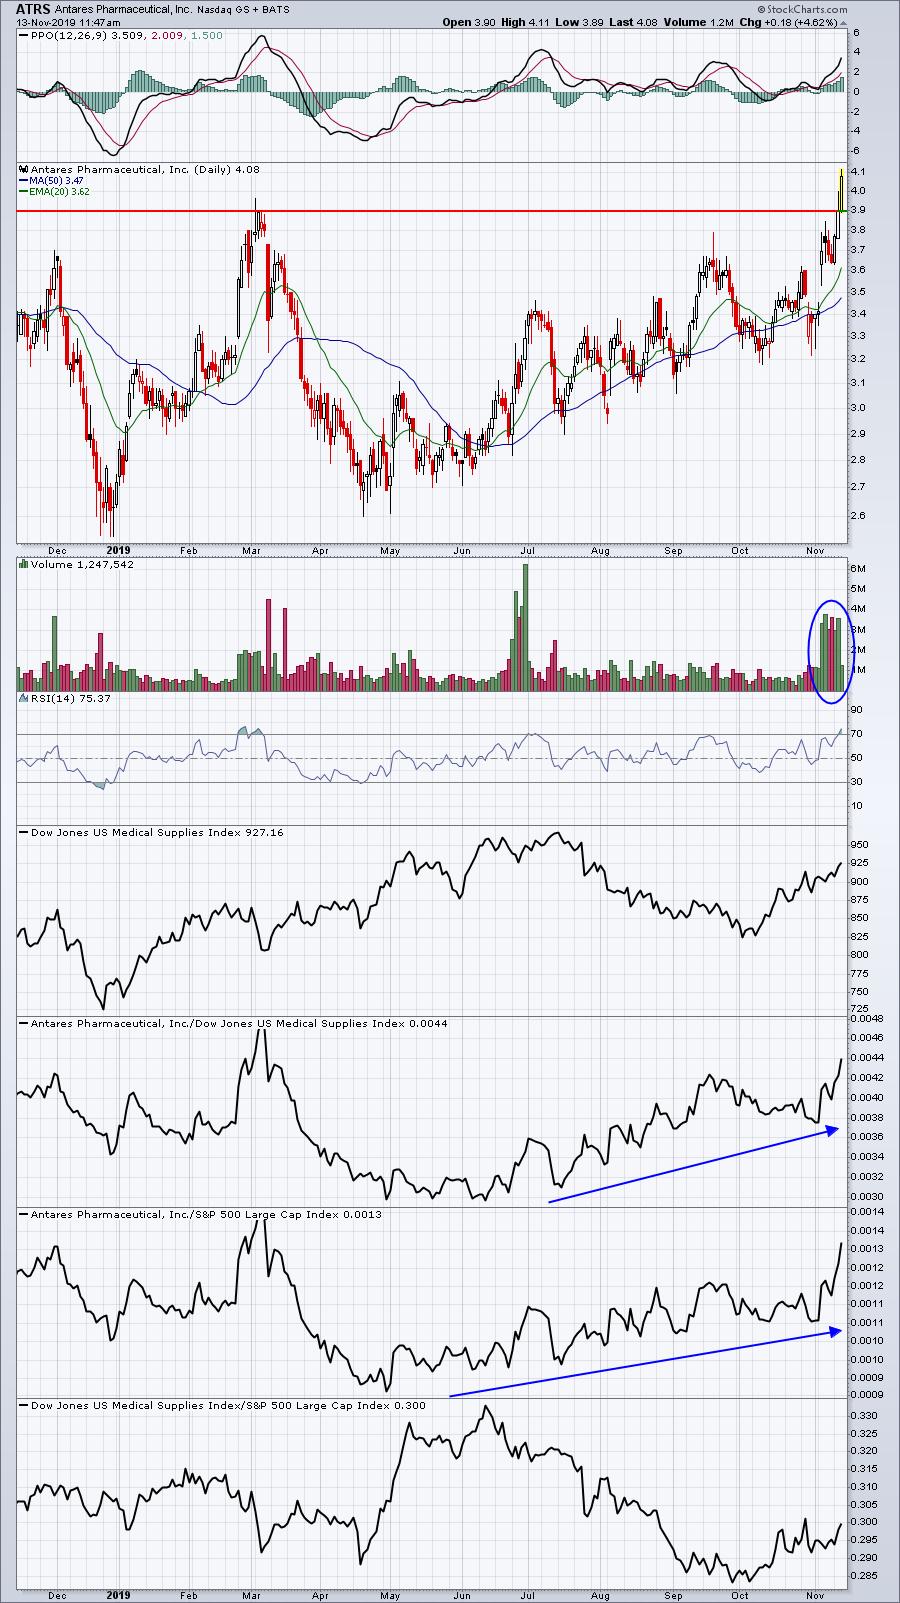
I'm always a fan of big volume breakout. It's difficult chasing stocks after big moves are already underway, but this is one to consider on a lighter volume pullback. 3.90 now becomes price support on the breakout.
HRC:
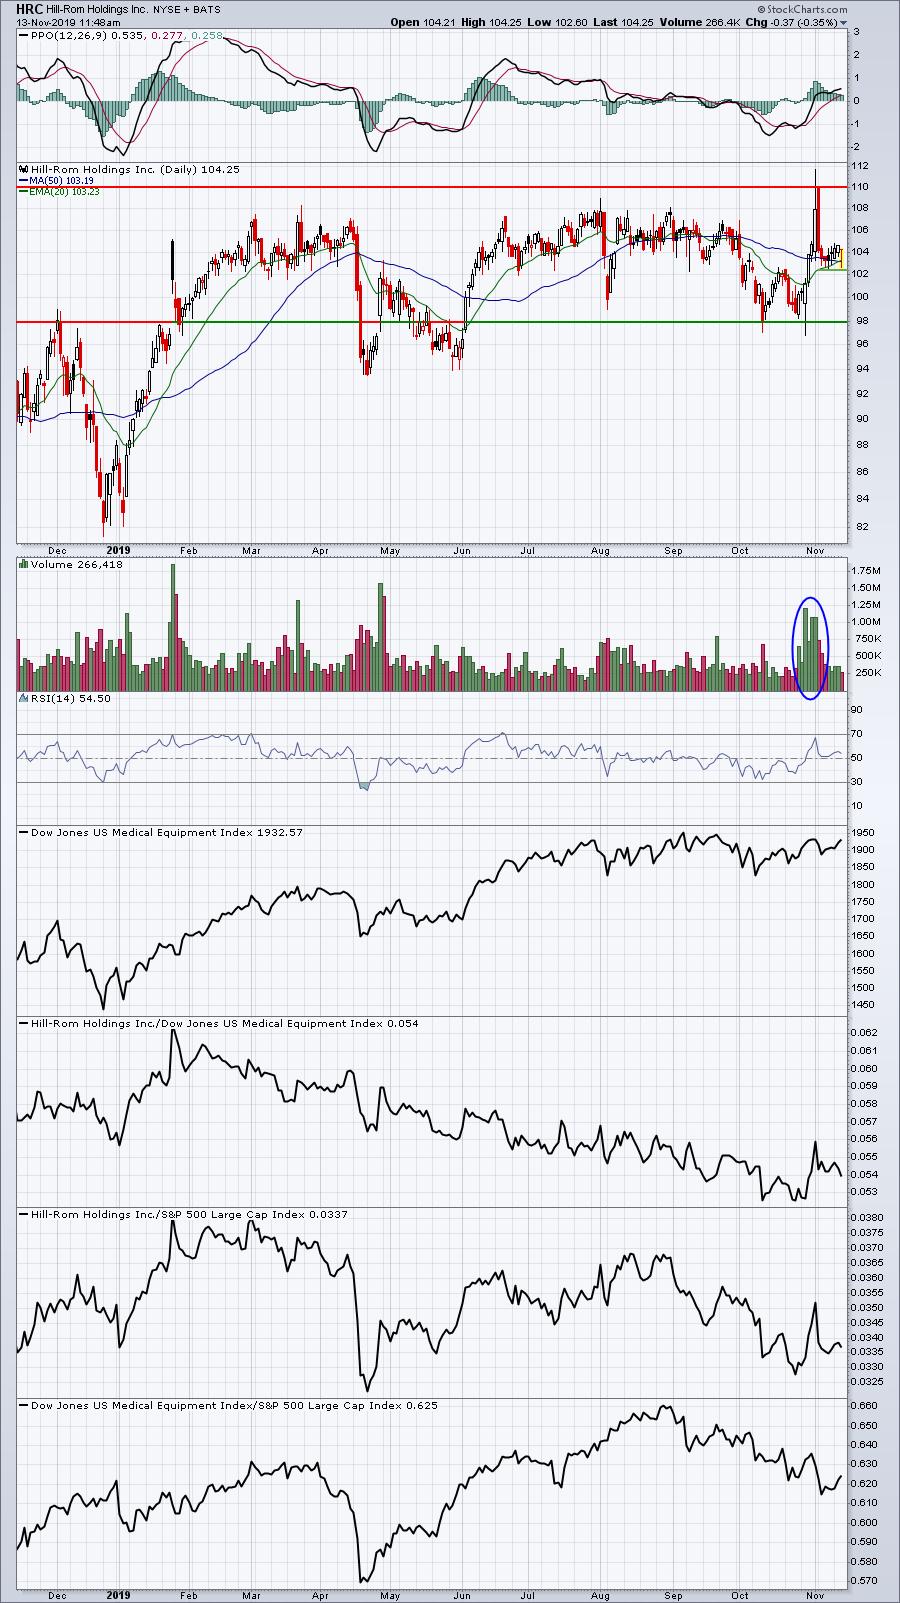
HRC had been a major laggard in the medical equipment industry ($DJUSAM) for months, but that recent gap higher on heavy volume cleared prior 2019 tops, a bullish sign. It pulled back to test its rising 20 day EMA and could be poised for further gains from here.
SSD:
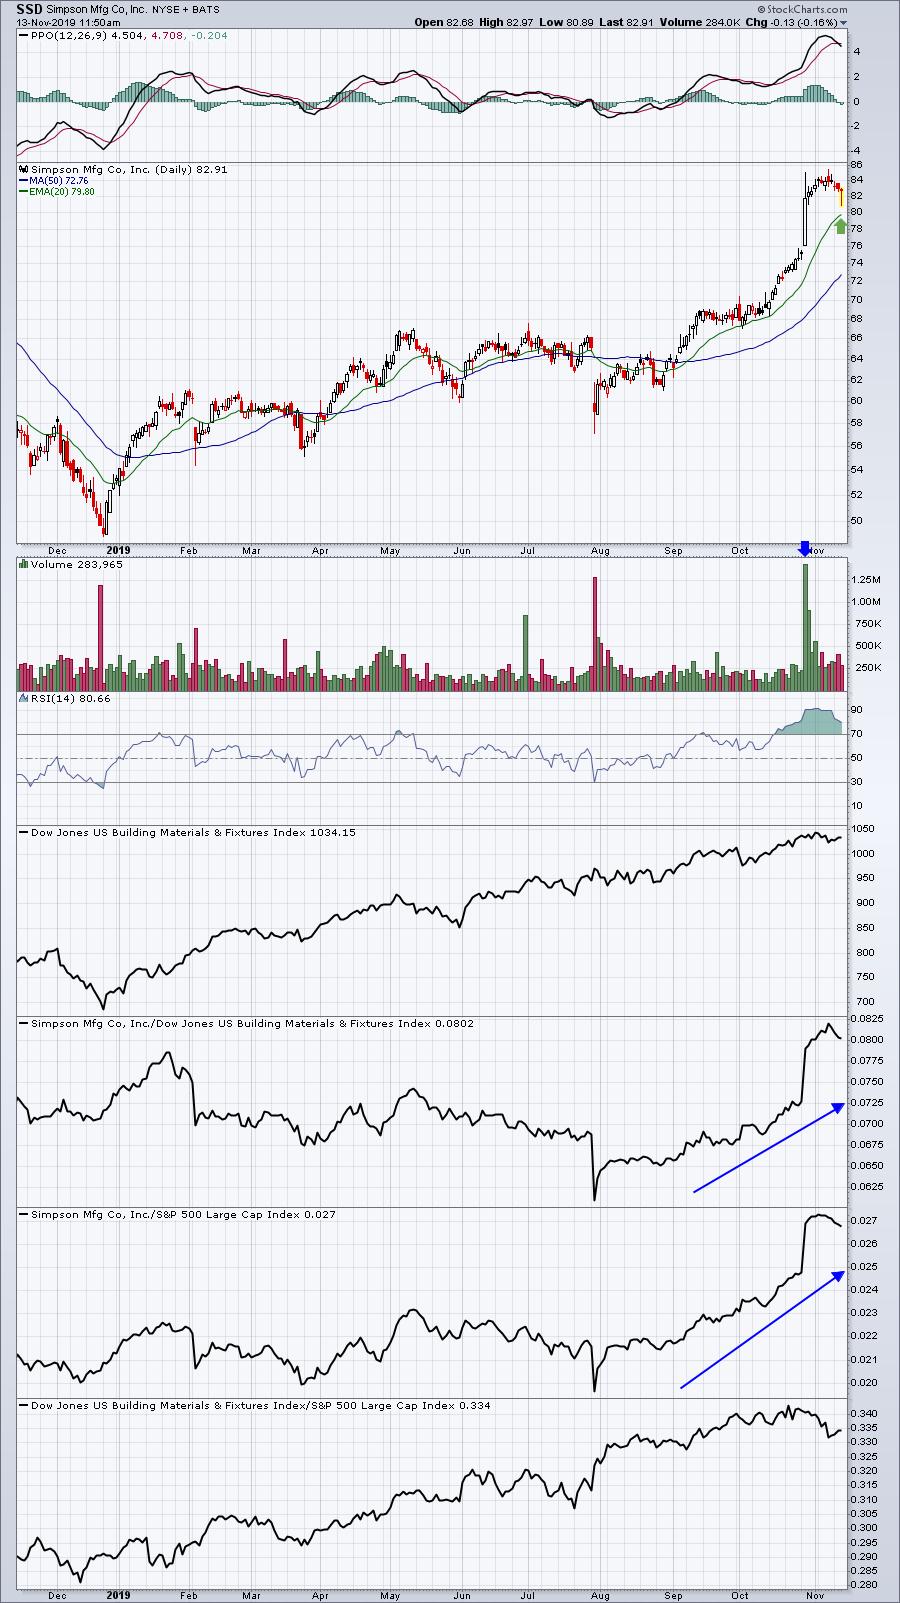
SSD was trading very strongly heading into earnings and it was one of the pre-earnings companies that I highlighted over the past couple weeks, expecting a big report. SSD got that big report and has been accumulated ever since. Today, SSD was moving down to approach its 20 day EMA, but buyers have jumped back in. Entering on pullbacks here make sense given the very strong relative strength and the apparent accumulation.
Active Trade Alerts
Here are comments on our two current active alerts:
ZUMZ (-0.57%) - earnings date is December 5th. ZUMZ has given up its recent gains and neared key price support at 30.00 before bouncing. Because ZUMZ reports in less than a month, we are changing our strategy here. We are eliminating our second entry at 29.50, which almost triggered a few weeks ago, and raising our stop to any CLOSE below 29.90.
ROST (-0.22%) - earnings date is November 22nd. ROST has earnings in 9 days and is bouncing today after testing its 50 day SMA. It's up more than a dollar off its earlier low. If we get a rally back toward 114, we'll likely remove ROST as we don't want to take any chances with earnings drawing so near.
Today's Movers
Let's take a look at the FAANG stocks to see which are healthy and which are not.
Facebook (FB):
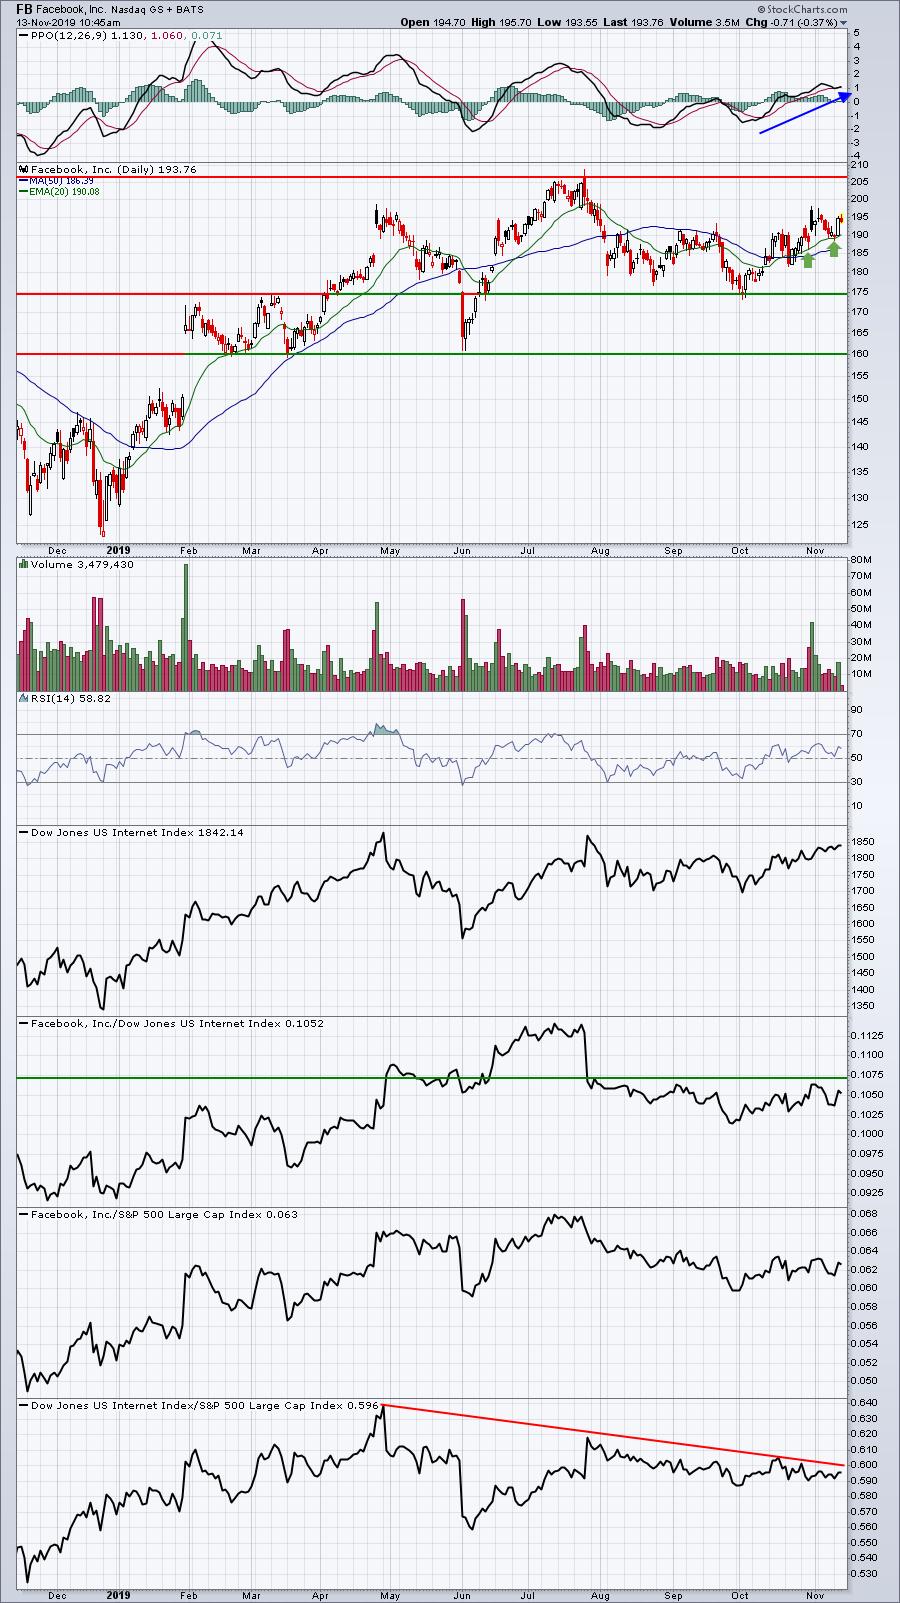
FB is middle of the pack when it comes to evaluating the FAANG stocks. It's showing some signs of improvement on its absolute chart, but it's not a leader among its internet peers ($DJUSNS) and that's problematic for me. I like FB off 20 day EMA tests, but only with a tight stop as relative strength is lacking.
Call: BUY (with a fairly tight stop)
Amazon.com (AMZN):
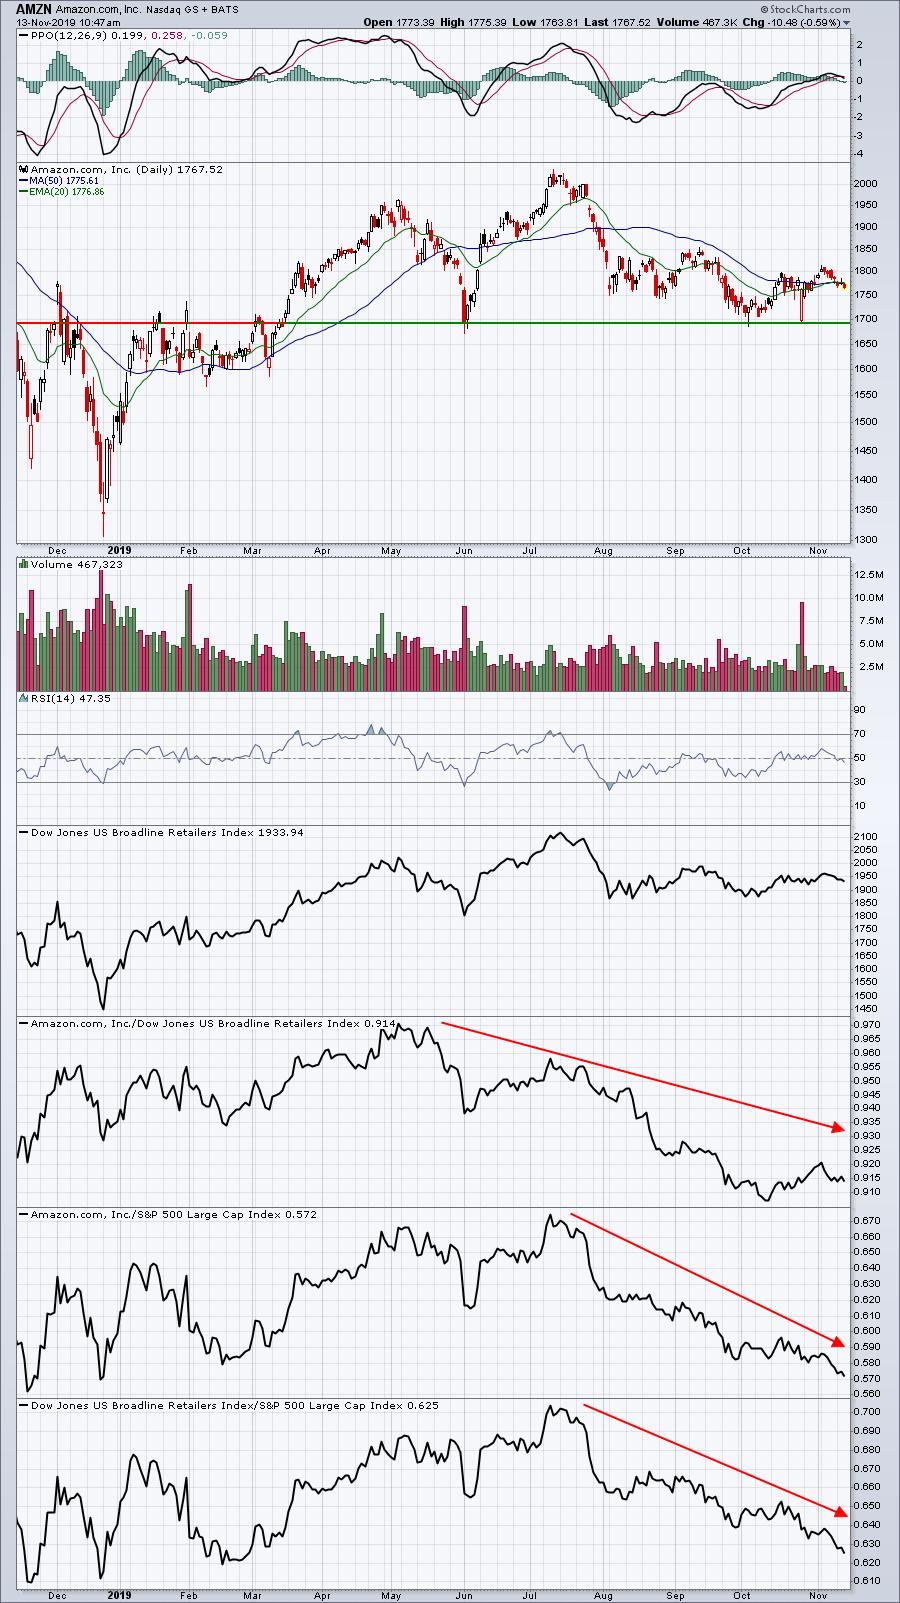
AMZN has one thing going for it - price support just beneath 1700. That's it. The absolute chart is trending lower in a market where we're seeing all-time highs. Its relative strength among broadline retailers ($DJUSRB) is not good and the group has been awful relative to the benchmark S&P 500.
Call: SELL
Apple (AAPL):
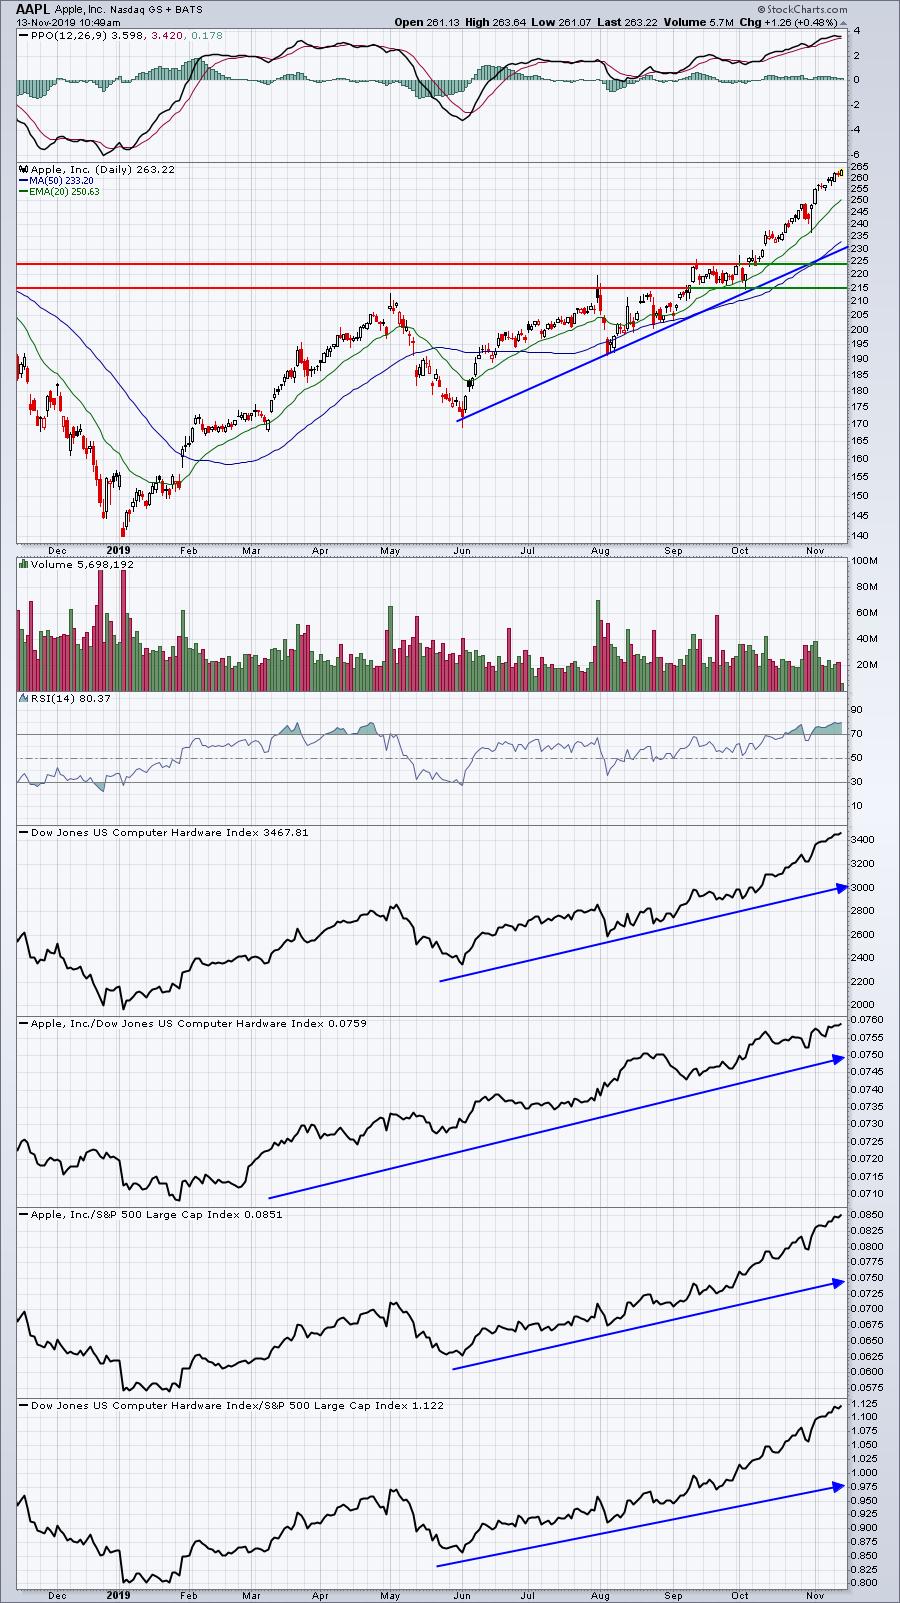
AAPL clearly is the best of the group, but it's extremely overbought and these same overbought conditions didn't end very well for the stock in May. We do have a very different market, however, as trade fears have subsided and the S&P 500 is now in a technical BUY position. I love AAPL, but it would be difficult to buy it at current prices without a pullback.
Call: STRONG BUY (on weakness)
Netflix (NFLX):
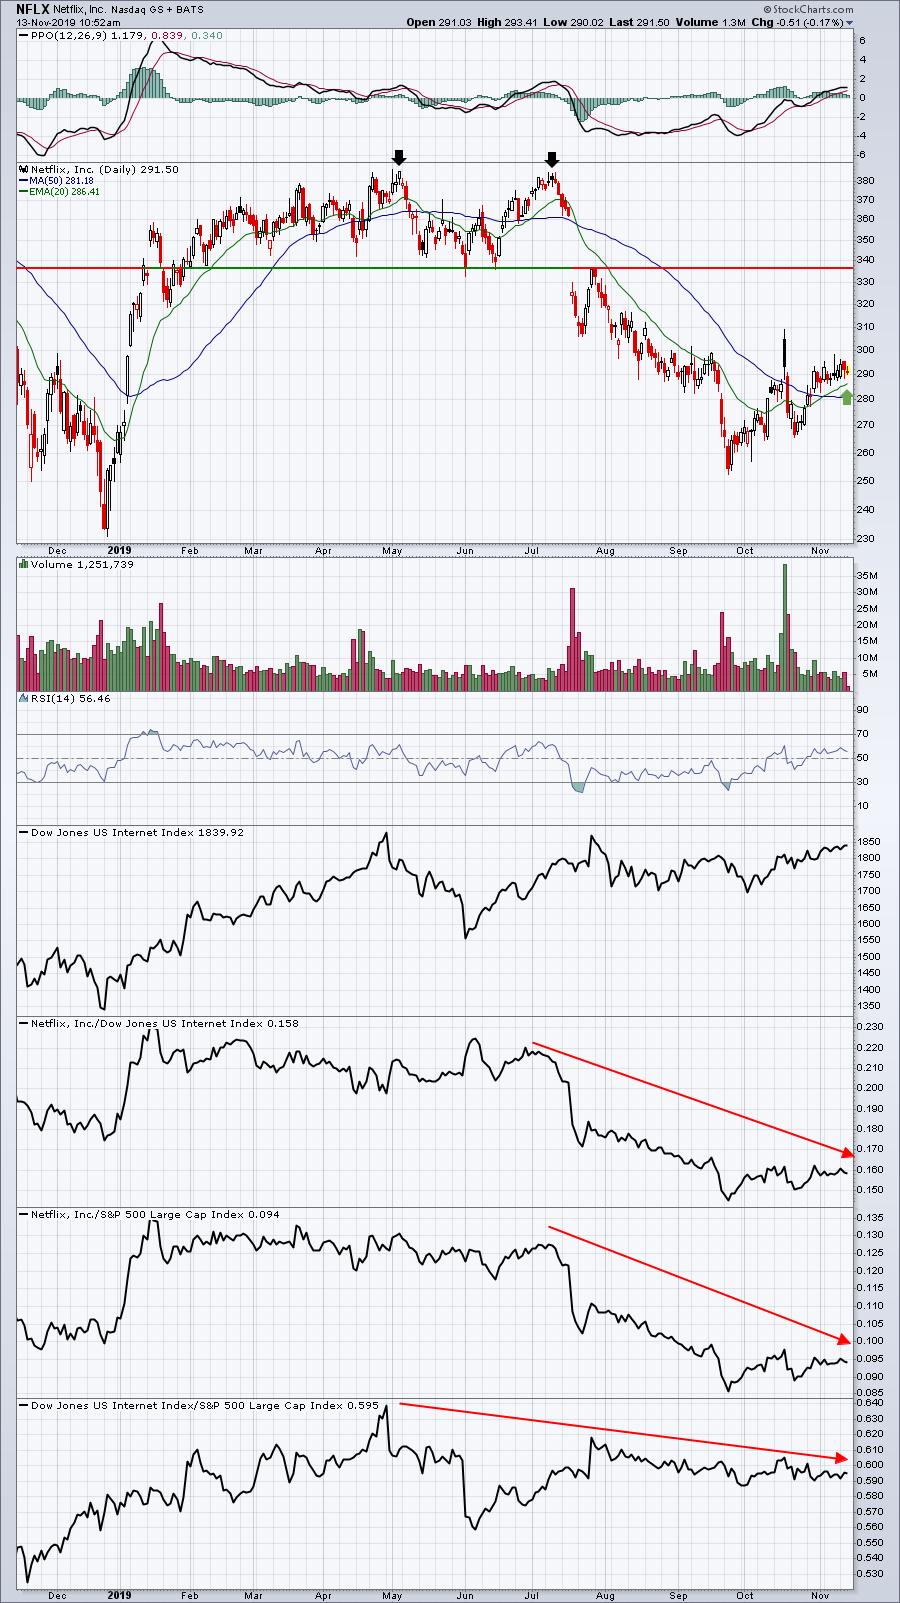
Ewwwwww. Sorry, don't like this one. Yes, NFLX is a wonderful company. But right now no one wants it and neither do I. I couldn't understand the gap higher with earnings and have somewhat been proven correct as the early morning strength after earnings served as a sellers' haven. The next few days we saw very heavy volume and filled candles (closes below opens). That reeked of distribution. I have absolutely no interest in NFLX until it (1) clears price resistance in the 300-310 area, (2) sees an increase in buying volume on that breakout, and (3) demonstrates relative strength.
Call: SELL
Alphabet (GOOGL):
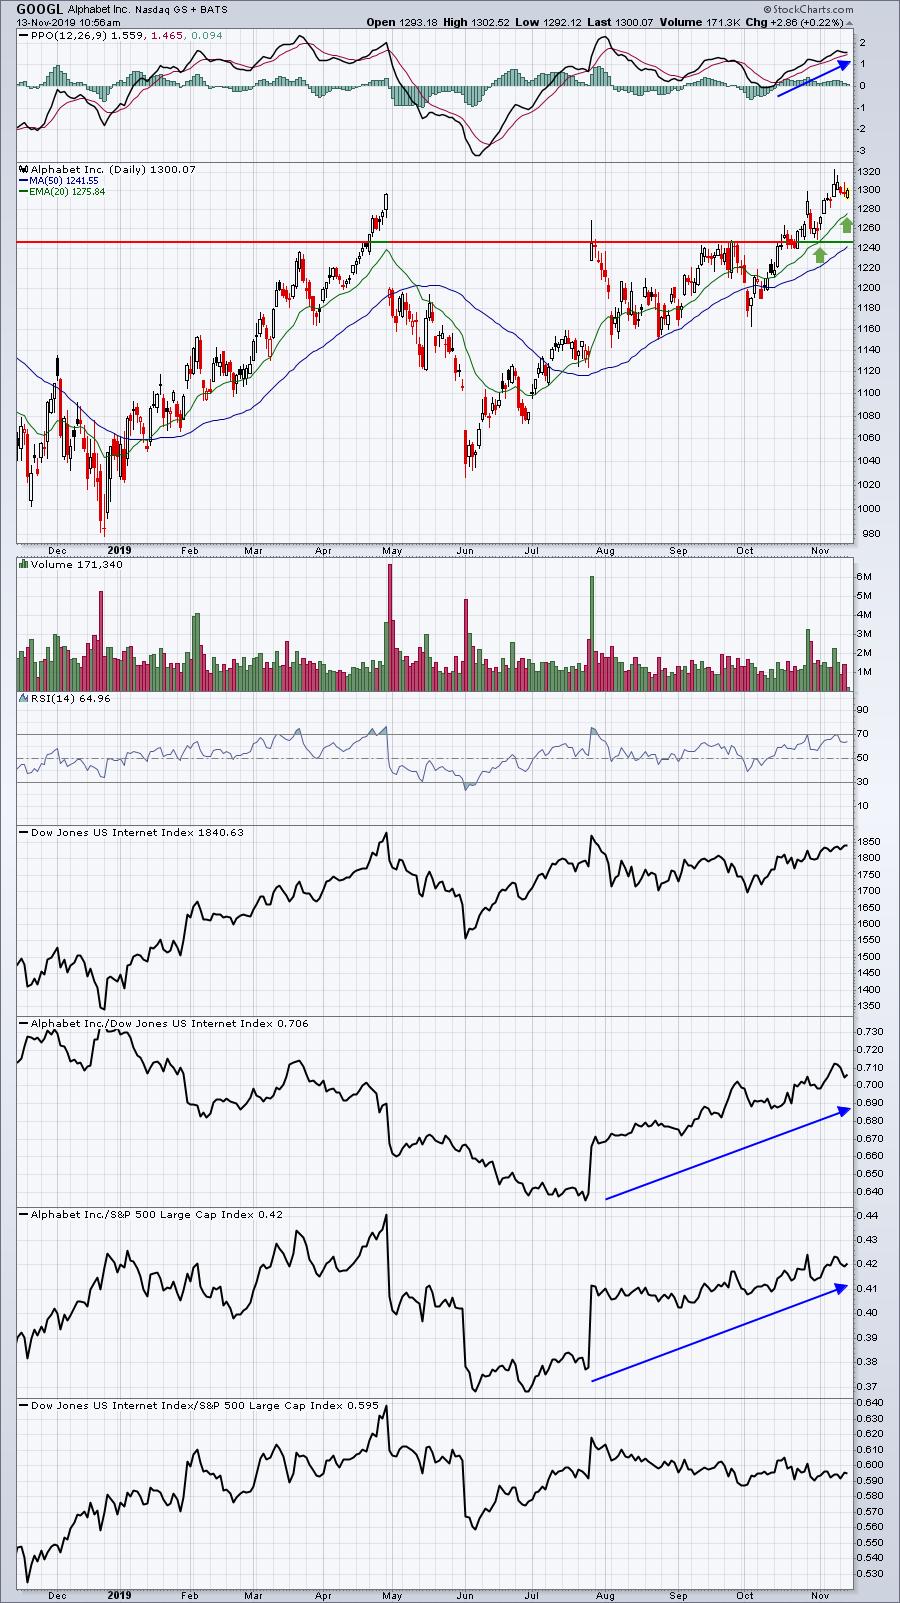
GOOGL looks very solid to me. It looked solid heading into earnings so I expected a big earnings report. Despite missing its earnings estimate by a mile, GOOGL has recovered and moved last week above 1300 for the first time in its history. Its relative strength is strong and because it just broke out, I believe it has the best short-term opportunity among the FAANG stocks.
Call: STRONG BUY
Earnings Reports
Here are the key earnings reports for this week, featuring stocks with market caps of more than $5 billion. I also include a few select companies with market caps below $5 billion. Finally, any portfolio stocks that are reporting are highlighted in BOLD. Please make sure you check for earnings dates for any companies you own or are considering owning:
Wednesday, November 13:
CSCO, TCOM, NTAP, VIPS, CAE. Others less than $5 bil: TTEK, GOOS, TSEM, SSYS
Thursday, November 14:
WMT, NVDA, AMAT, WB, WPM, NICE, VIAB, CGC, DLB, WIX, BAK, GDS. Others less than $5 bil: HP, ACB, SINA, KLIC
Friday, November 15:
JD
Economic Reports
October CPI released at 8:30am EST: +0.4% (actual) vs. +0.3% (estimate)
October Core CPI released at 8:30am EST: +0.2% (actual) vs. +0.2% (estimate)
Happy trading!
Tom
********************************
I hope you'll join me at EarningsBeats.com if you're not currently a member.
Happy trading!
Tom


