Executive Market Summary
- Futures were slightly higher this morning
- Sellers have dominated the action since the opening bell, although small caps are bucking the trend and slightly higher
- Financials (XLF) are unchanged and the relative leader today
- Energy (XLE) and healthcare (XLV) are the hardest hit sectors
- Semiconductors ($DJUSSC) and software ($DJUSSW) are two industries seeing profit taking today
- Both of our alerts are technically-sound, despite small losses on Thursday
Market Outlook
We're seeing selling for the first time since early December, which can be a bit unnerving as we don't want to lose nice profits. Whether to sell into this short-term profit taking is a personal decision, but should be somewhat dependent on your time frame and strategy. The weekly chart on the S&P 500 is extremely bullish with key support at the rising 20 week EMA, currently at 3087, or roughly 4-5% below the S&P 500's current price. The daily chart shows the rising 20 day EMA at 3185. That could be a more likely short-term target. The daily chart is bullish as well. That takes us down to the hourly chart, which looks as follows:
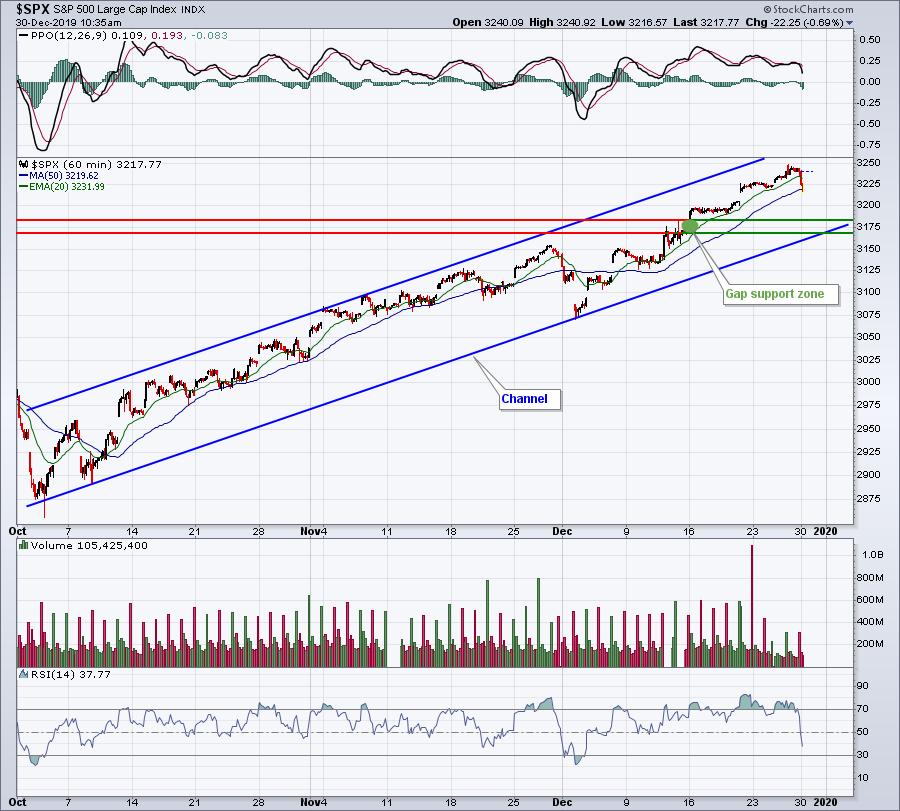
The early October low and the early December low were two critical short-term lows, so connecting those two points provides us a solid trendline to watch. If I use that same sloped line and drag it to connect highs, it provides us a channel.
Sector/Industry Focus
Financial administration ($DJUSFA) reached key overhead price resistance over the past couple weeks and has been hesitating. I see a breakout coming, but we can't assume it will happen now. The group could further consolidate, leaving frustrating trades in its path:
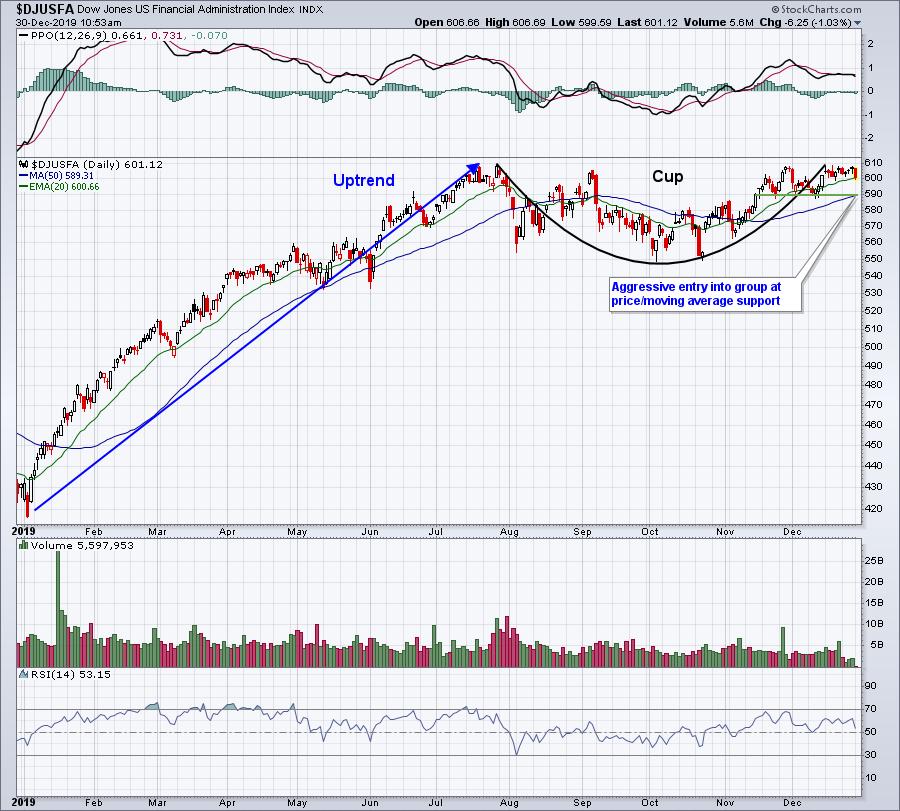
I think this pattern is extremely bullish, so taking chances on a pullback makes some sense. In the SECL section below, I've detailed a couple stocks in this space to consider.
Active Trade Alerts
We have two active trade alerts currently:
TPX (-1.32%) - reports earnings on February 12. TPX is currently trading just above its rising 20 day EMA, which is at 87.05. It was trading beneath its 20 day EMA earlier and, remember, we've changed our exit/stop strategies on TPX. Any close below its 20 day EMA and we'll take profits.
VC (+0.17%) - reports earnings on February 19. We remain in accumulation mode on VC. We added our second of five entries on Thursday at 87. Additional entries at 86, 85, and 84 remain open. The initial signal that weakness has ended would be a confirmed close back above the declining 20 day EMA.
Strong Earnings ChartList (SECL)
Our SECL currently has 363 annotated charts on it - these are companies that have beaten Wall Street consensus estimates as to both revenues and EPS in their latest quarterly earnings reports, are liquid (typically trade at least 200,000 shares daily on average), and look solid technically. If you're both an EarningsBeats.com member and also a StockCharts Extra member (or above), and you've sent us your User ID at StockCharts, we'll send you this ChartList as part of our EarningsBeats.com service, and you can download it directly into your SC account. If for some reason, you haven't received a copy, be sure to write us at "support@earningsbeats.com", provide us that User ID, and we'll make sure you receive a copy.
If you're not currently an EarningsBeats.com member, but would like to try us for 30 days, there's only a $7 charge for your first 30 days. CLICK HERE to sign up and start your trial today! For a limited time, there's even better news. We'll refund the $7!!! So try out our entire service for free for 30 days! That will include receiving all 40 stocks in our 4 portfolios - Model, Aggressive, Income, and Value.
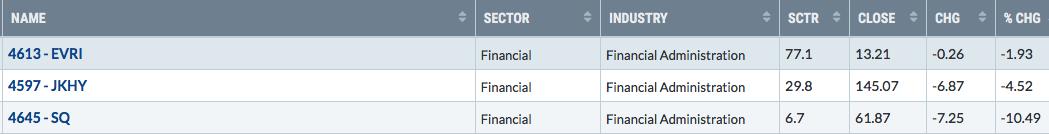
I mentioned earlier that financial administration stocks ($DJUSFA) are in a bullish pattern and that a pullback could represent an opportunity for entry. Here are the three financial administration stocks on our SECL and how they've performed over the past month while the group has consolidated:
EVRI:
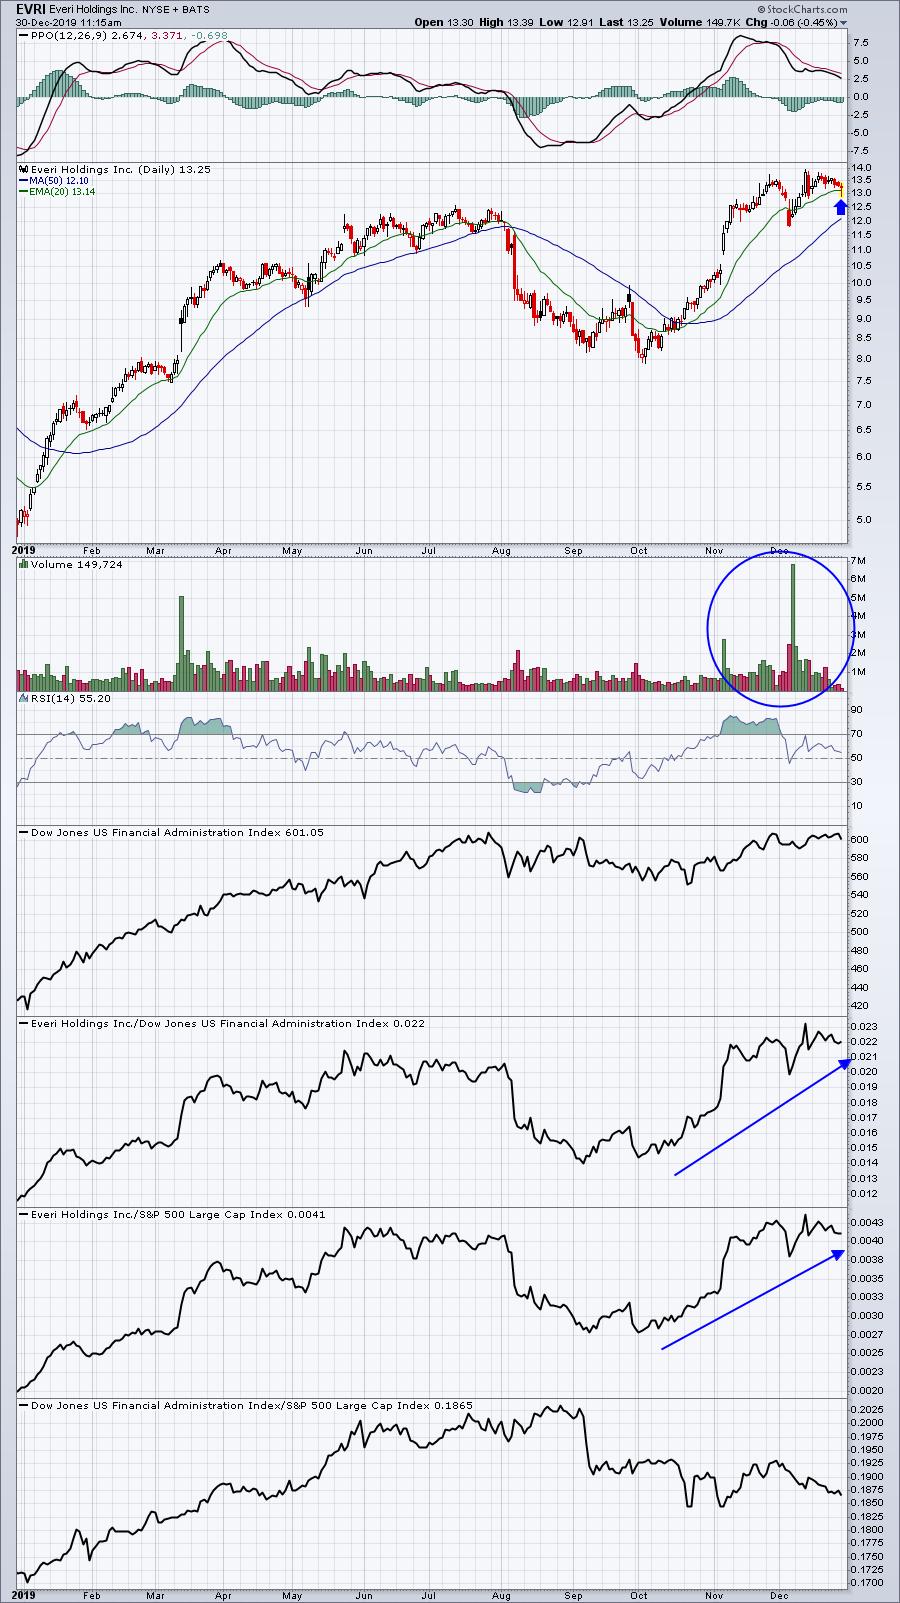
This chart is strong and today's action (reversal at 20 day EMA) suggests we could already be seeing a bottom. Failure to hold the 20 day EMA would provide an opportunity to enter potentially from 12.00-12.50. Relative strength is excellent here, though, so look to EVRI if the overall group breaks out.
JKHY:
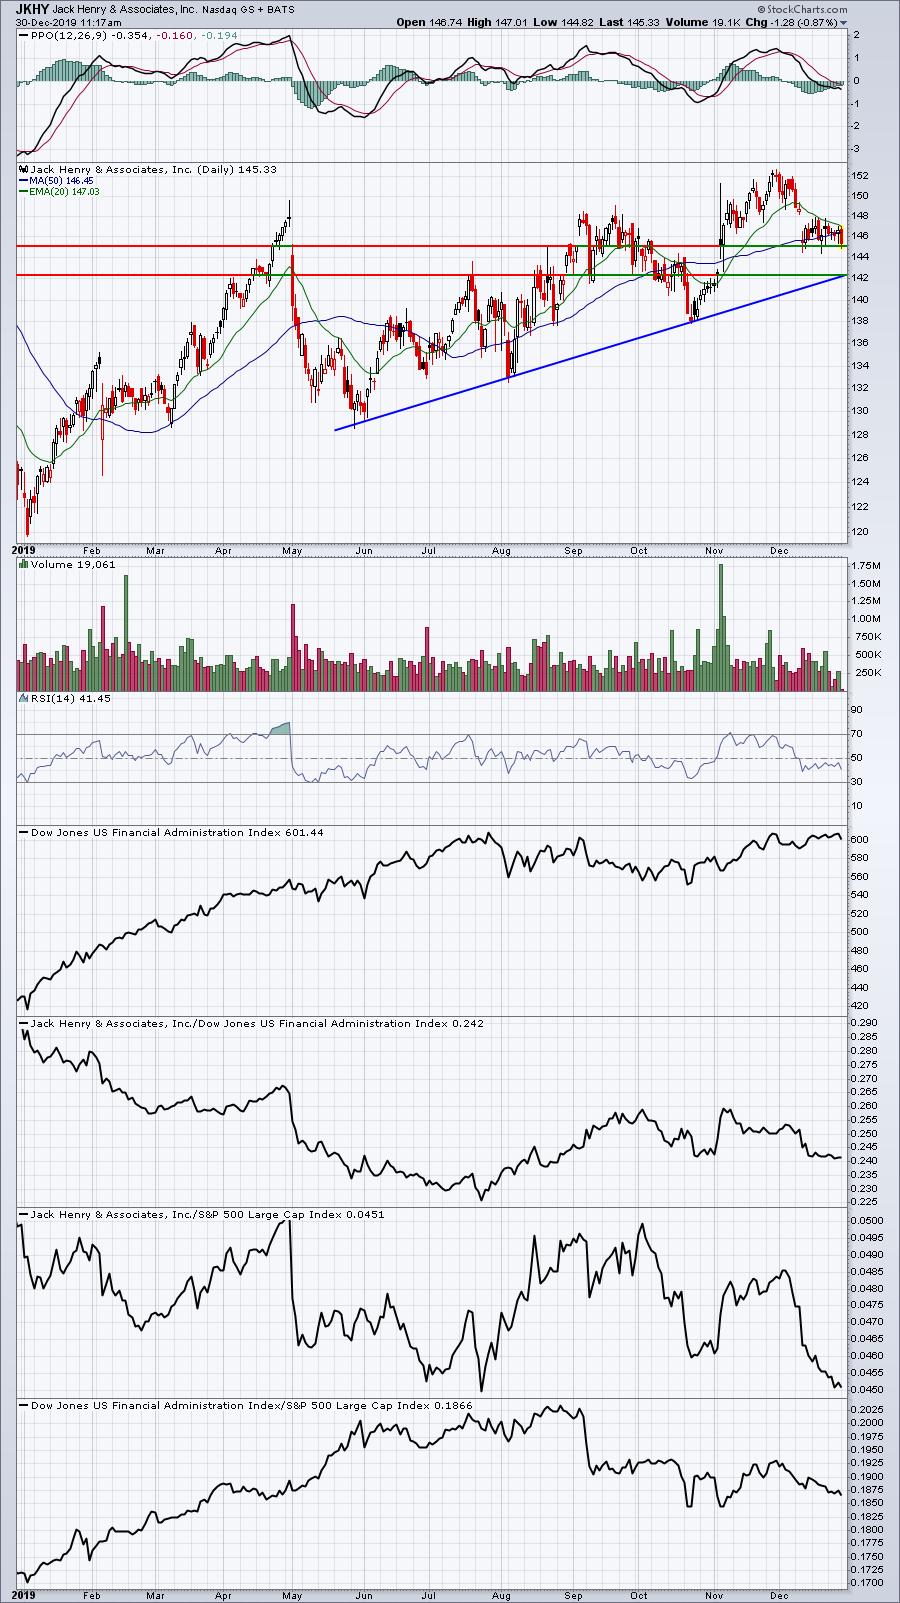
JKHY doesn't look nearly as bad as its SCTR score of 29. I believe it's consolidating after the gap higher in early November. Trendline and gap support coincide near 142. On further weakness, that's your best reward to risk entry point.
SQ:
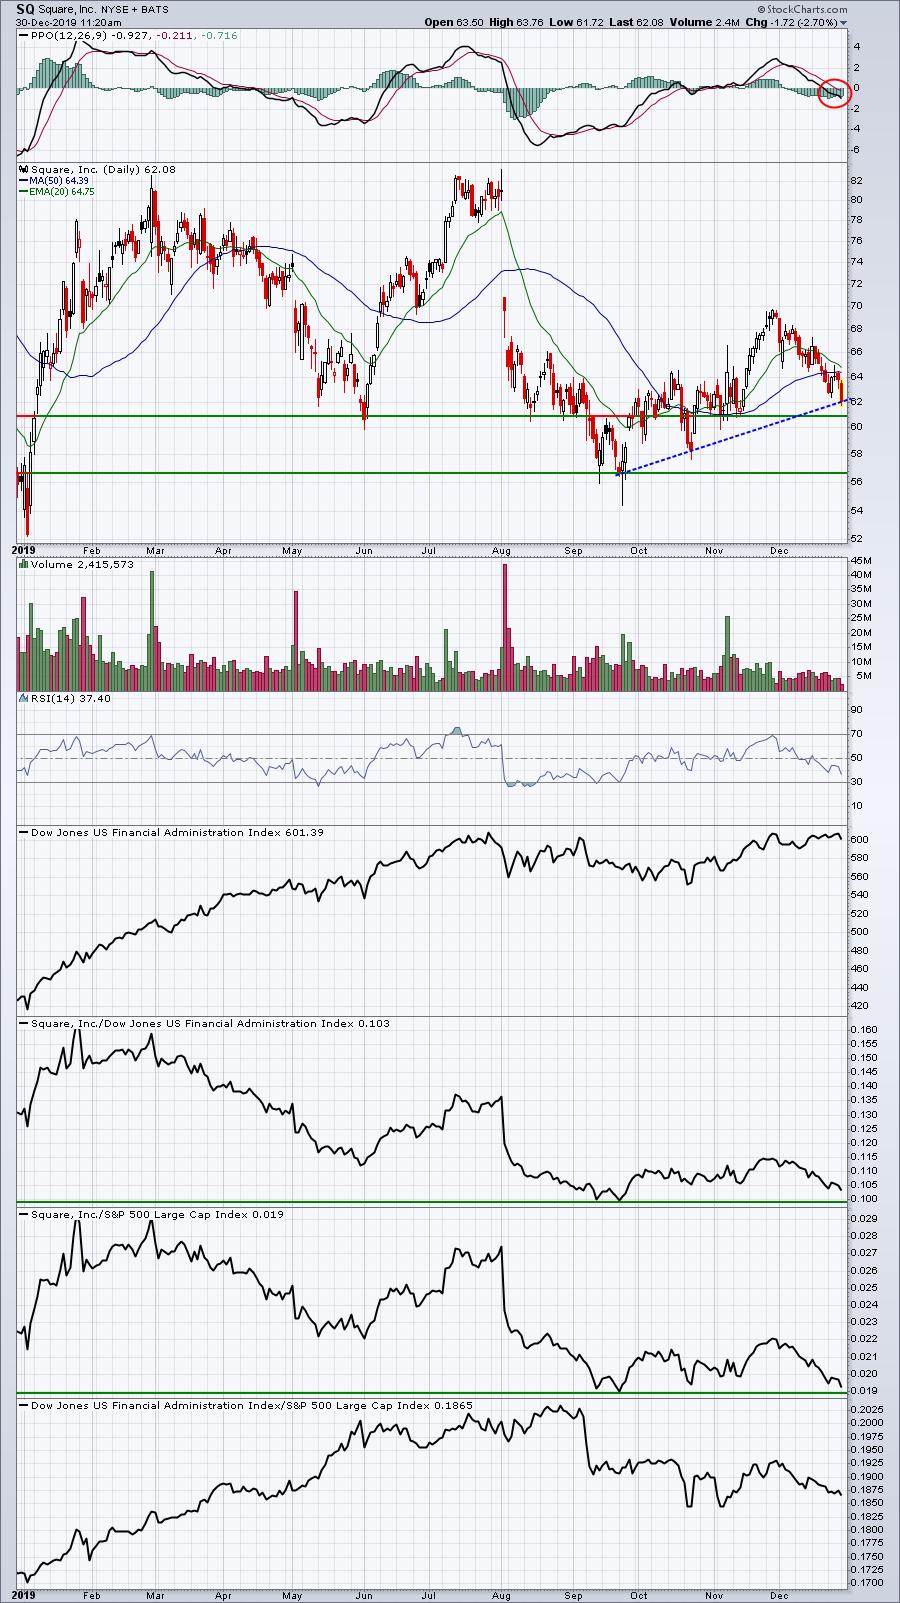
Technically, SQ is the hardest stock to support from a long perspective. If I trade a stock that's relatively weak, I always make sure I keep a tight stop. In other words, I'll make a bullish argument, but if that argument is violated, I want to get out quick. Here's my bullish argument for SQ:
The volume trends in November were bullish and the selling in December has been on lighter volume. The price appreciation began from 61.00 and the trendline coincides with 62.00, so that 61.00-62.00 needs to hold short-term.
Movers & Shakers
I reviewed the top SCTR movers on StockCharts.com and here were a few I found interesting technically:
PBF:
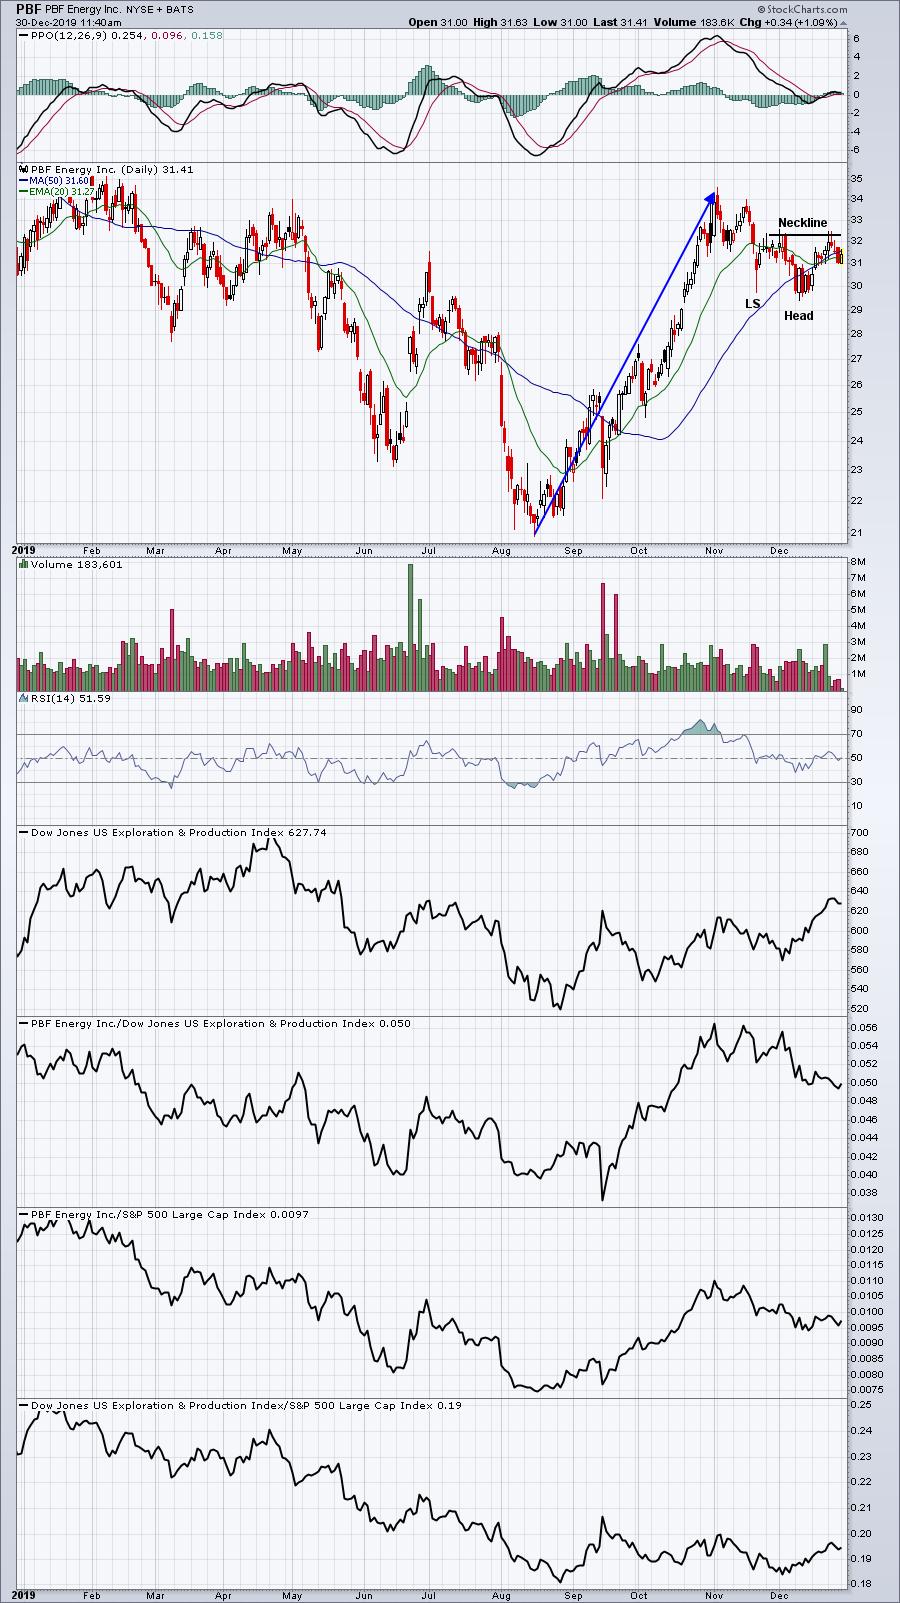
This is a nice bullish inverse head & shoulders continuation pattern. A breakout above 32.25 would initially measure to 35.00.
FIVE:
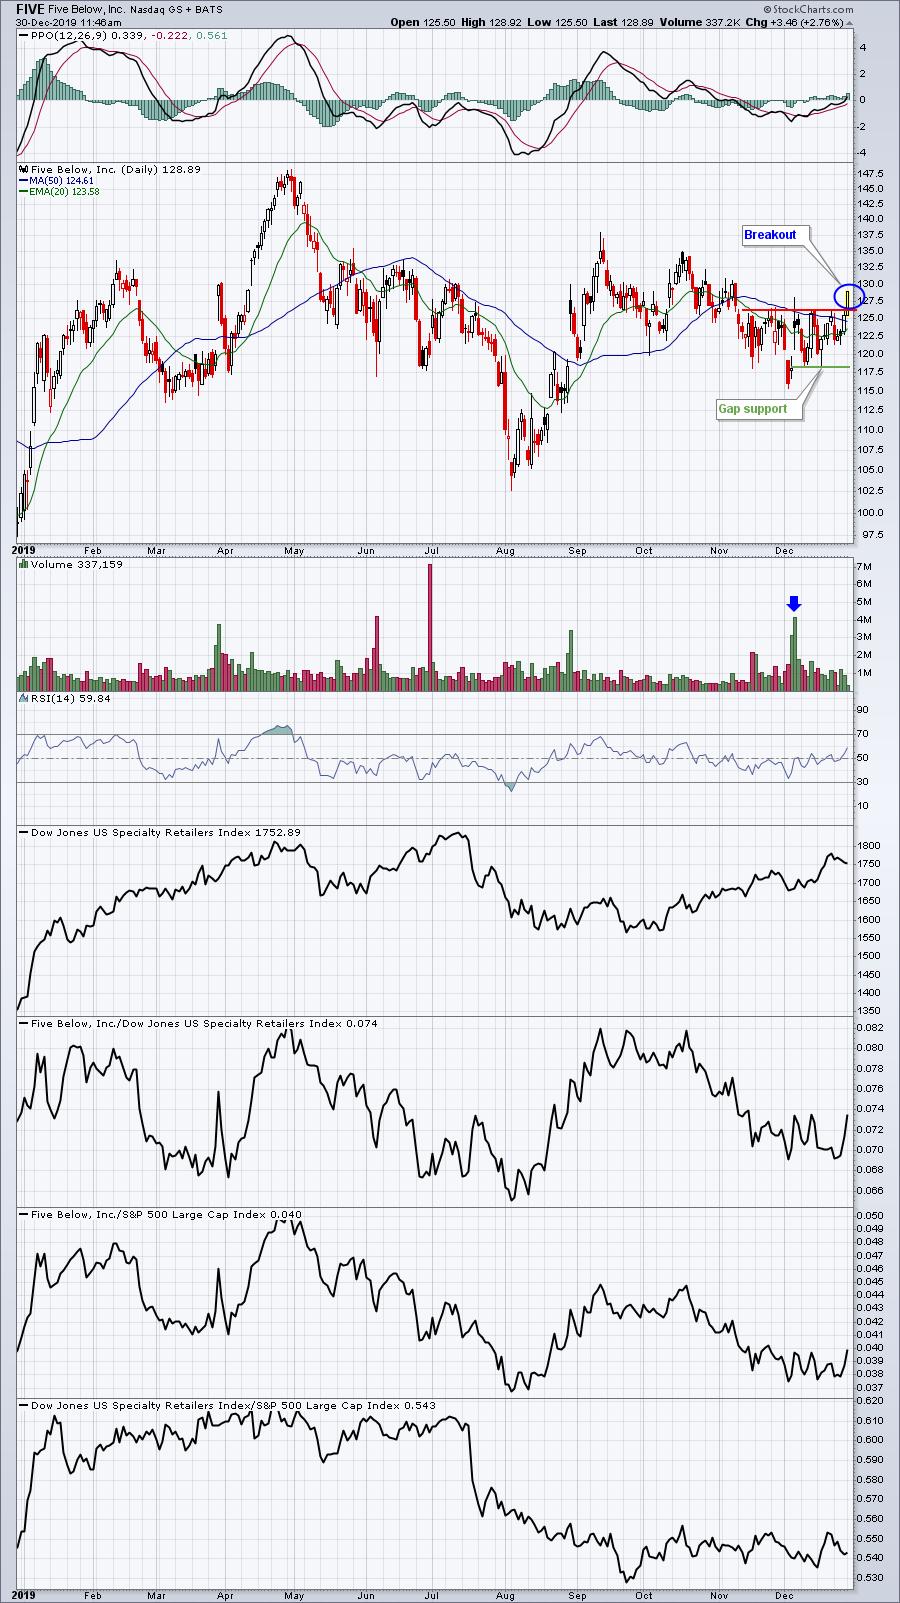
FIVE gapped up nicely, filled its gap (green support line), and now is breaking out to the upside. I'd expect a run to 135-137.
LTM:
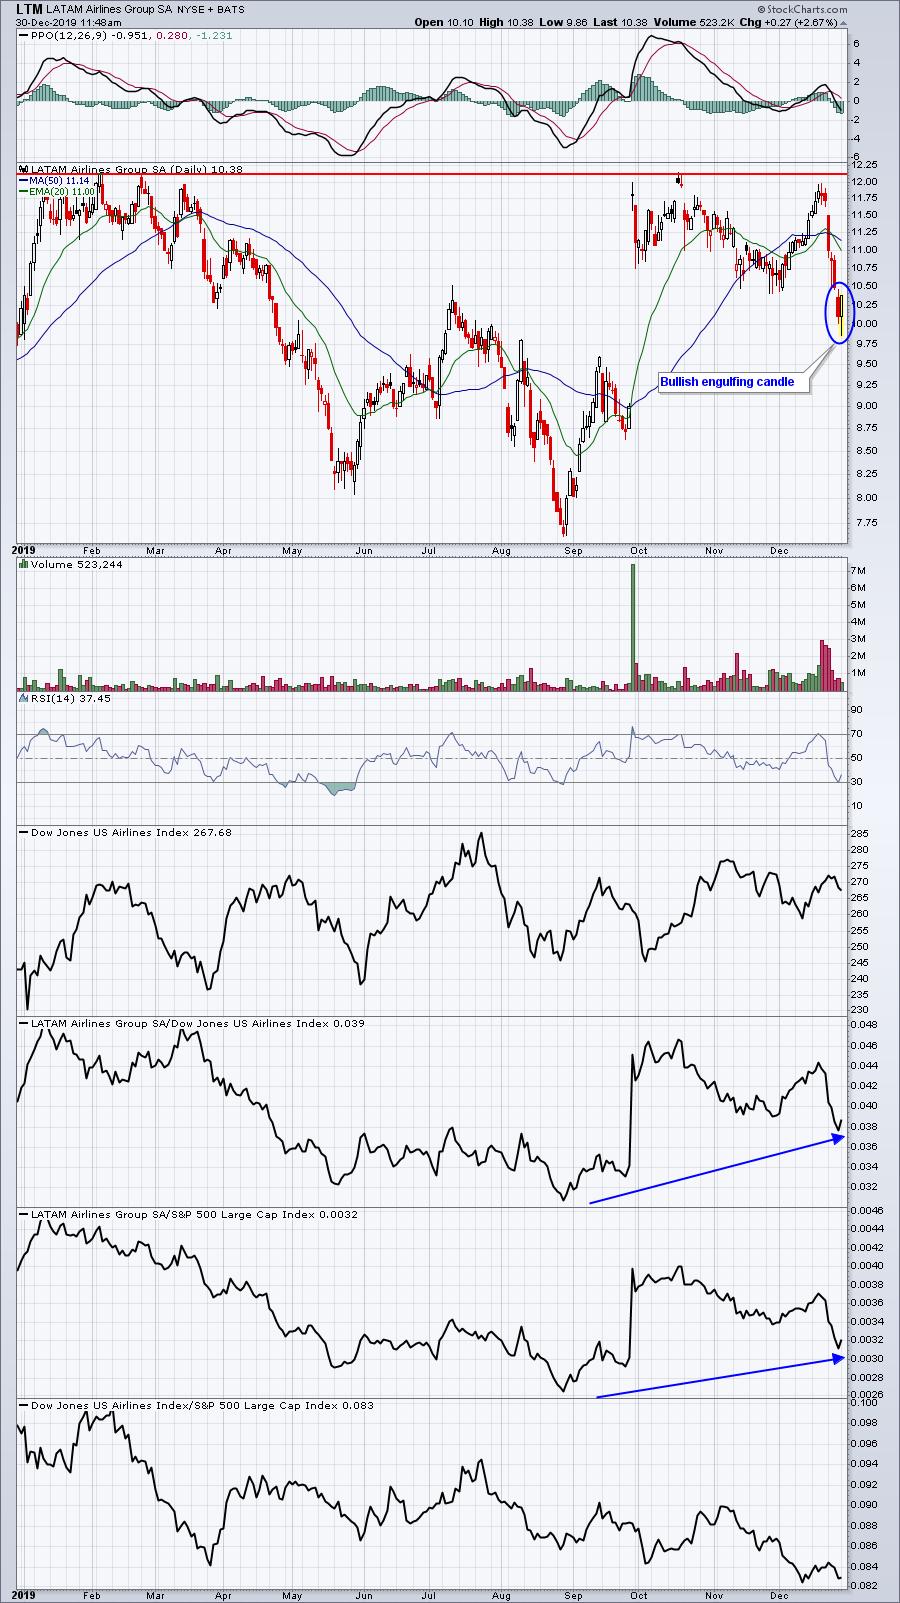
LTM is extremely volatile, but the recent selling may have ended. LTM fell into its gap support zone and appears to be reversing today. I wouldn't be surprised to see a return to 12.00-12.25 price resistance.
Earnings Reports
Here are the key earnings reports for this week, featuring stocks with market caps of more than $5 billion. I also include a few select companies with market caps below $5 billion. Finally, any portfolio stocks (or active trade alerts) that will be reporting results are highlighted in BOLD. Please make sure you check for earnings dates for any companies you own or are considering owning:
Monday, December 30:
None
Tuesday, December 31:
None
Wednesday, January 1:
None
Thursday, January 2:
None
Friday, January 3:
LW
Economic Reports
December Chicago PMI: 48.9 (actual) vs. 47.9 (estimate)
November pending home sales: +1.2% (actual) vs. +1.1% (estimate)
Happy trading!
Tom


