Note
During the holidays, I'll be publishing my EarningsBeats.com Daily Market Report here in my Trading Places blog. I hope you enjoy it.
Happy holidays!
Executive Market Summary
- We're seeing another solid day as seasonal strength really begins to kick in
- The Dow Jones is up just over 100 points; small and mid caps lag today
- Industrials (XLI), energy (XLE), and technology (XLK) are the leading sectors
- Defensive sectors are lagging
- Apache (APA) is having a huge day (+14%) to lead the S&P 500 and the energy sector
- Boeing (BA) and Apple (AAPL) are the two leading Dow stocks; BA fired its CEO Dennis Muilenburg over the 737 MAX fiasco
- Our alert TPX is down slightly today after several days of strength
Market Outlook
The XLY:XLP ratio helps us to gauge whether a bull market move higher is sustainable. I'd be careful to look at this ratio every day, every week, or even every month, but the overall ratio should print higher highs and higher lows over the long-term to support a bull market. Here's how this ratio looks currently:
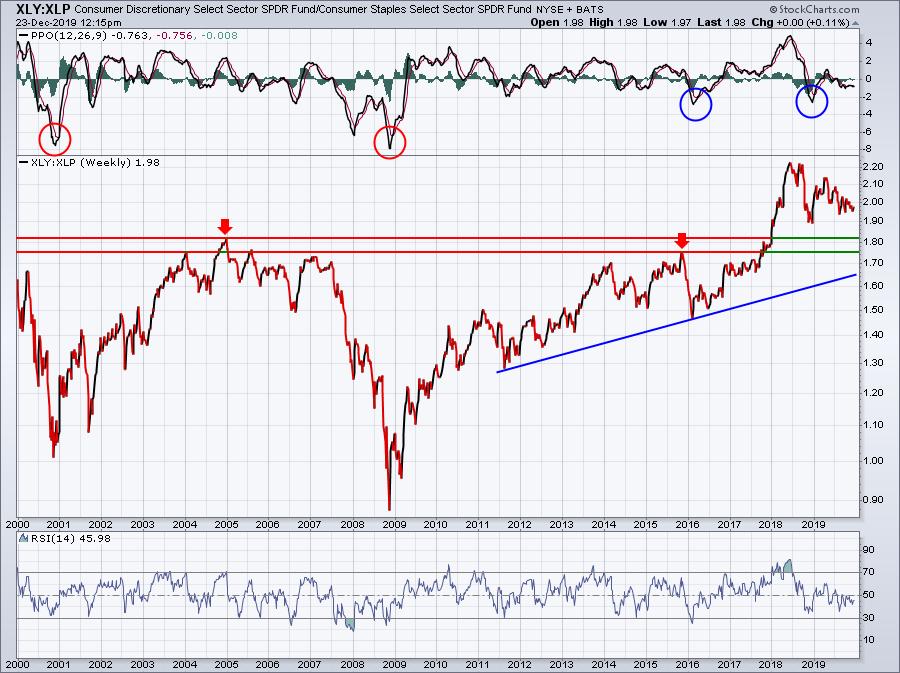
The red circles show how deeply the PPO of the XLY:XLP falls during secular bear markets. The blue circles, however, are much more indicative of the downward momentum we see during secular bull markets. Those downtrends generally don't last long and they typically occur after steep relative advances.
I've drawn a couple of relative support lines to watch on the XLY:XLP. Unless those are lost, I'd view the relationship between consumer discretionary (XLY) and consumer staples (XLP) to be quite healthy.
Sector/Industry Focus
Internet stocks ($DJUSNS) have finally broken out of their extended consolidation phase and are now firmly in an uptrend. That should allow for many successful trades within the space, including Netflix (NFLX), which has just broken out on both an absolute and relative basis. Here's the current chart of the DJUSNS:
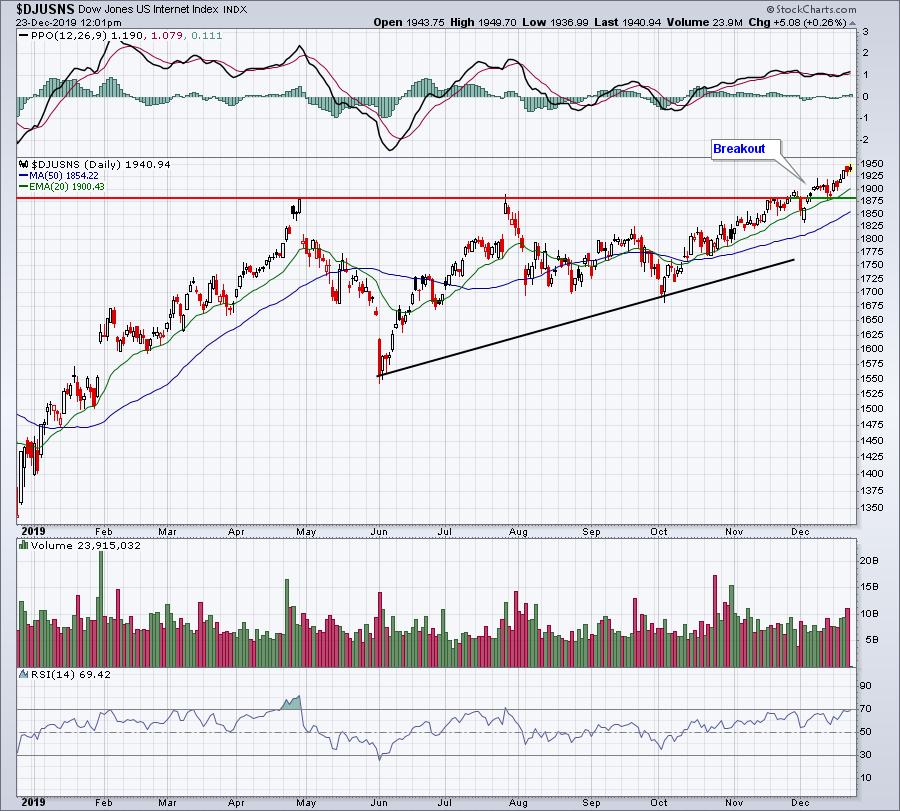
We'll see pullbacks along the way, but I'd expect to see buyers emerge on any 20 day EMA tests.
Active Trade Alerts
We have one active trade alert currently:
TPX (-0.76%) - reports earnings on February 12. TPX is down fractionally today after its recent steady march higher. Just keep in mind we have our exit strategy in place. We've already sold 25% and will sell equally at 90.00, 91.00, and 91.80 on strength. If TPX reverses lower, we've added a closing stop for the remainder of our shares at the rising 20 day EMA, currently at 86.61. We want to make sure we capture nice profits here.
Strong Earnings ChartList (SECL)
Our SECL currently has 363 annotated charts on it - these are companies that have beaten Wall Street consensus estimates as to both revenues and EPS in their latest quarterly earnings reports, are liquid (typically trade at least 200,000 shares daily on average), and look solid technically. If you're an EarningsBeats.com member and also a StockCharts Extra member (or above), and you've sent us your User ID at StockCharts, we'll send you this ChartList as part of our EarningsBeats.com service, and you can download it directly into your SC account. If for some reason, you haven't received a copy, be sure to write us at "support@earningsbeats.com", provide us that User ID, and we'll make sure you receive a copy.
If you're not currently an EarningsBeats.com member, but would like to try us for 30 days, there's only a $7 charge for your first 30 days. CLICK HERE to sign up and start your trial today!
Ok, let's move on. I ran a scan this morning of these 363 SECL companies, searching for companies that have traded at least 50% of their average daily volume as of 11:22am EST. Remember, this week tends to be extremely light volume, so if a company has already traded 50% or more of its average daily volume, it could be doing something technically that we want to be aware of. Here is the list today, sorted in SCTR order (highest to lowest):
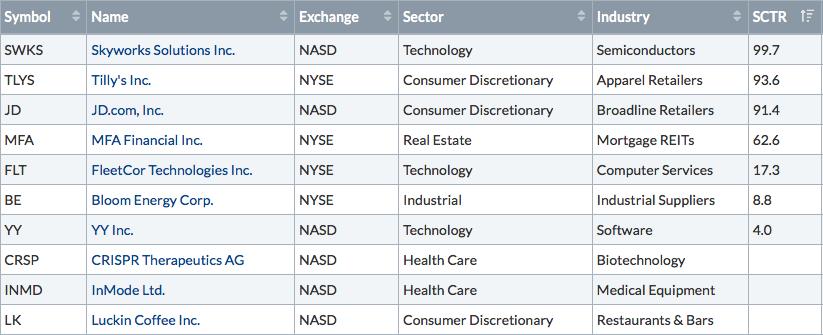
The bottom three do not have SCTR scores. Don't assume they're weak on a relative basis just because they're at the bottom of this list. After reviewing all 10 stocks, I wanted to highlight the following:
TLYS:
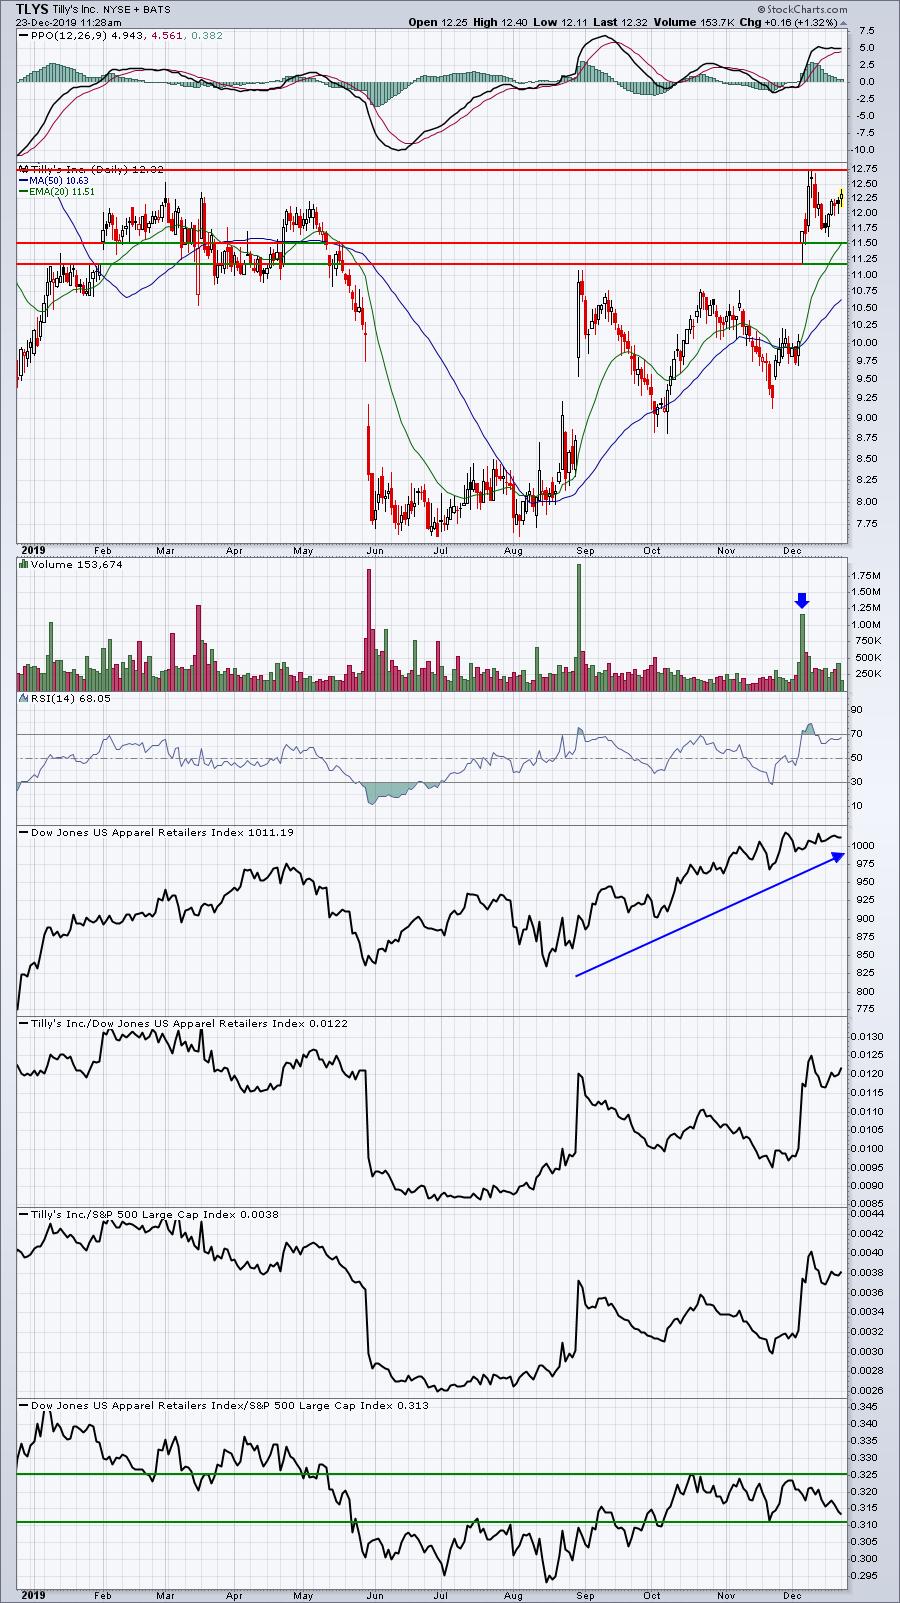
TLYS gapped up beautifully after its last earnings report and the consistent volume suggests it's being accumulated. Just keep one thing in mind. TLYS is trading right now almost exactly where it traded in 2013. Many stocks show strength for awhile, then they move right back into a downtrend. It's why I continually review quarterly earnings reports and adjust our Strong Earnings ChartList. When a stock like TLYS fails to live up to earnings expectations, it can be a very poor performer. Bottom line? Make sure you always have a stop in place to avoid getting caught up in a longer-term downtrend. For now, however, TLYS looks solid and is simply basing after its move higher. The best reward to risk entry would either be on a pullback to the two support levels reflected at 11.50 and 11.20. Also, recent price support was found at 11.75. As the 20 day EMA rises, it could also offer up short-term support at that price level. To the upside, resistance is at 12.75. A breakout on increasing volume there would likely represent its next leg higher.
INMD:
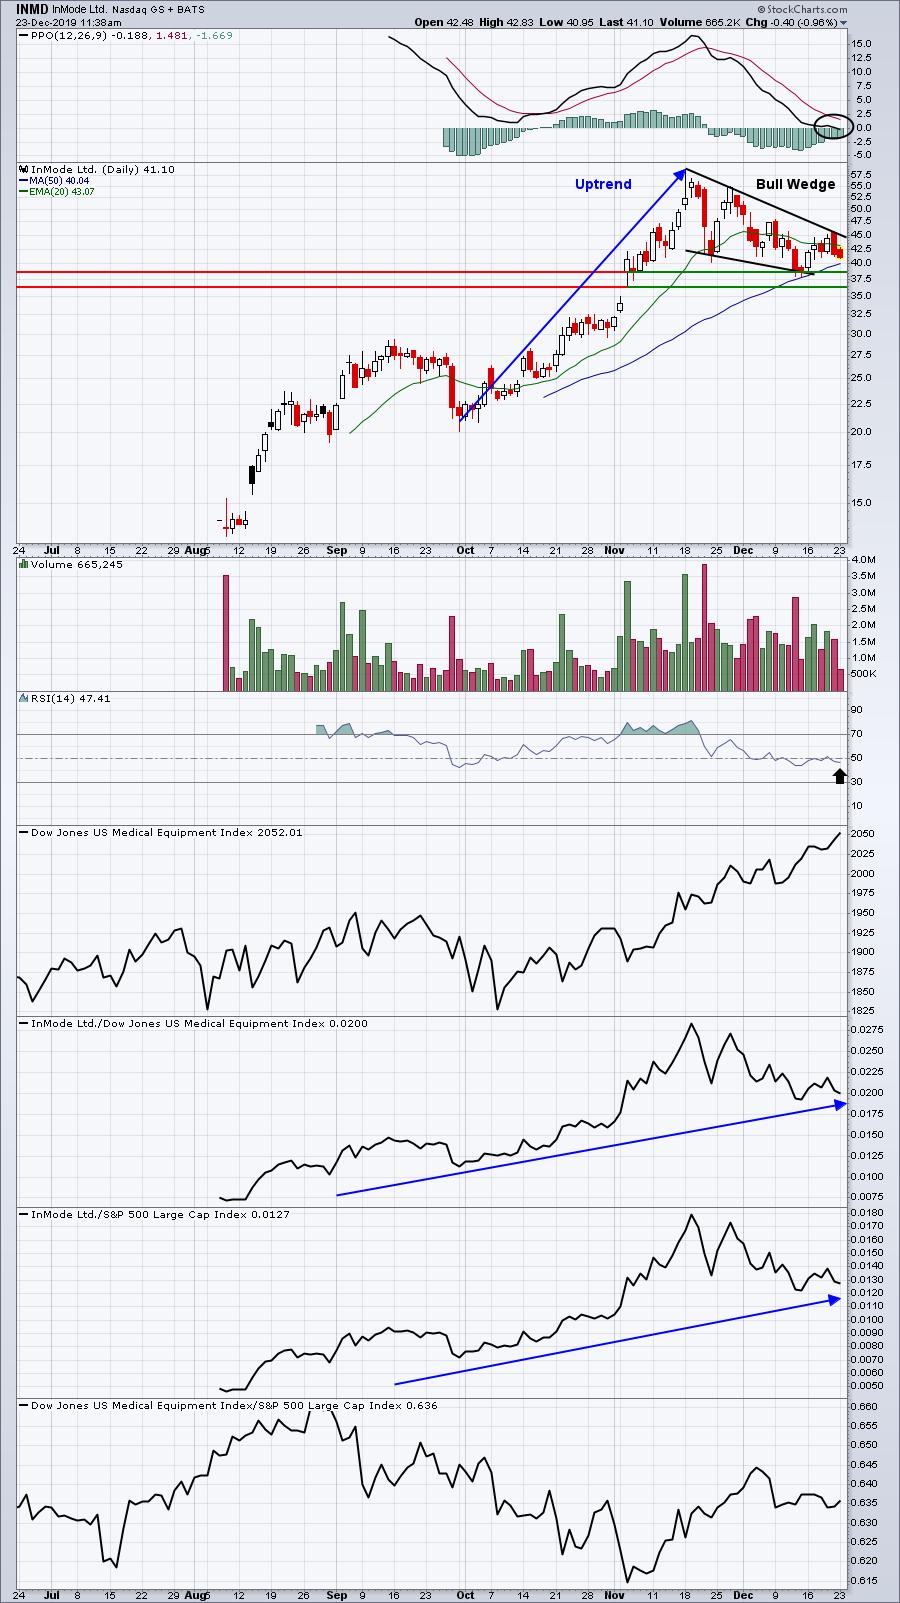
INMD has been rough on longs since mid-November, but the stock needed relief. It's currently printing a bull wedge off of an uptrend, so I'd look ultimately for this to resolve to the upside. There's no doubt we could begin to see another run into INMD's next earnings report, but let me be perfectly clear about one thing. The volatility here is extreme. DO NOT TRADE this stock if you have a weak stomach for near-term drops. I believe the accumulation zone on a stock like this is from the current price all the way down to 36.50. Even buying there is no guarantee, but I believe the reward to risk improves as it moves closer to that level. My target would be the recent high in the mid-50s. Again, you'll need some pepto bismol and a crash helmet if you plan to trade this one.
Movers & Shakers
Here are a few stocks that are making moves today that you should be aware of:
INTC:
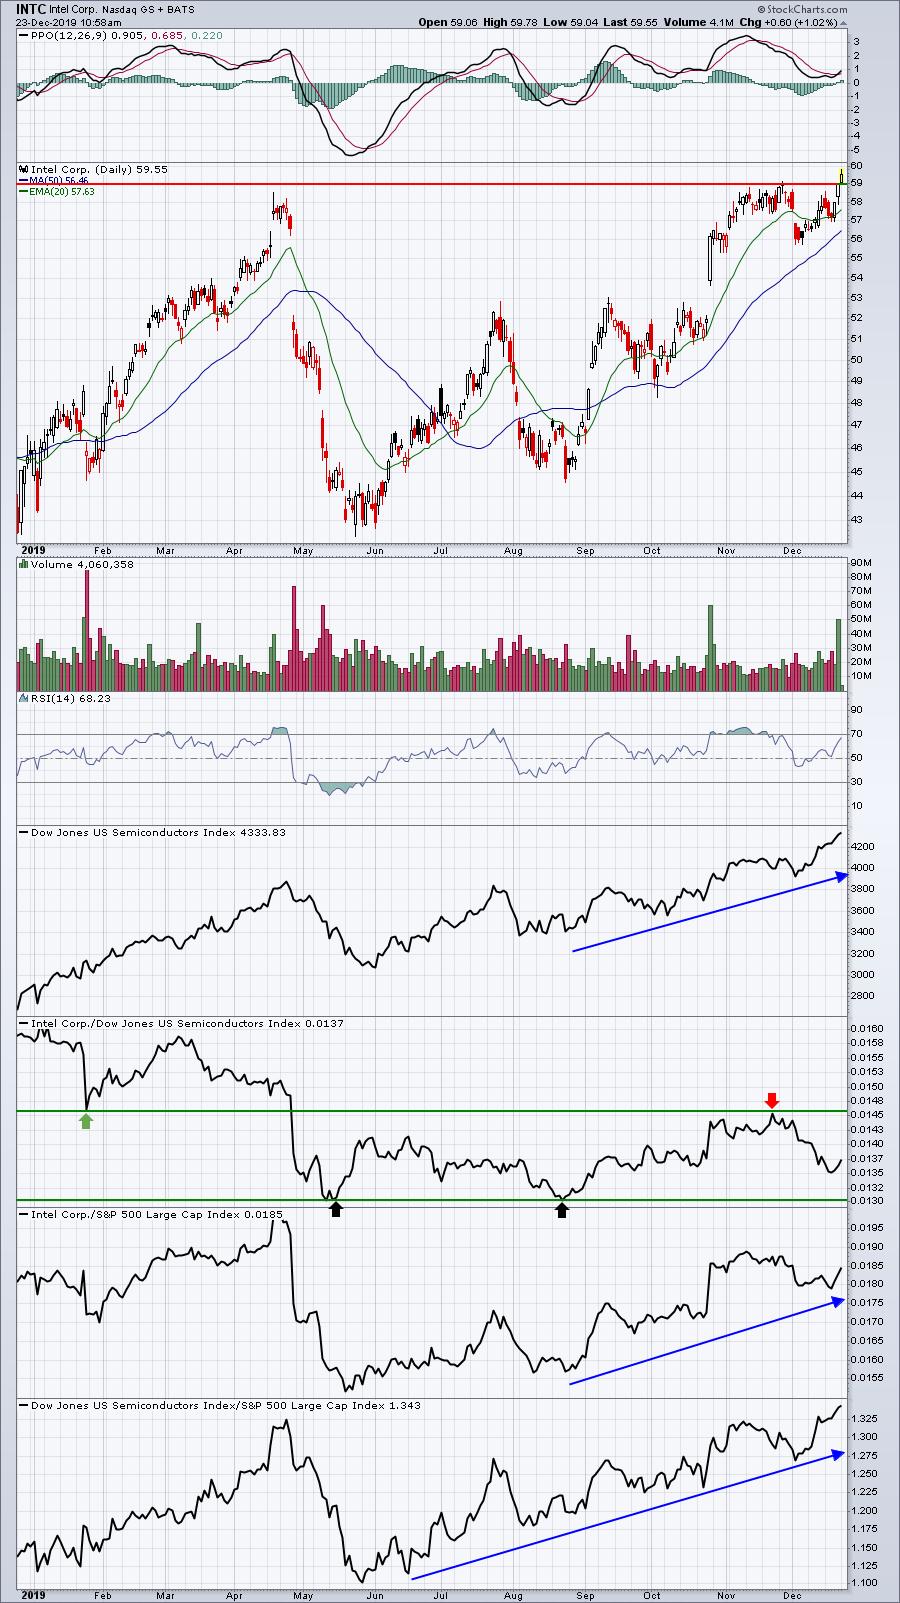
INTC is not the best semiconductor stock right now, but it is attempting a breakout and sometimes breakouts can begin a period of outperformance. Watch the INTC:DJUSSC relative strength resistance area at .0146. If INTC can clear that relative resistance level, it would become a must-own semiconductor. In the meantime, it's simply benefiting from being part of a very strong industry group.
NTAP:
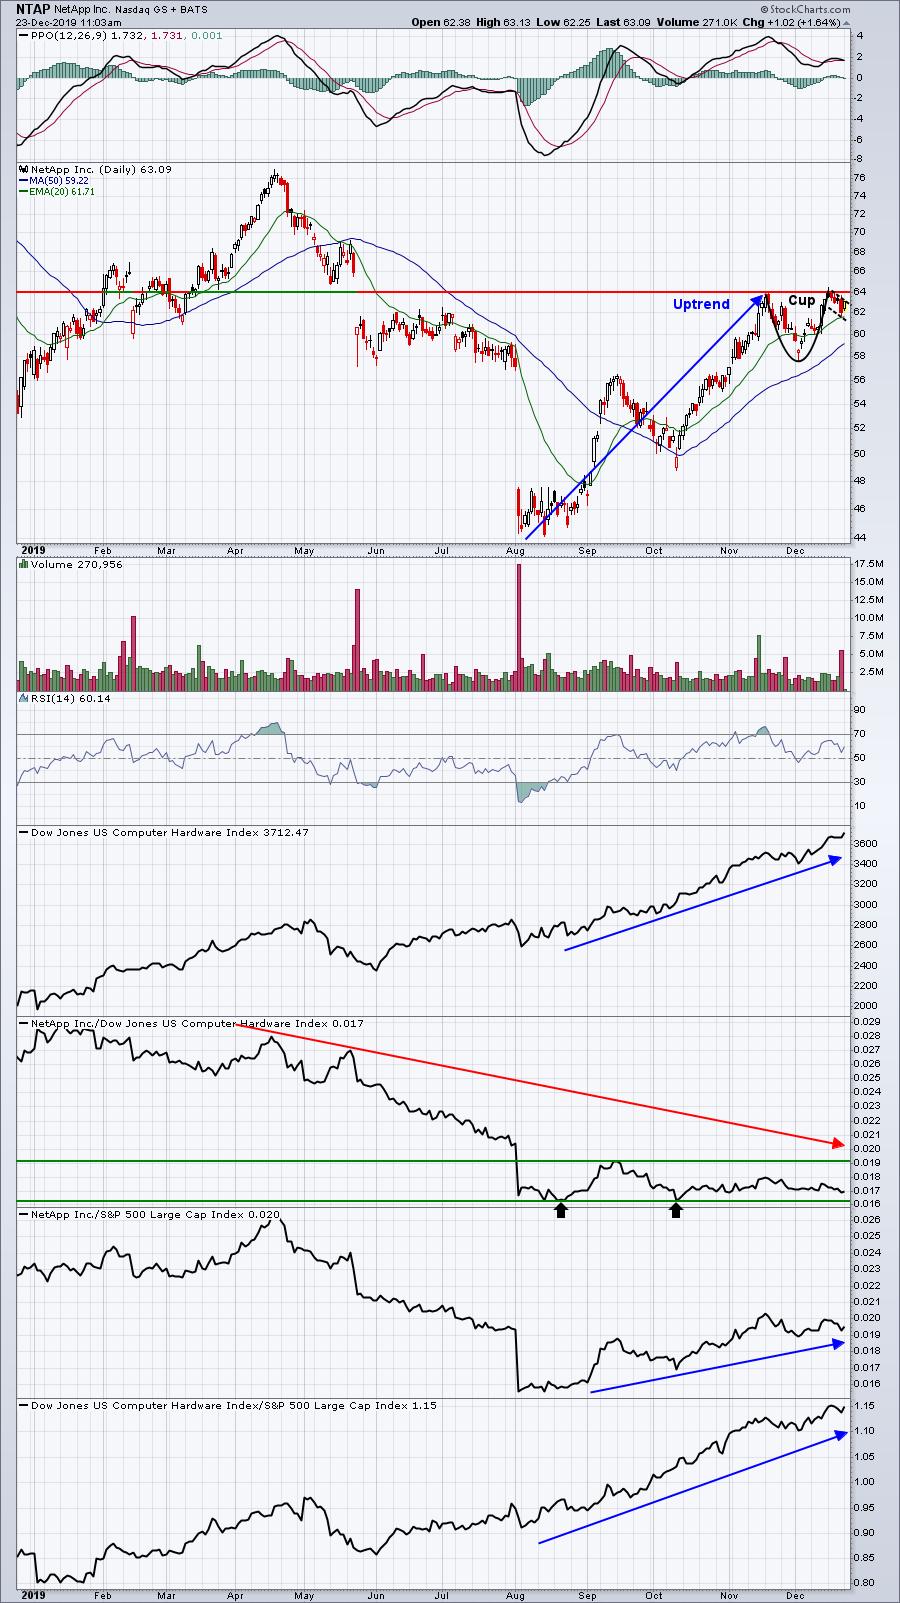
Like INTC, NTAP is moving higher, but it's doing so mostly because it's part of a very strong computer hardware group ($DJUSCR). I'd argue that the DJUSCR is THE best industry group right now. NTAP has been uptrending and is in a bullish cup with handle continuation pattern. A breakout would measure to roughly 70, but it's the relative strength that I really want to see. Also like INTC, NTAP has printed a relative double bottom (black arrows), so clearing recent relative resistance would add to the improving strength on its absolute chart.
TPR:
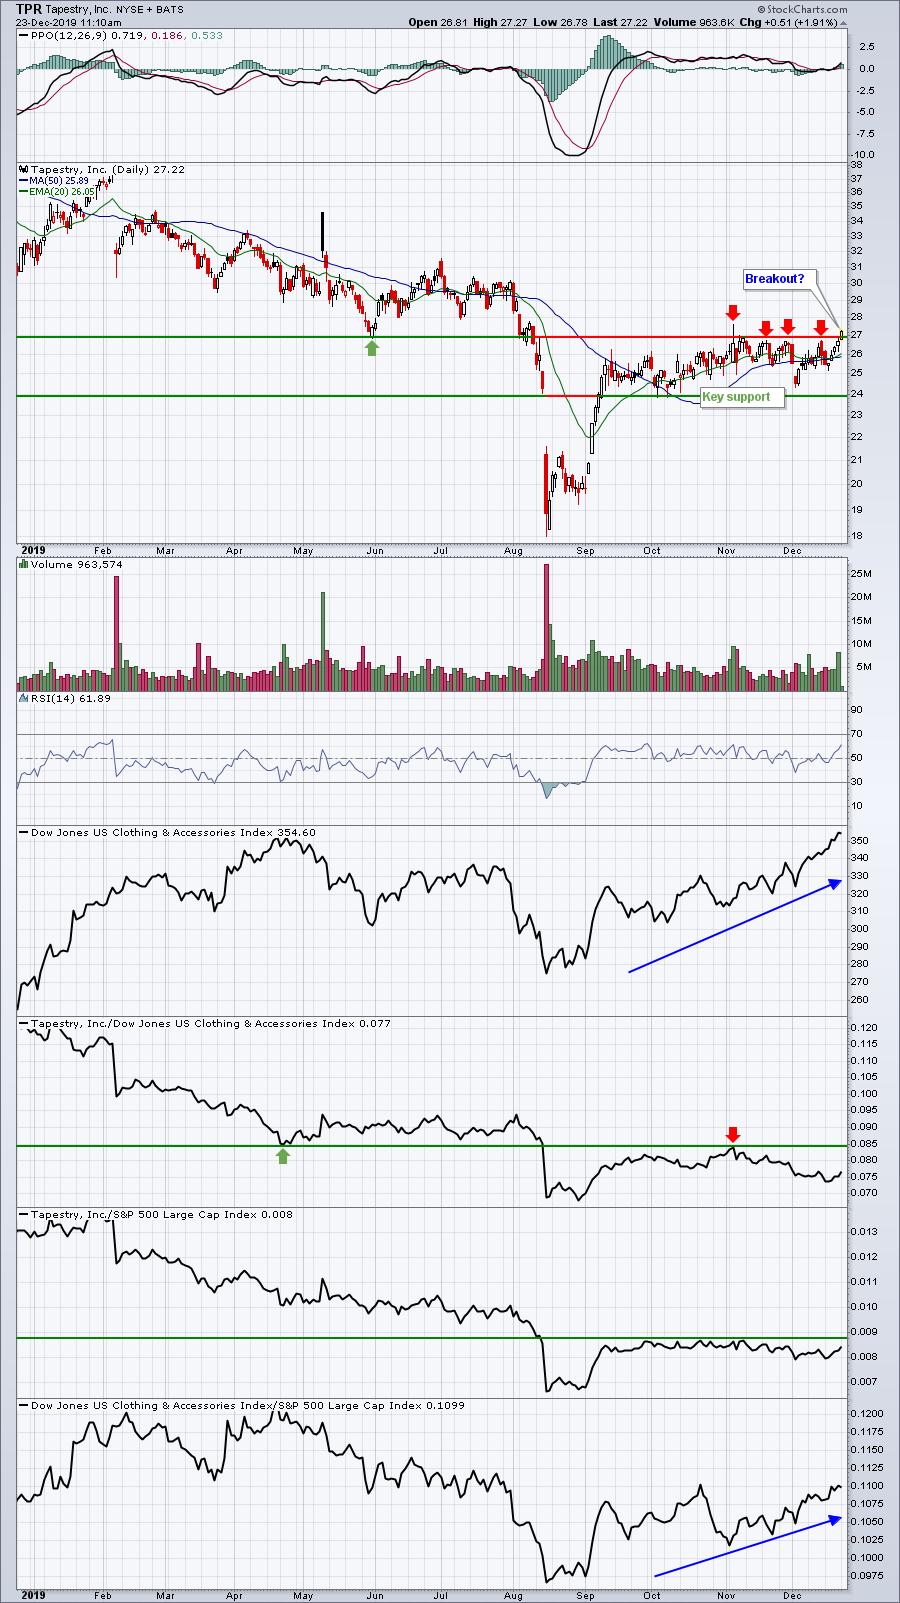
Clothing & accessories ($DJUSCF) is attempting an industry group breakout, which would add fuel to individual stocks in the group. TPR has been a laggard, but is showing the potential today for a big breakout of its own. Relative strength here has been weak, so if does break out, we want to see its relative strength accelerate too.
Earnings Reports
Here are the key earnings reports for this week, featuring stocks with market caps of more than $5 billion. I also include a few select companies with market caps below $5 billion. Finally, any portfolio stocks (or active trade alerts) that will be reporting results are highlighted in BOLD. Please make sure you check for earnings dates for any companies you own or are considering owning:
Monday, December 23:
None
Tuesday, December 24:
None
Wednesday, December 25:
None
Thursday, December 26:
None
Friday, December 27:
None
Economic Reports
November durable goods: -2.0% (actual) vs. +1.5% (estimate)
November durable goods ex-transports: +0.0% (actual) vs. +0.2% (estimate)
November new home sales: 719,000 (actual) vs. 735,000 (estimate)
Happy trading!
Tom


