Executive Market Summary
- Today is an abbreviated session with the equity market closing at 1pm EST; many global equity markets are closed today
- Wall Street opened slightly higher, but has been trading near the flat line
- There are no economic reports of significance due out today as the 10 year treasury yield ($TNX) drops two basis points to 1.92%
- Materials (XLB), real estate (XLRE), and consumer discretionary (XLY) are the leaders today; industrials (XLI) are lagging
- Our alert TPX is up slightly today after nearing a key moving average test; we added VC as a second alert this morning (see below for details)
Market Outlook
This bullishness that we've been seeing day after day is quite typical during this part of December. As I've posted before, the Russell 2000 ($RUT) has produced annualized returns as follows throughout December (since 1987):
December 1-15: -8.61%
December 16-31: +67.60%
It's quite typical to see this slow, methodical push to the upside throughout the holidays and it's what I'm expecting to see continue right through year end.
Sector/Industry Focus
Higher crude oil prices ($WTIC) have helped energy stocks (XLE) over recent weeks, but we're still not seeing relative strength from the oil patch:
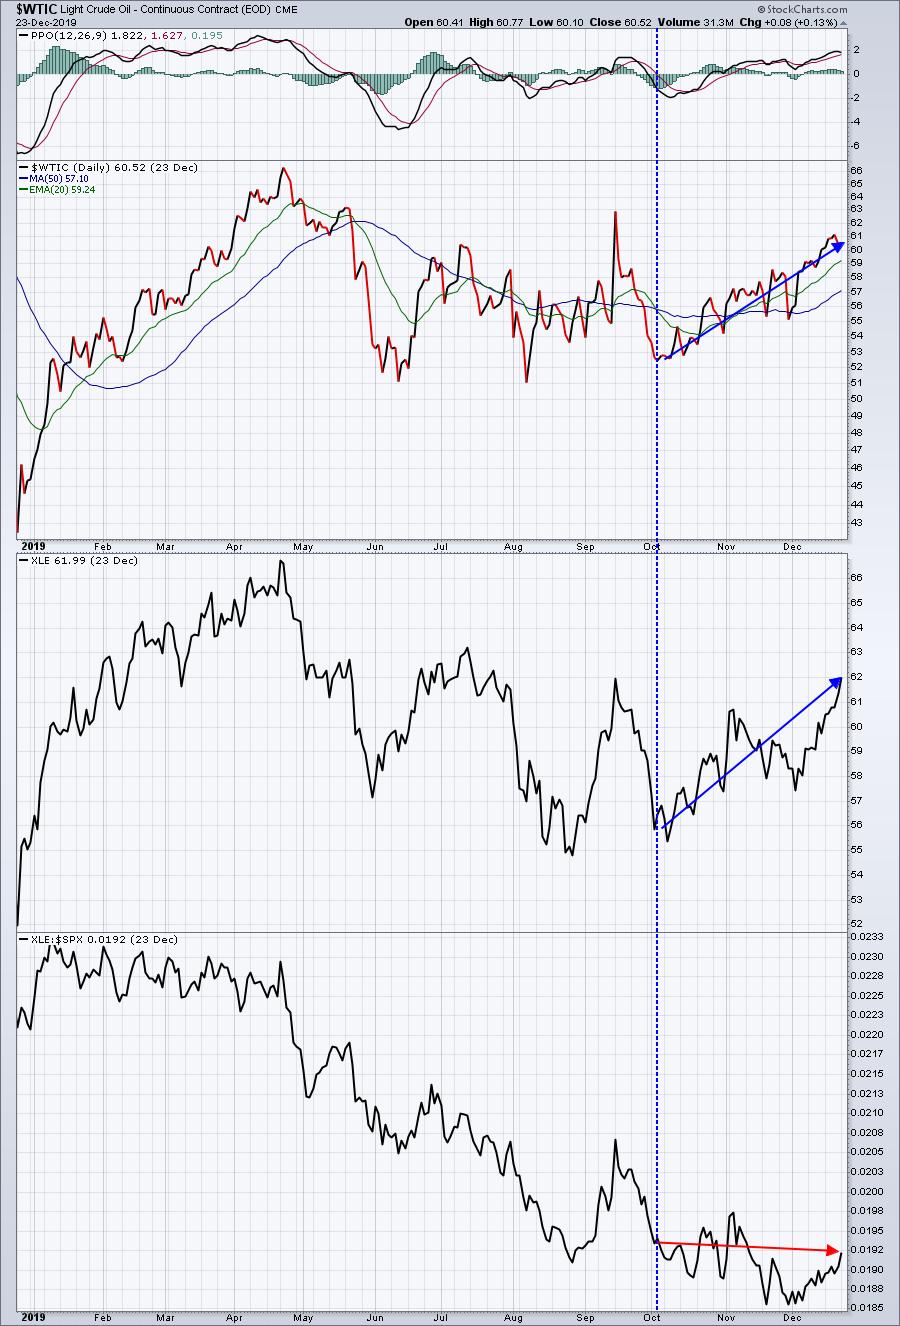
In order to outperform the S&P 500, we need sectors, industry groups, and stocks that are outperforming that benchmark. We're now beginning to see energy stocks move higher, but, as a whole, it's still not a great area of the market. So owning a couple of leaders isn't a bad idea, but I'd avoid just charging into the sector full speed ahead. The chart is not signaling that at all.
Active Trade Alerts
We now have two active trade alerts as we added VC earlier today:
TPX (+0.25%) - reports earnings on February 12. TPX was down earlier and neared its rising 20 day EMA, but has since recovered, moving into positive territory. The chart remains strong.
VC (-0.77%) - reports earnings on February 19. We alerted VC this morning at 88.27 with additional entries at 87, 86, 85, and 84. Our target is 105.00 and our stop is any close beneath 83.50. Lots of details were included in the alert that was emailed to members earlier today, including a current look at the chart.
Strong Earnings ChartList (SECL)
Our SECL currently has 363 annotated charts on it - these are companies that have beaten Wall Street consensus estimates as to both revenues and EPS in their latest quarterly earnings reports, are liquid (typically trade at least 200,000 shares daily on average), and look solid technically. If you're an EarningsBeats.com member and also a StockCharts Extra member (or above), and you've sent us your User ID at StockCharts, we'll send you this ChartList as part of our EarningsBeats.com service, and you can download it directly into your SC account. If for some reason, you haven't received a copy, be sure to write us at "support@earningsbeats.com", provide us that User ID, and we'll make sure you receive a copy.
Today, I ran a scan of our SECL, looking for stocks setting new 52 week highs. Here was the scan code used:
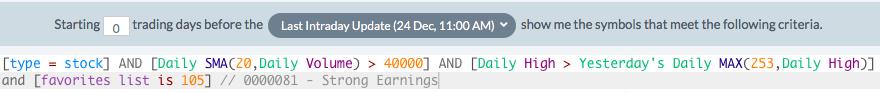
Very simple code. I then sorted the results and here are the stocks that made the list with a SCTR score below 90 (I used below 90 because most stocks with SCTRs above 90 are typically overbought):
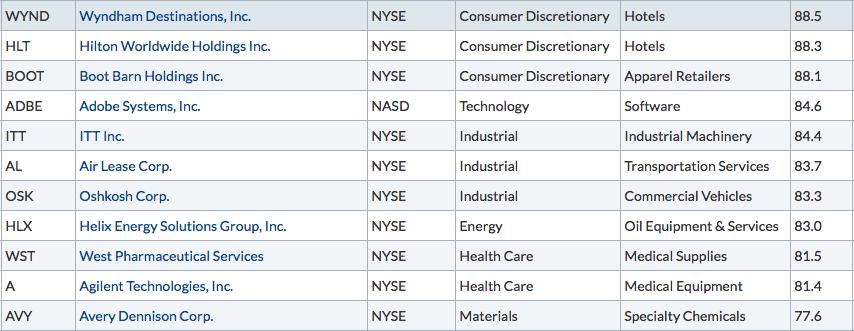
Here are three interesting charts from the list above:
BOOT:
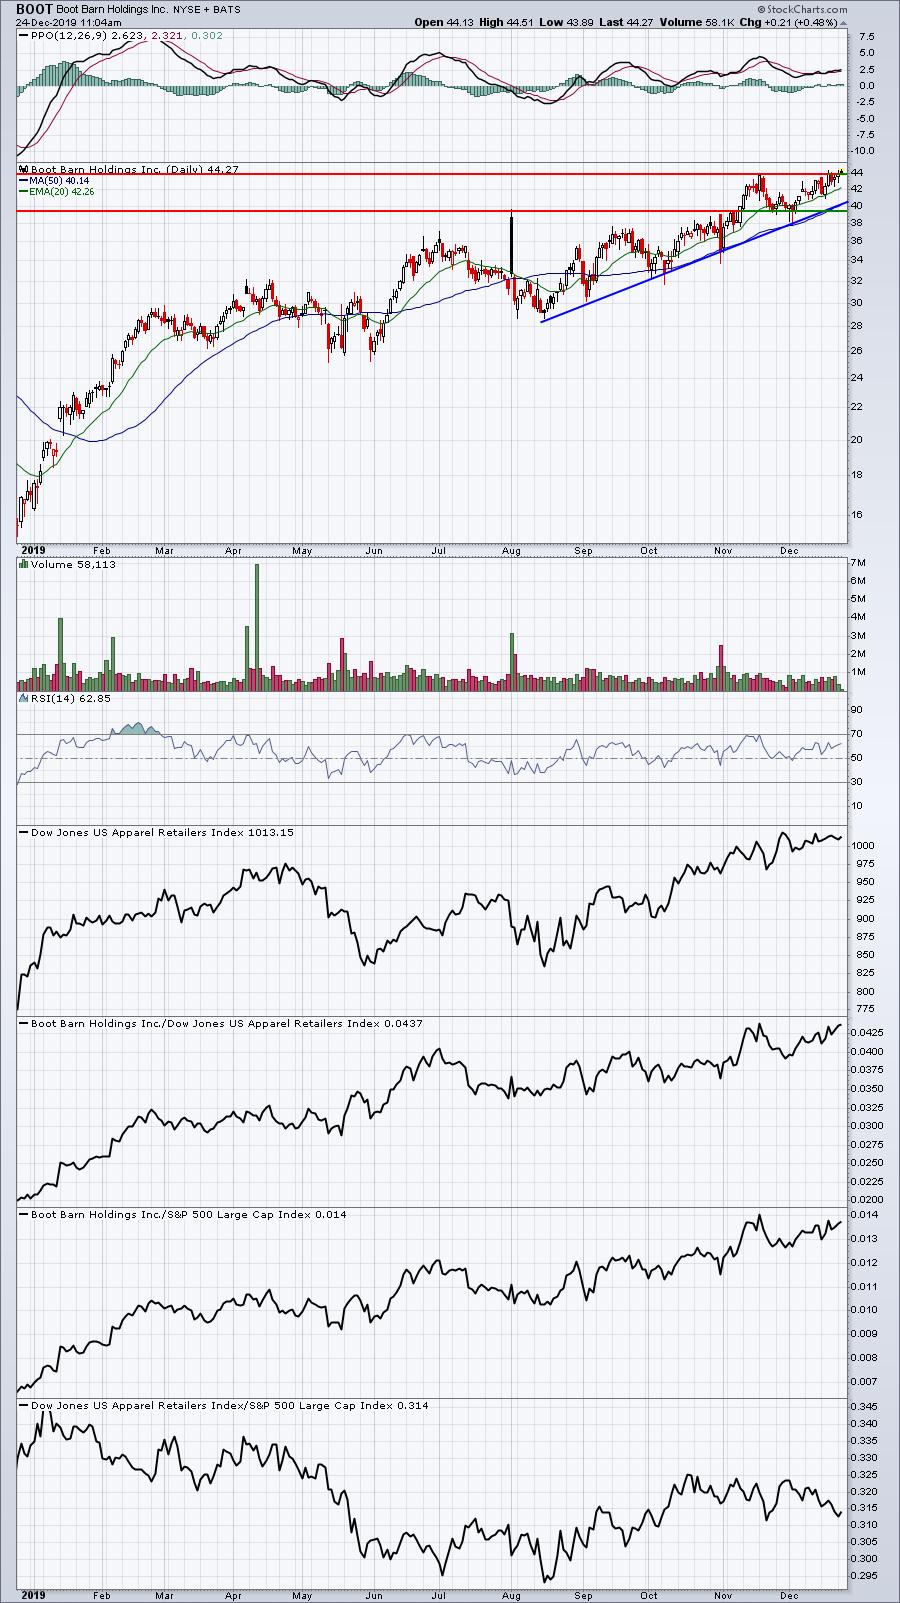
BOOT is a leader in the apparel retailers ($DJUSRA) and is attempting a breakout today after consolidating the past 5 weeks or so. As long as 39.50-40.50 support holds, BOOT remains a stock I'd hang onto.
HLX:
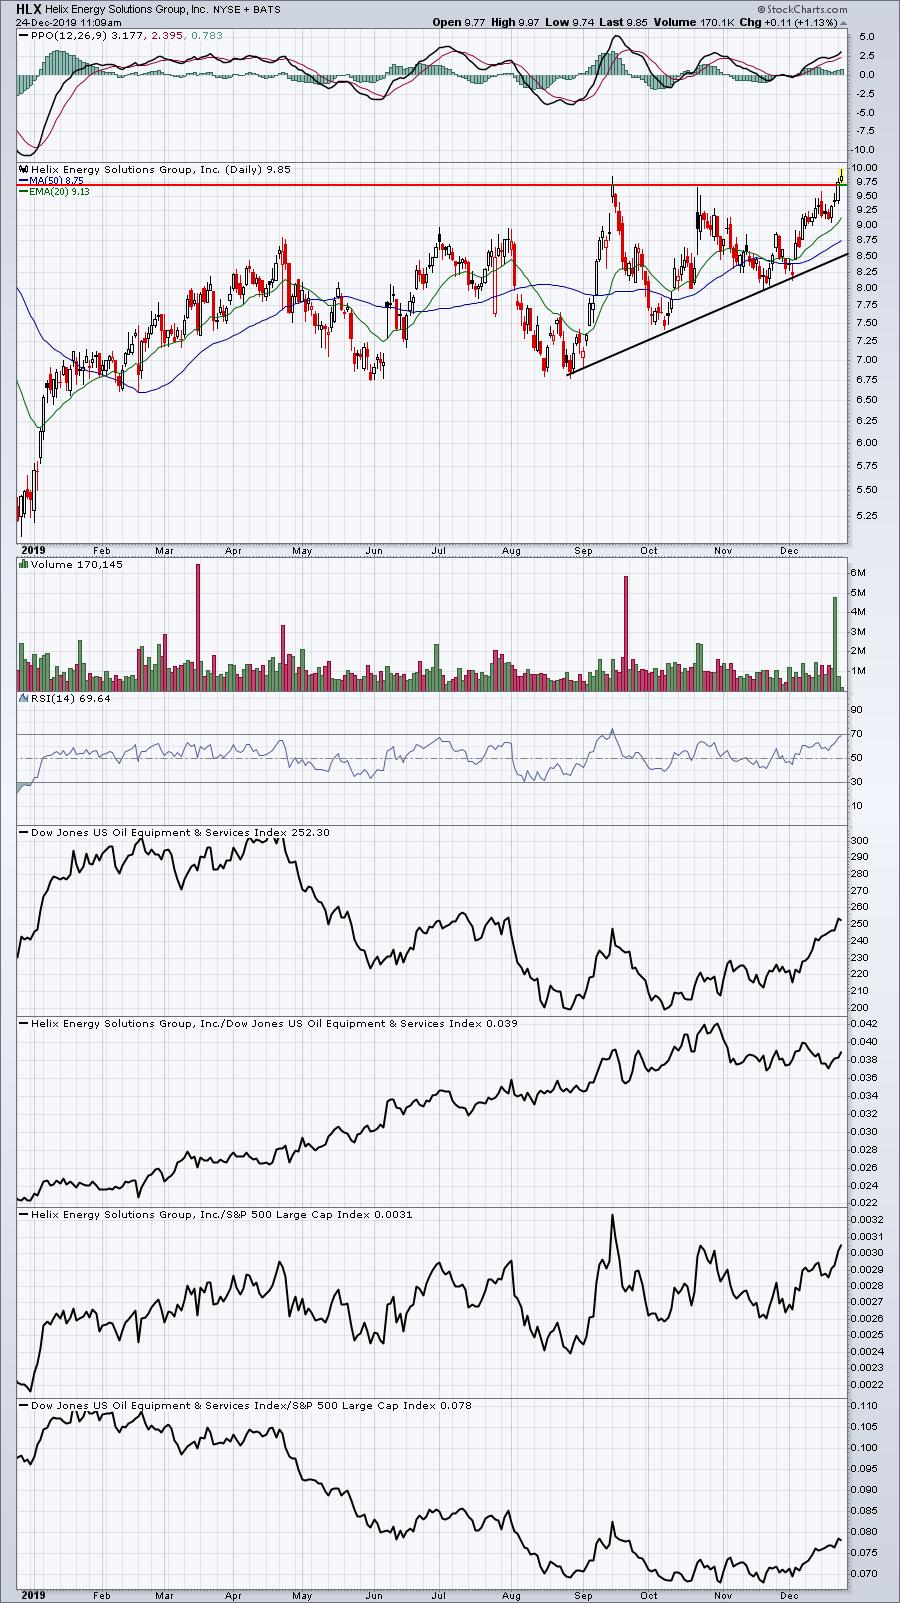
HLX was the energy stock that I discussed at the bottom of my November 16th Trading Places blog article, "2020 Market Outlook And A Turnaround Candidate To Consider In An Unlikely Area". It was a leader then and it remains a leader. While it had pulled back in mid-November to a solid reward to risk entry area, HLX is now breaking out, adding more bullish fuel to the fire. Also discussed in that article was another energy stock, Halliburton (HAL). I suggested an initial target of 25, which it hit today.
AVY:
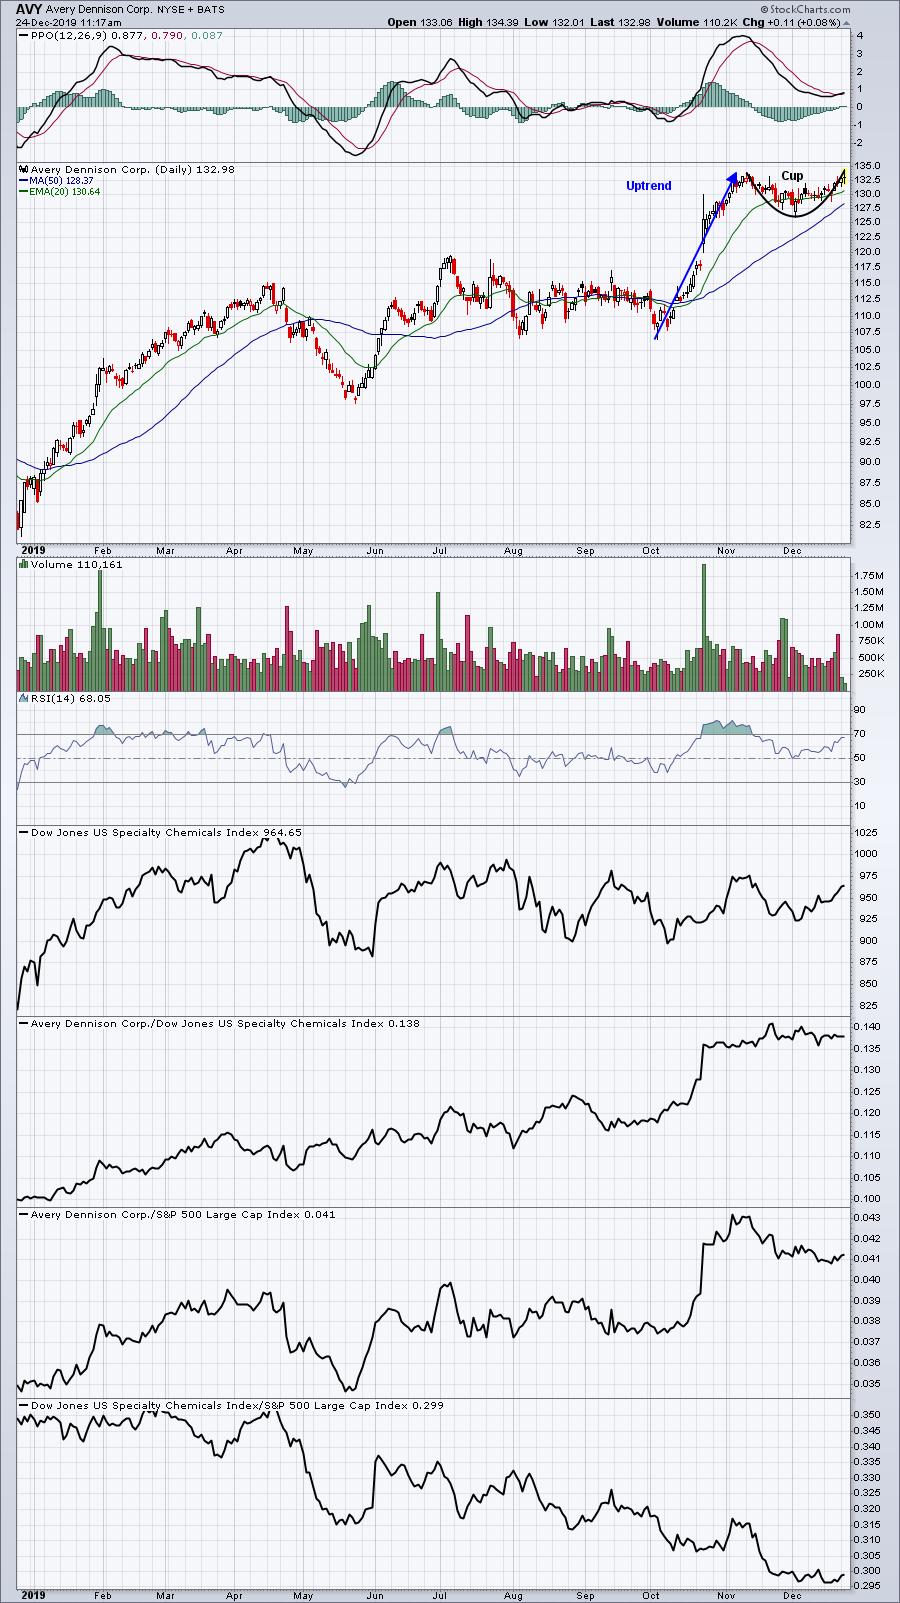
AVY is a leader in specialty chemicals ($DJUSCX) and, after an extended rally in October, has been consolidating in a bullish cup. Should a handle form back to the rising 20 day EMA, that would represent a solid reward to risk entry into AVY. A breakout above the cup would then measure to roughly 140.00.
If you enjoy this type of analysis and would like to receive trading candidates every day, consider a $7 30-day trial to EarningsBeats.com. This article is the Daily Market Report that I send to EarningsBeats.com members every single day that the stock market is open. I'd love to have you try our service. CLICK HERE to start your trial.
Movers & Shakers
Here is a stock that looks great, but may need to pause temporarily as it's hitting price resistance:
STX:
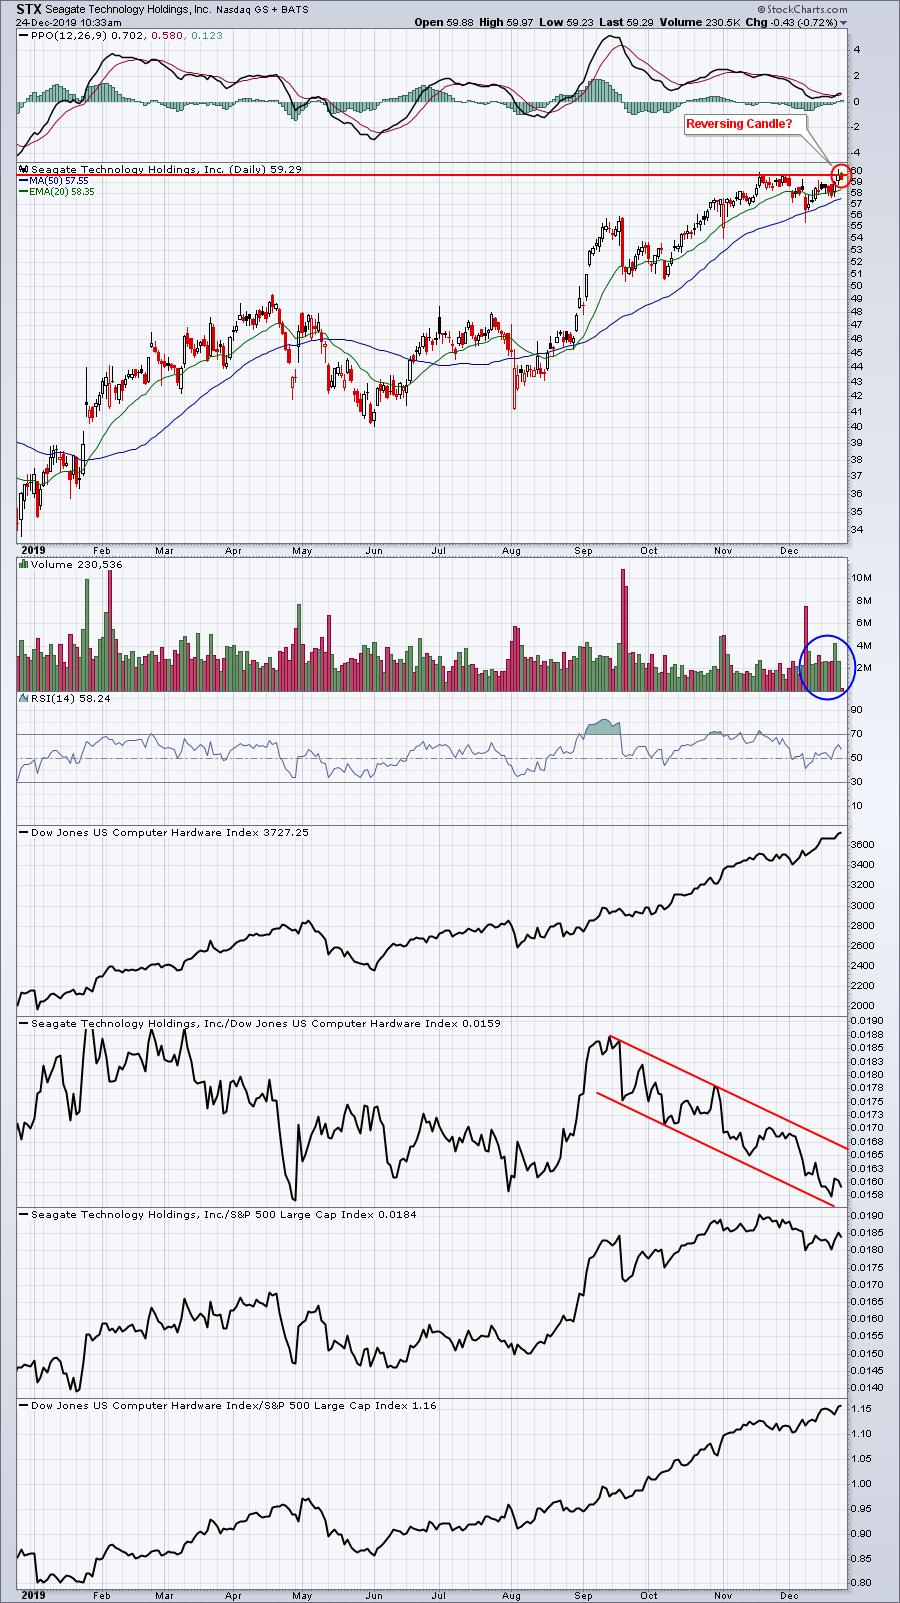
It's still early, but currently there's a dark cloud cover candle in place. If STX finishes today with that candle...or a bearish engulfing candle, we could see a temporary slide back to the rising 20 day EMA. I do like the increasing volume. But to really ignite STX, I'd want to see a price breakout and also a breakout of the relative down channel that STX has been mired in since topping in September.
Earnings Reports
Here are the key earnings reports for this week, featuring stocks with market caps of more than $5 billion. I also include a few select companies with market caps below $5 billion. Finally, any portfolio stocks (or active trade alerts) that will be reporting results are highlighted in BOLD. Please make sure you check for earnings dates for any companies you own or are considering owning:
Monday, December 23:
None
Tuesday, December 24:
None
Wednesday, December 25:
None
Thursday, December 26:
None
Friday, December 27:
None
Economic Reports
None
Happy trading!
Tom


