Executive Market Summary
- Pre-market action is pointing to another strong open as the year end rally continues
- Dow Jones futures are pointing an 80 point gain at the open and NASDAQ futures are showing relative strength once again
- A couple smaller biotechs - Flexion Therapeutics (FLXN) and Immunomedics, Inc. (IMMU) - were reiterated with Buy ratings
- Apple (AAPL) and Amazon.com (AMZN) are both higher in pre-market action, helping the NASDAQ
- Both of our alerts are technically-sound, despite small losses on Thursday
Market Outlook
The current market environment is vastly different from the secular bear market that we saw from 2000-2012. Rallies in treasuries sent yields lower, but those rallies also sent stocks lower as money rotated away from the equity market. We're no longer seeing that, although when the 10 year treasury yield ($TNX) falls, it tends to result in more consolidation and basing on the S&P 500. Surges higher in the TNX, however, accompany big stock market advances. So with that in mind, it is going to be very important to watch to see if the TNX breaks above yield resistance near 1.95%:
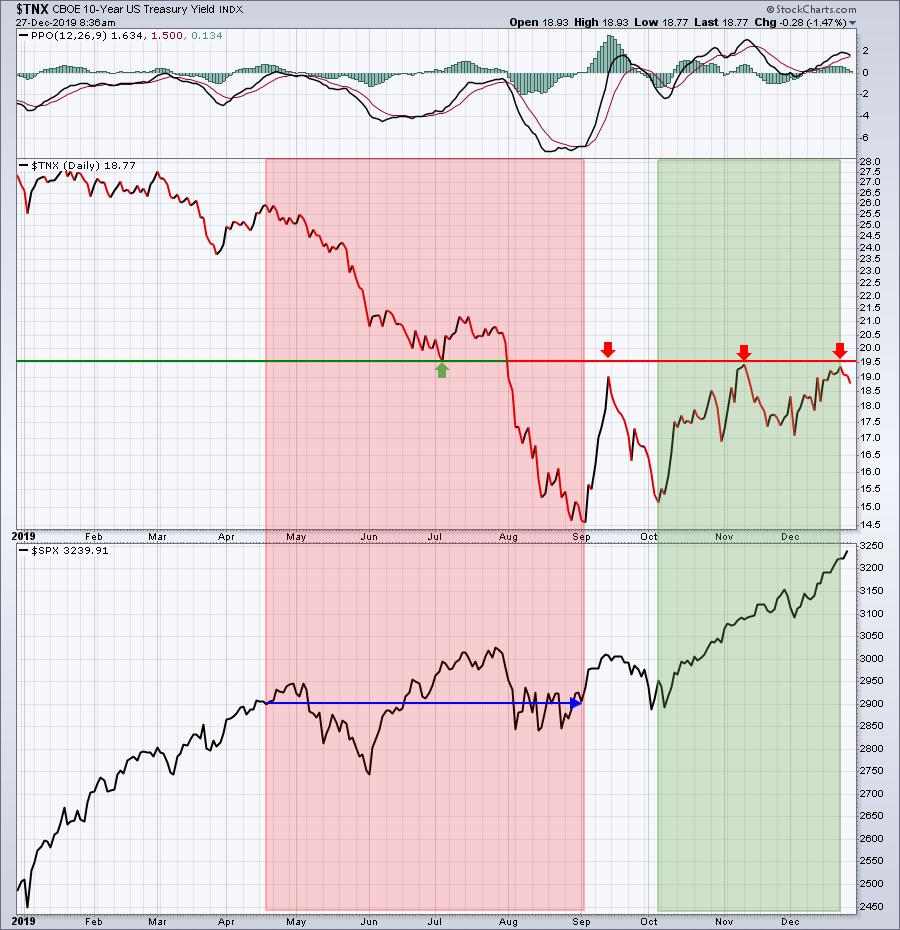
A rising TNX is typically synonymous with an improving economic picture. Economic strength means rising profits for Corporate America and a higher S&P 500. A breakout above 1.95% would likely continue the push higher in U.S. equities, while hesitation or a pullback could trigger a period of consolidation, maybe even selling.
Sector/Industry Focus
Amazon.com (AMZN) was pointed out in yesterday's article when it was 1823.98. I wanted to see it break above 1850 and I wanted to see heavy volume. I got both on yesterday's close as AMZN finished at 1868.77 and volume soared after I published my article. I see AMZN moving back up to test its previous highs, and eventually break out from the current bullish ascending triangle pattern. Here's AMZN's longer-term weekly chart:
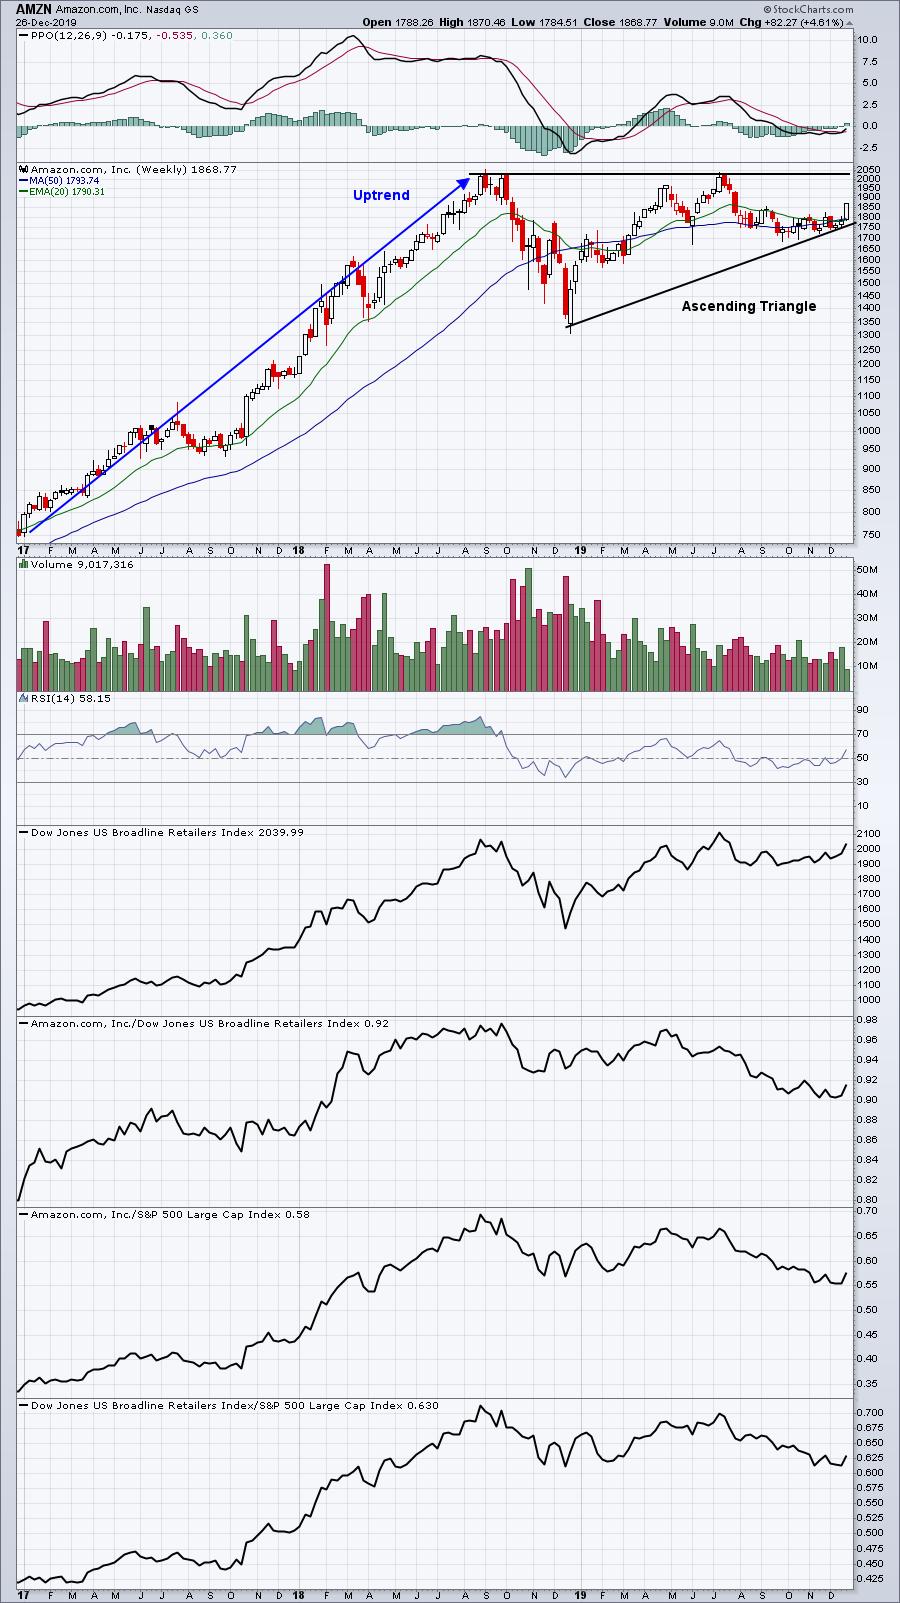
This pattern, upon breakout, measures 750 points higher to roughly 2800.
AMZN is obviously a big player in the broadline retail group ($DJUSRB). As you might imagine, AMZN's strong day on Thursday triggered a short-term breakout in the overall industry group:
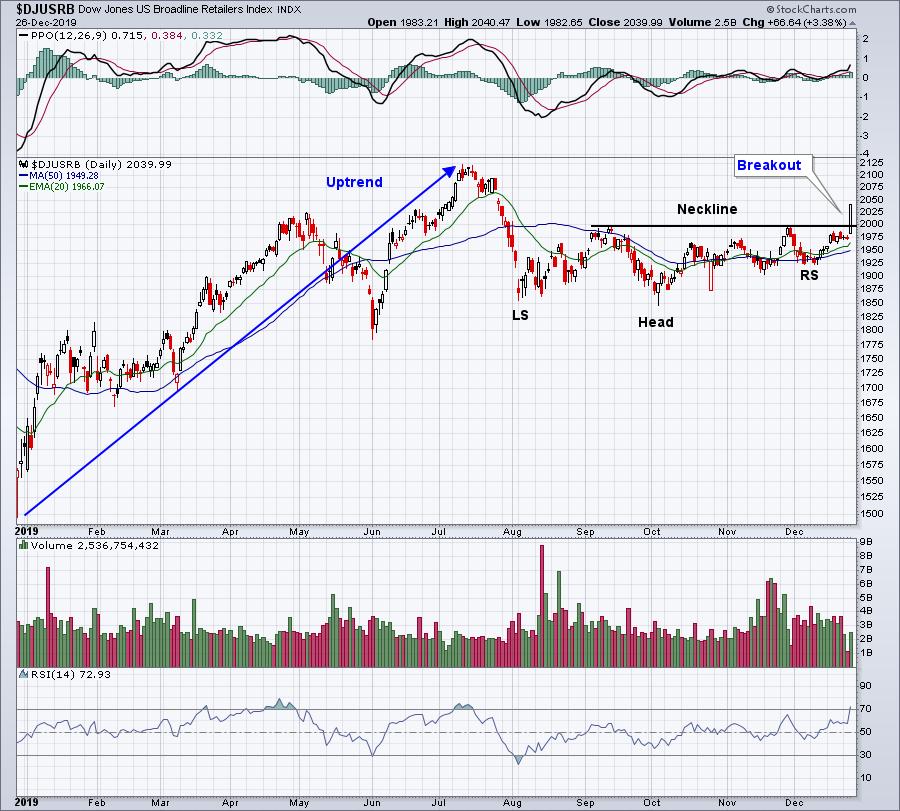
There's a sloppy inverse head & shoulders continuation pattern that was confirmed with Thursday's breakout. This pattern measures initially to 2150-2160.
Active Trade Alerts
We have two active trade alerts currently:
TPX (-0.36%) - reports earnings on February 12. TPX is trending higher and is still well above its rising 20 day EMA. Our target here remains 91.80, although we've sold a portion to capture profits after entering TPX near gap support in early December.
VC (-1.30%) - reports earnings on February 19. We are using the new zero-commission trading environment to our advantage by slowly building a position in VC down to 84.00. Yesterday, our 2nd (of 5) entry triggered at 87.00. Gap support is 83.92. Our closing stop is just beneath that level at 83.50.
Strong Earnings ChartList (SECL)
Our SECL currently has 363 annotated charts on it - these are companies that have beaten Wall Street consensus estimates as to both revenues and EPS in their latest quarterly earnings reports, are liquid (typically trade at least 200,000 shares daily on average), and look solid technically. If you're both an EarningsBeats.com member and also a StockCharts Extra member (or above), and you've sent us your User ID at StockCharts, we'll send you this ChartList as part of our EarningsBeats.com service, and you can download it directly into your SC account. If for some reason, you haven't received a copy, be sure to write us at "support@earningsbeats.com", provide us that User ID, and we'll make sure you receive a copy.
If you're not currently an EarningsBeats.com member, but would like to try us for 30 days, there's only a $7 charge for your first 30 days. CLICK HERE to sign up and start your trial today! For a limited time, there's even better news. We'll refund the $7!!! So try out our entire service for free for 30 days! That will include receiving all 40 stocks in our 4 portfolios - Model, Aggressive, Income, and Value.
This morning, I ran a scan of the SECL companies, searching for companies that have RSIs below 45 and SCTRs above 50 to see if any strong stocks have pulled back to key support levels. I know the S&P 500 is overbought, but that doesn't mean every stock is. Here is the "RSI below 45, SCTRs above 50" list today, sorted in SCTR order (highest to lowest):
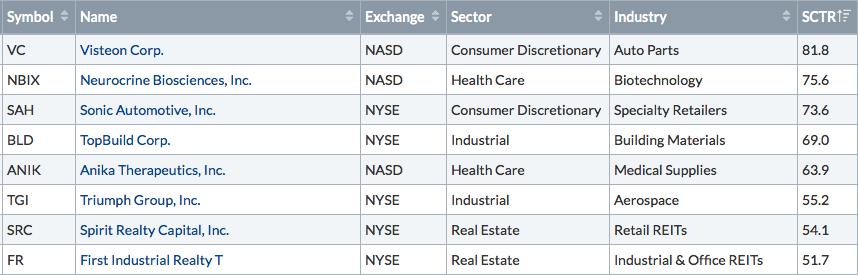
Here are a few interesting stocks:
VC:
VC is a current trade alert of ours and it's moving lower with light volume toward gap support just beneath 84.
NBIX:
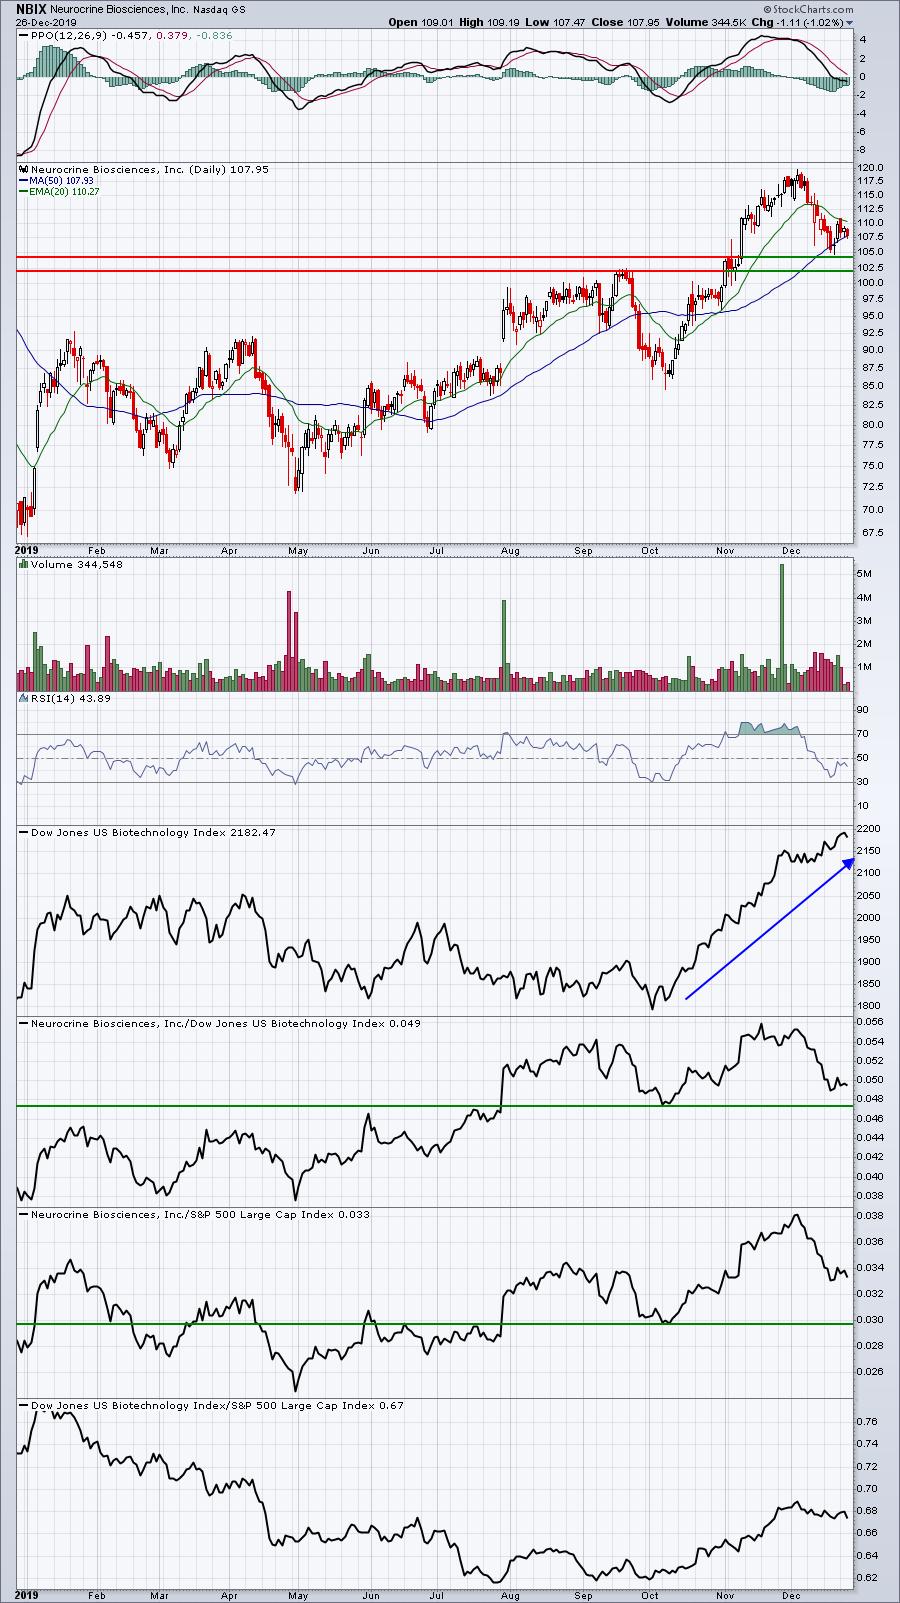
NBIX has excellent support from 102-104 so as it moves lower it becomes a better reward to risk trade. Volume has been fairly heavy on the selling, but key price support has not been lost.
BLD:
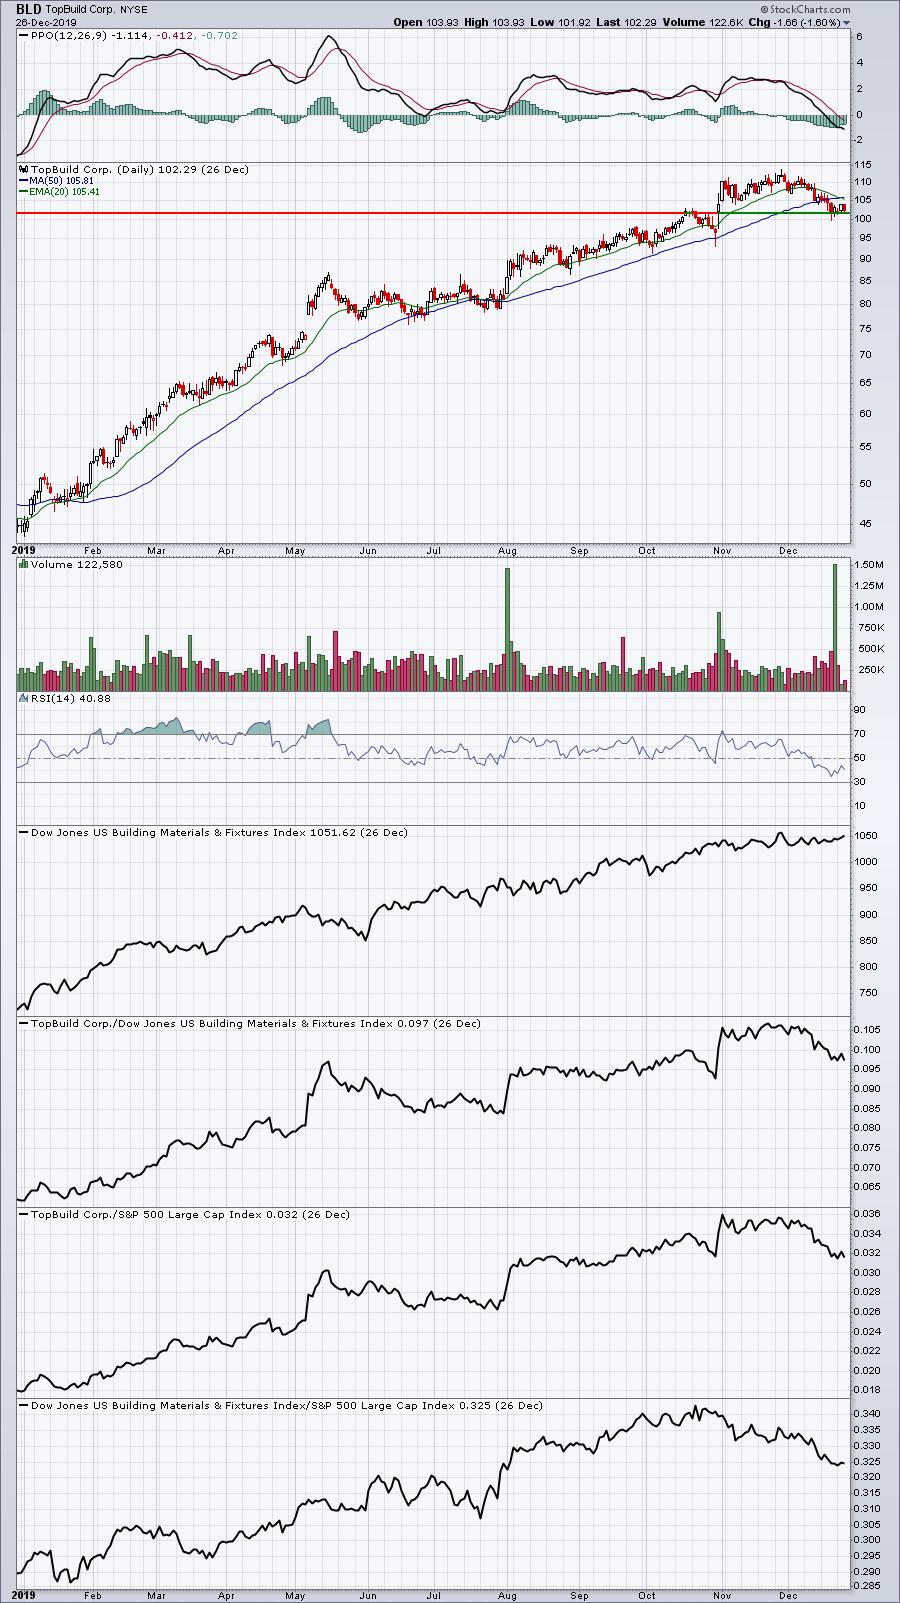
BLD has fallen back 10% or so to test the top of gap support. The bottom of gap support resides closer to 97, so further selling is possible, but this is an area I'd look for a possible reversal.
Movers & Shakers
I ran a scan of all NYSE stocks that yesterday traded at least 1.5 times their average daily share volume. Considering that most stocks are trading fewer shares during the holidays, stocks that trade more than 1.5 times their daily average share volume are certainly trading heavier-than-normal volume. Here are 5 stocks that traded heavy volume yesterday and look interesting technically:
GTES:
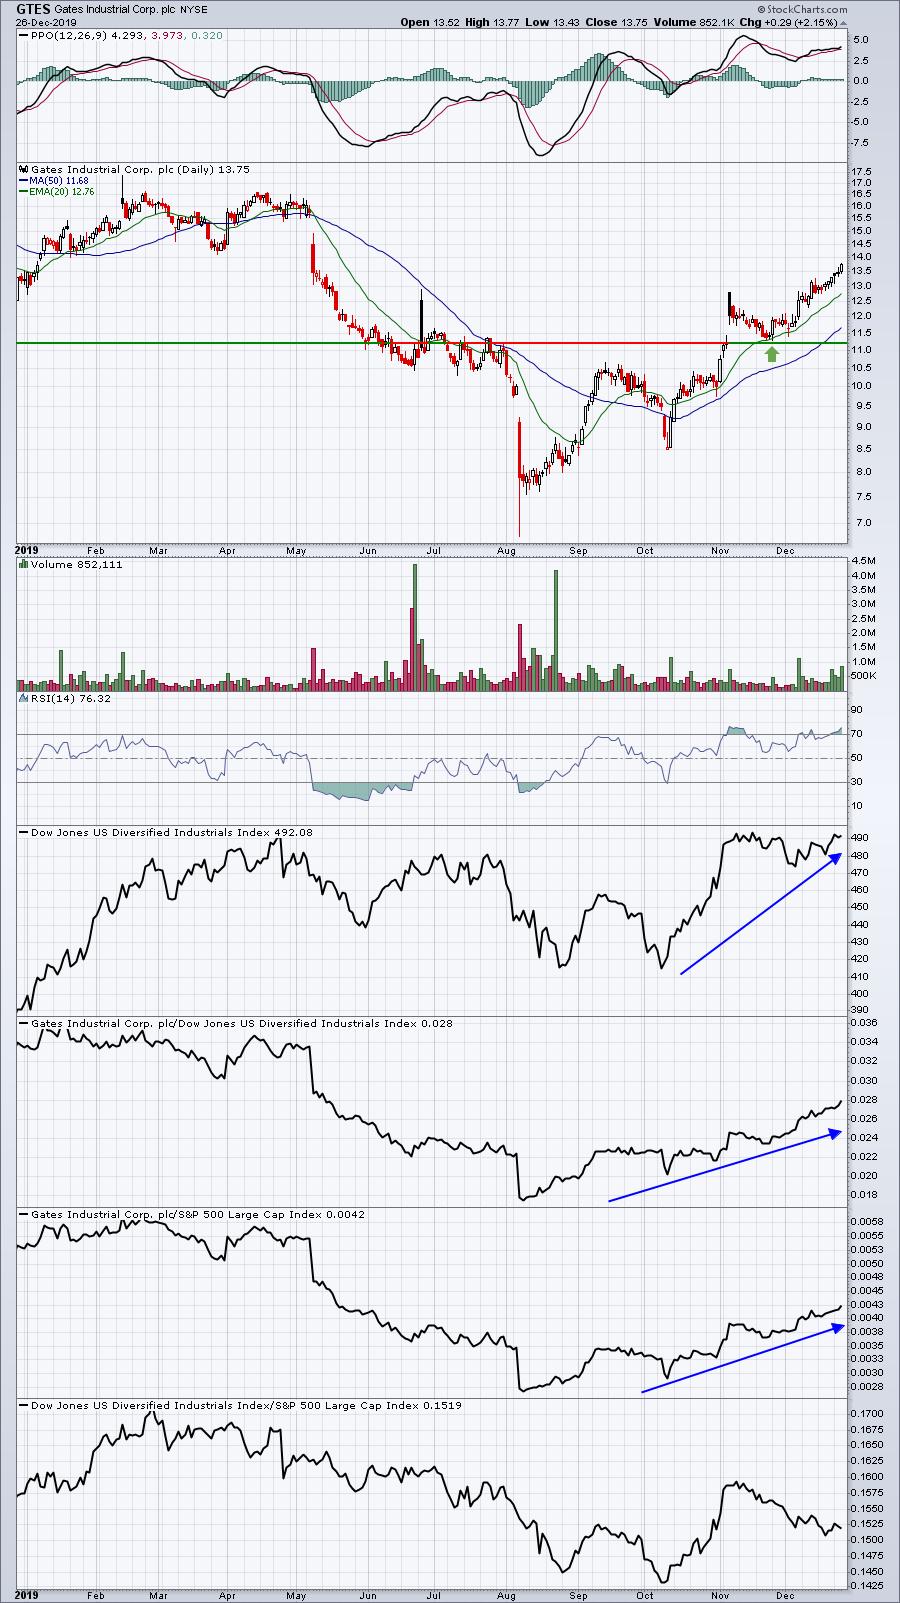
The green arrow highlights EXACTLY what we look for - a trip back to test gap support and the 20 day EMA. That led to a very nice bounce. GTES has a very solid looking chart now and could be considered on 20 day EMA tests.
KDMN:
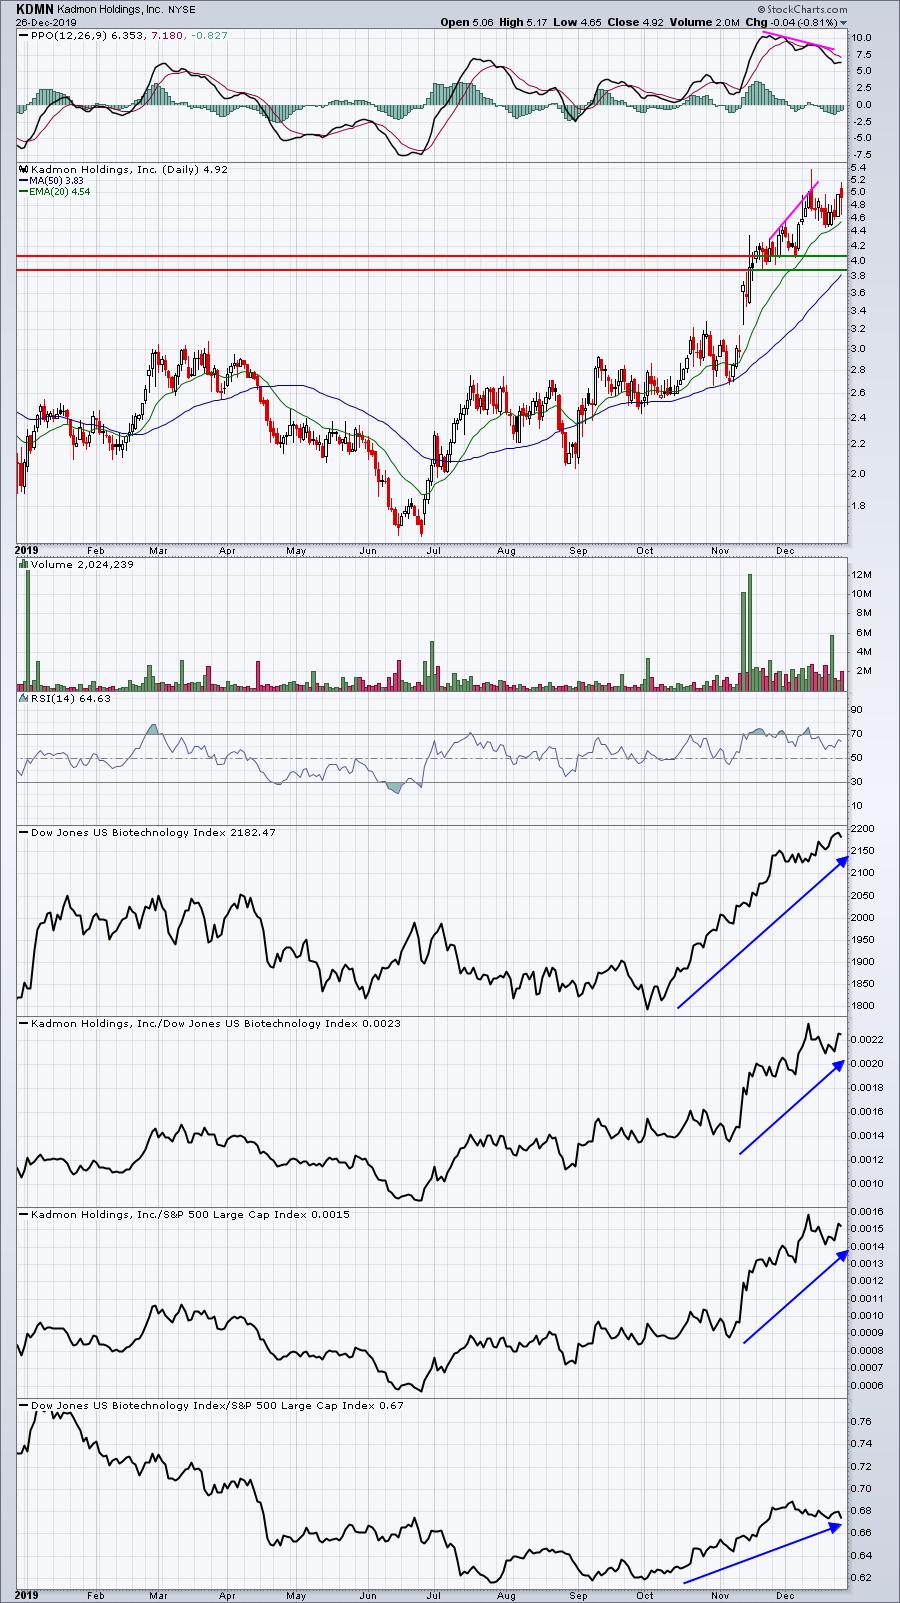
I've drawn a couple of price support lines that KDMN could reach as a result of its negative divergence (pink lines highlighting higher price, but lower PPO). Smaller biotechs can be very volatile and extremely dangerous, but the chart is interesting, especially given the increase in volume that's accompanied the recent price rise.
LEG:
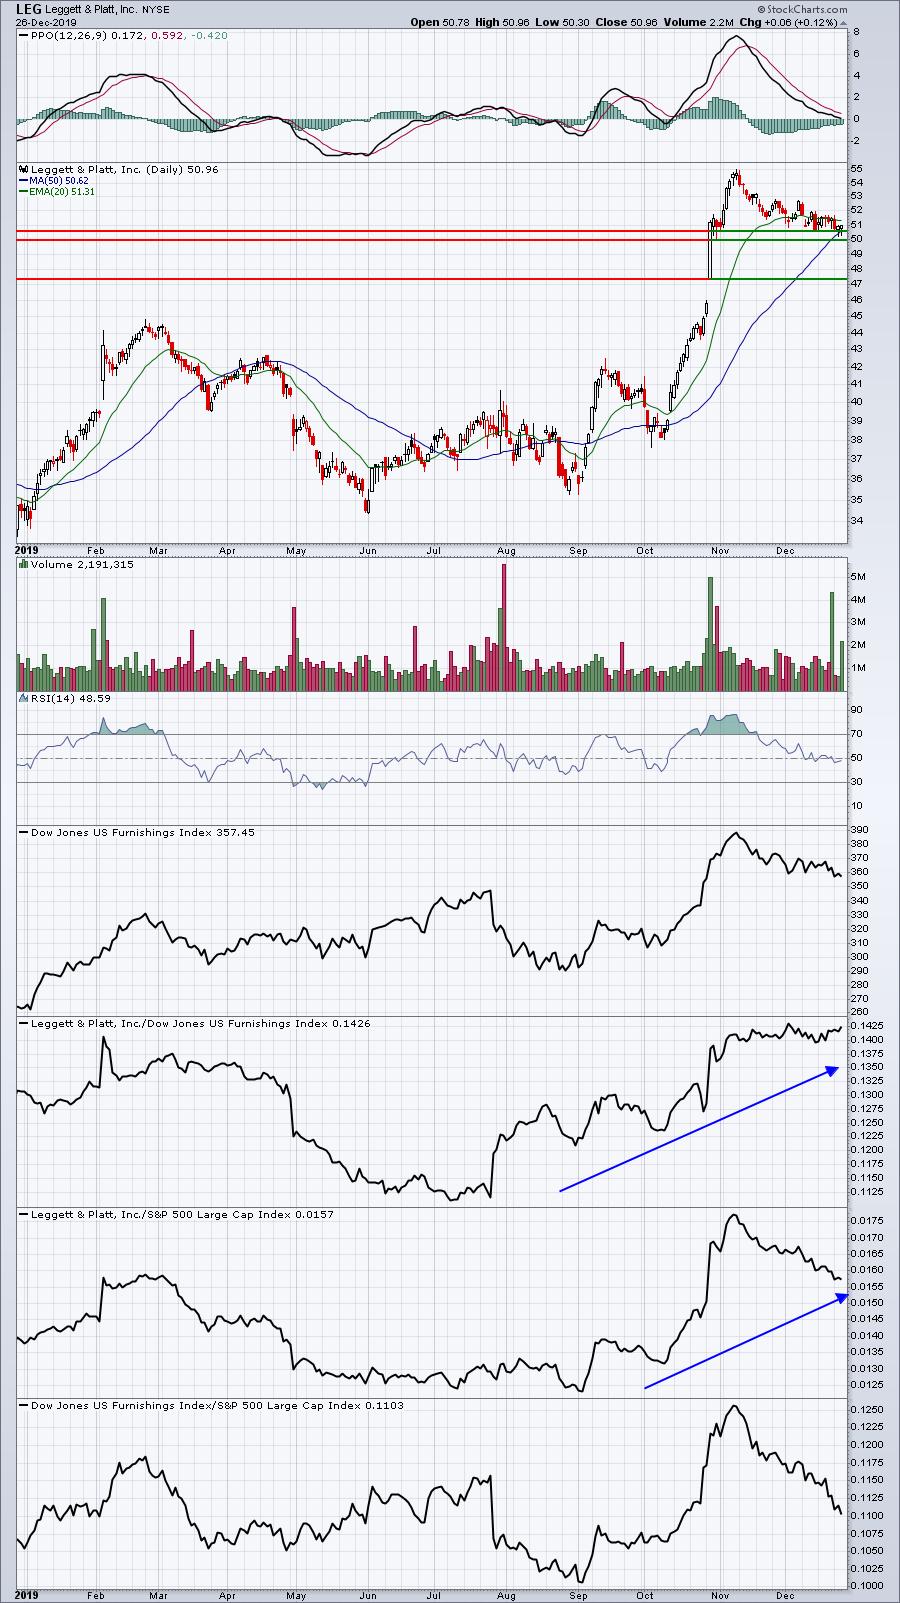
After the huge move higher in late-October, the sellers only had control down to 50-51. The two hammers the last two days on 50 day SMA support and close to the price support identified above suggests there's a strong reward to risk scenario here. Note also the PPO at centerline support and the RSI now in the 40s.
RFP:
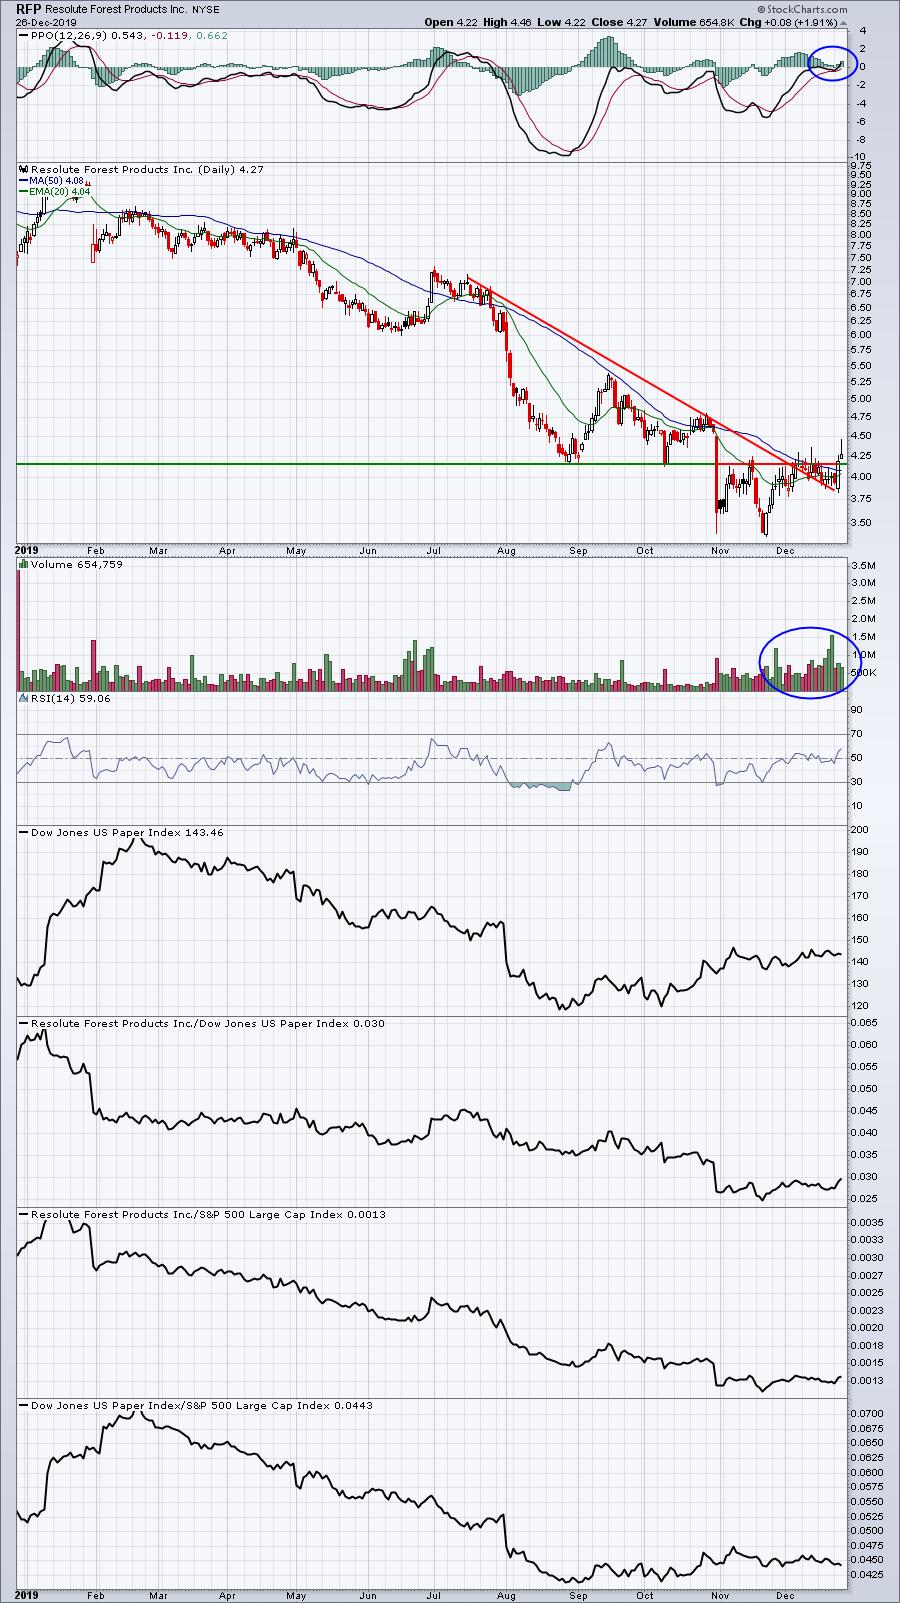
RFP is acting as though the bottom is in and volume seems to support the notion. I'd like to see this one continue to close above its now-rising 20 day EMA. The downtrend line was broken so it's quite possible this is the start of at least a short-term uptrend.
Special Note
Julius de Kempenaer is joining EarningsBeats.com for our 7th mini-series event this morning as we move closer and closer to Market Vision 2020, our online financial conference slated for Saturday, January 4, 2020. Anyone interested in attending our event this morning, "An Introduction to RRG", you can do so by following the room link below. The room will open by 10:30am EST and the event will begin promptly at 11:00am EST. Here's the link:
Earnings Reports
Here are the key earnings reports for this week, featuring stocks with market caps of more than $5 billion. I also include a few select companies with market caps below $5 billion. Finally, any portfolio stocks (or active trade alerts) that will be reporting results are highlighted in BOLD. Please make sure you check for earnings dates for any companies you own or are considering owning:
Friday, December 27:
None
Monday, December 30:
None
Tuesday, December 31:
None
Wednesday, January 1:
None
Thursday, January 2:
None
Friday, January 3:
LW
Economic Reports
None
Happy trading!
Tom


