Executive Market Summary
- We're up again today with leadership from the NASDAQ; small caps lag
- Most sectors are higher with technology (XLK) showing a slight lead
- Apple's (AAPL) leadership is helping the NASDAQ and computer hardware ($DJUSCR)
- Banks ($DJUSBK) are strong with the 10 year treasury yield ($TNX) up a basis point to 1.92%
- Amazon.com (AMZN) is on the move, leading the S&P 500
- Our two alerts are down fractionally
Market Outlook
We consolidated for almost two years from January 2018 through September 2019, similar to what we saw from 2014 into 2016. Q4 has been a completely different animal. This is showing the hallmarks of an extended rally that could last for many more months. To illustrate the price action, check out the Dow Jones weekly chart:
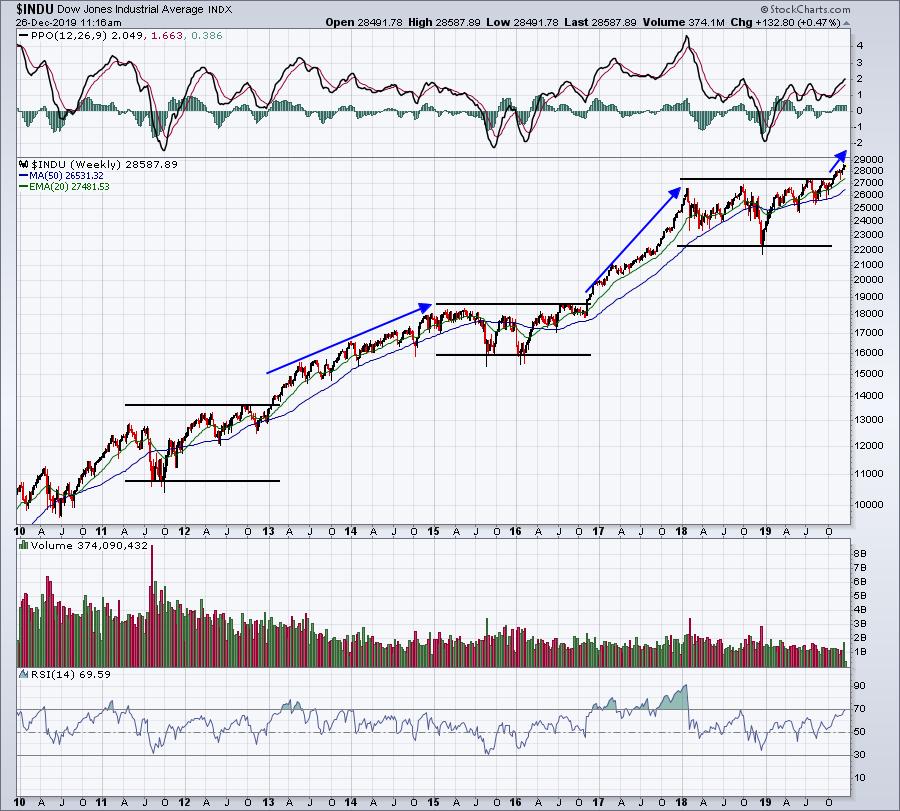
I know the weekly RSI is now nearly 70, but let me point out that the weekly RSI hit 70 in Q4 2016 and Q1 2013, at the very beginning of a major advance. I would not assume that a bull market rally is likely to end just because it reaches an overbought level. Long-term period of consolidation, or basing, is generally very healthy for the stock market and we've seen what can happen after these extended periods. It's one of the reasons why I've stated here in this blog that the S&P 500 is likely heading for 4000 in 2020. I'm sticking to that prediction. My 2019 year end target was 3225 when few were looking for the market to rise.
You can fight it or you can ride it.
Sector/Industry Focus
Utilities (XLU) is the perfect example of what typically happens during bull markets. Many investors are happy because the group is breaking out and making money. The problem, however, is that investors would be better off owning the S&P 500 (SPY) as defensive groups generally lag the broader index during bull market advances:
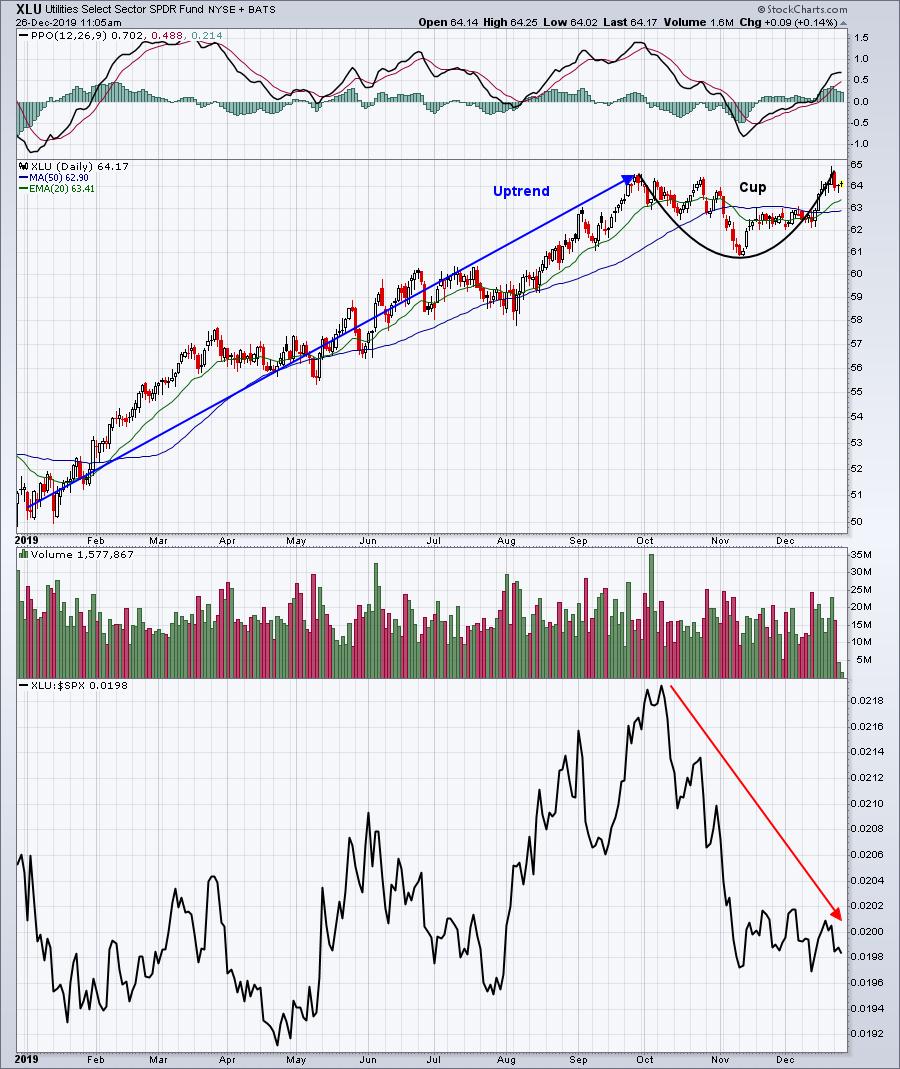
Since the end of the third quarter, the XLU has been flat, while the S&P 500 has soared higher. I'm not a fan of diversification for this reason. During a bull market advance, I want my money working harder for me. Utilities (XLU) and real estate (XLRE) are simply holding back much stronger returns. They'll both provide some relative relief when the stock market pulls back, but when will that happen?
Active Trade Alerts
We have two active trade alerts:
TPX (-0.74%) - reports earnings on February 12. TPX is down this morning, but it remains above the rising 20 day EMA (86.86), which is our closing stop to the downside.
VC (-0.48%) - reports earnings on February 19. We alerted VC earlier this week and have a strategy to accumulate on weakness. Currently, we've only entered our initial position.
Strong Earnings ChartList (SECL)
Our SECL currently has 363 annotated charts on it - these are companies that have beaten Wall Street consensus estimates as to both revenues and EPS in their latest quarterly earnings reports, are liquid (typically trade at least 200,000 shares daily on average), and look solid technically. If you're an EarningsBeats.com member and also a StockCharts Extra member (or above), and you send us your User ID at StockCharts, we'll send you this ChartList as part of our EarningsBeats.com service, and you can download it directly into your SC account. If for some reason, you haven't received a copy, be sure to write us at "support@earningsbeats.com", provide us that User ID, and we'll make sure you receive a copy.
I reviewed the worst performers on our SECL today, looking for value. Here are two that are worth considering for a trade:
OLLI:
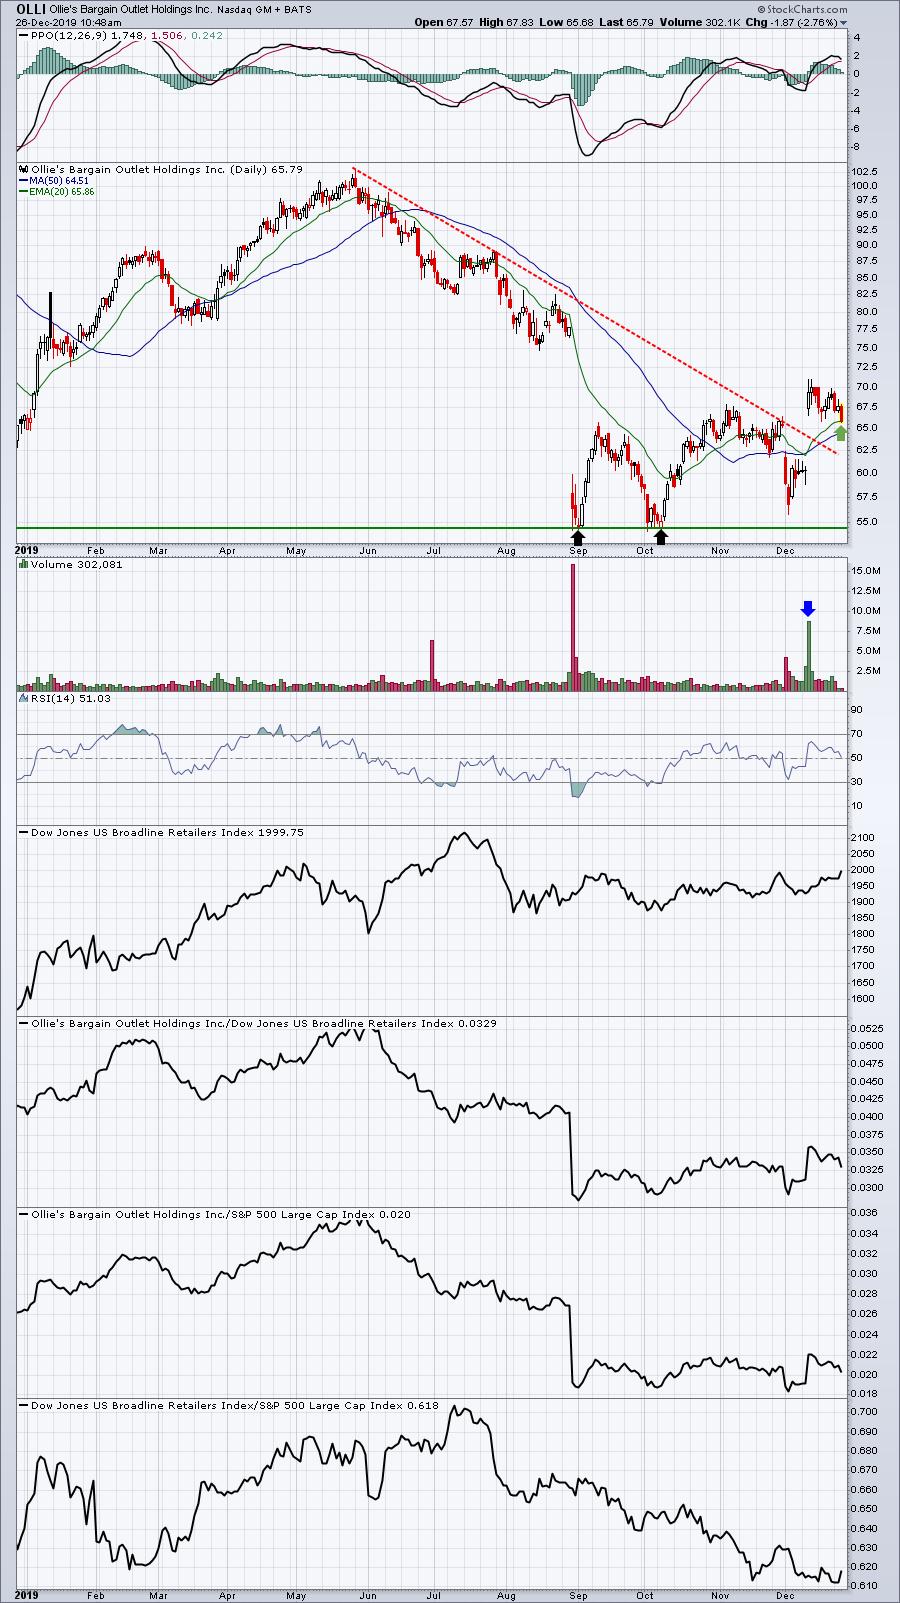
OLLI beat both revenue and EPS estimates in its latest quarterly earnings report and appeared to have broken its downtrend line. A double bottom (black arrows) was in play, prior to the character-changing gap higher. Today, OLLI is down and testing its rising 20 day EMA. This could be a level where we see OLLI reverse higher.
TGI:
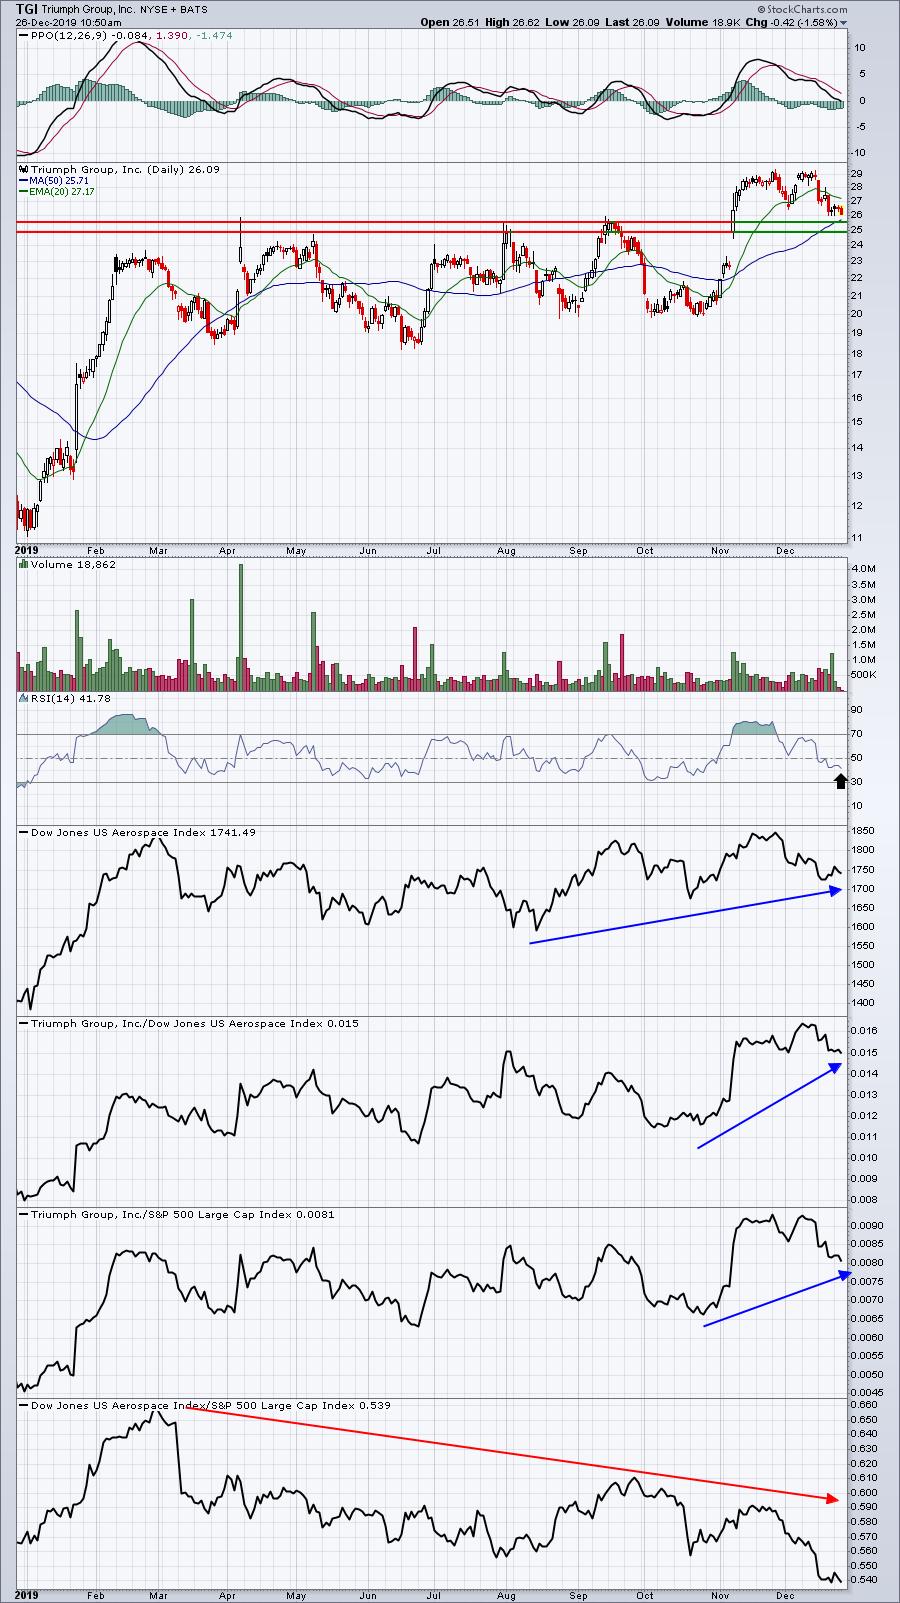
TGI was over 29 less than two weeks ago. Now it's 26. It's a leader in the aerospace area ($DJUSAS) and its RSI has retreated to 40, a level where we tend to see uptrending stocks reverse after profit taking. There's additional support down at its earnings gap, closer to 25, so accumulating from the current level down to gap support makes sense technically.
Movers & Shakers
I looked through this morning's SCTR Movers at StockCharts.com and found the following "movers" to be interesting:
OLED:
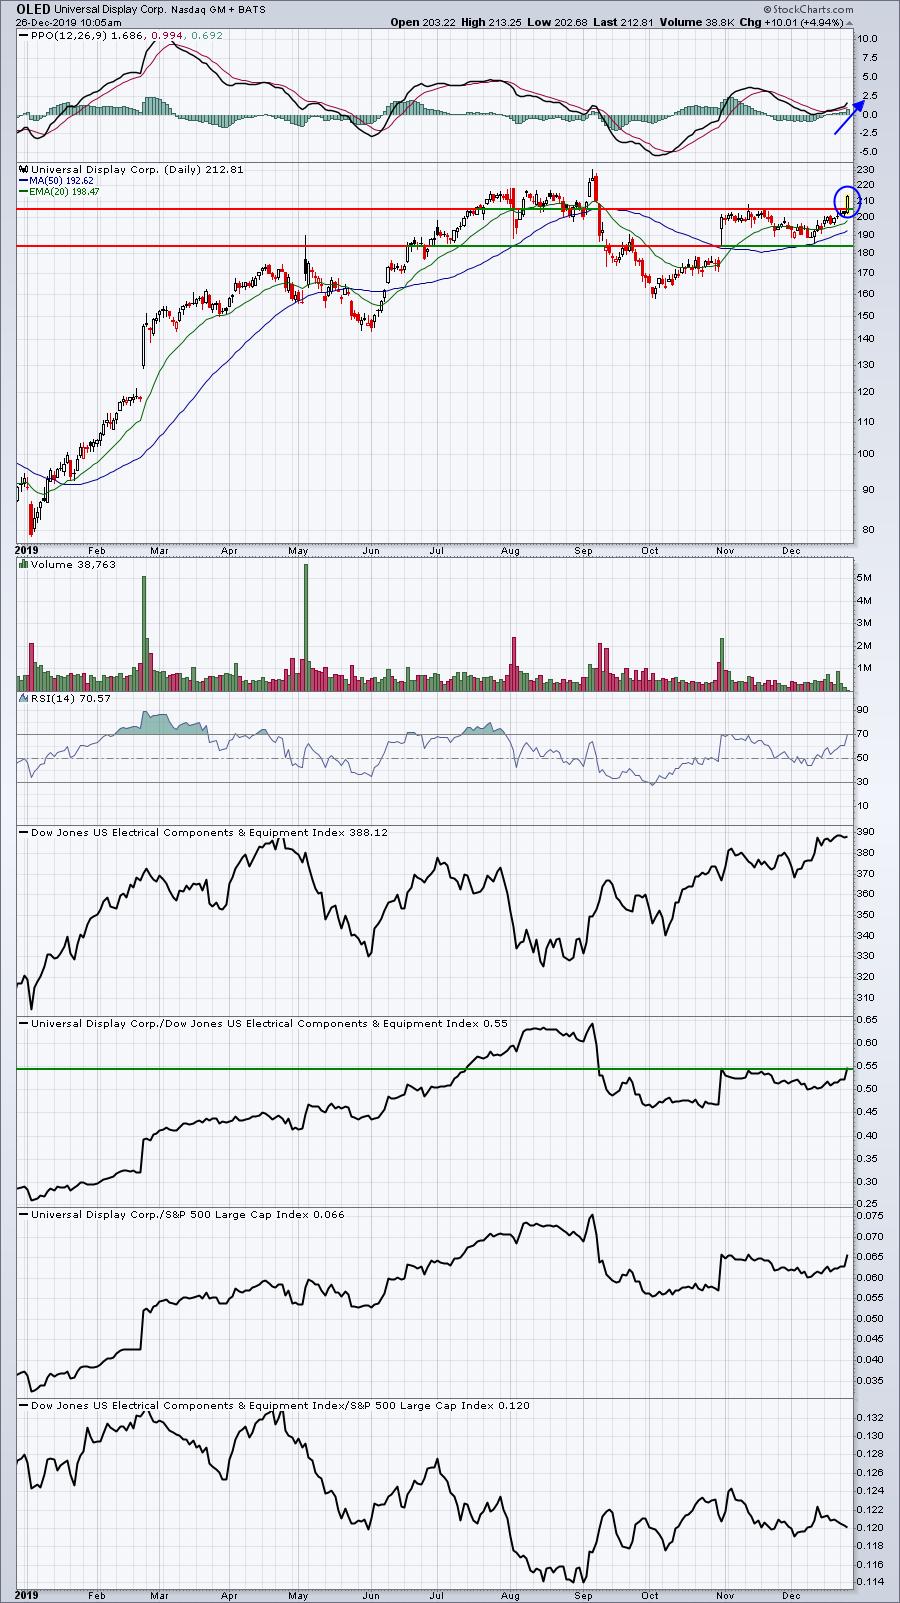
The short-term breakout is setting OLED up to test overhead price resistance from 227-230.
SNAP:
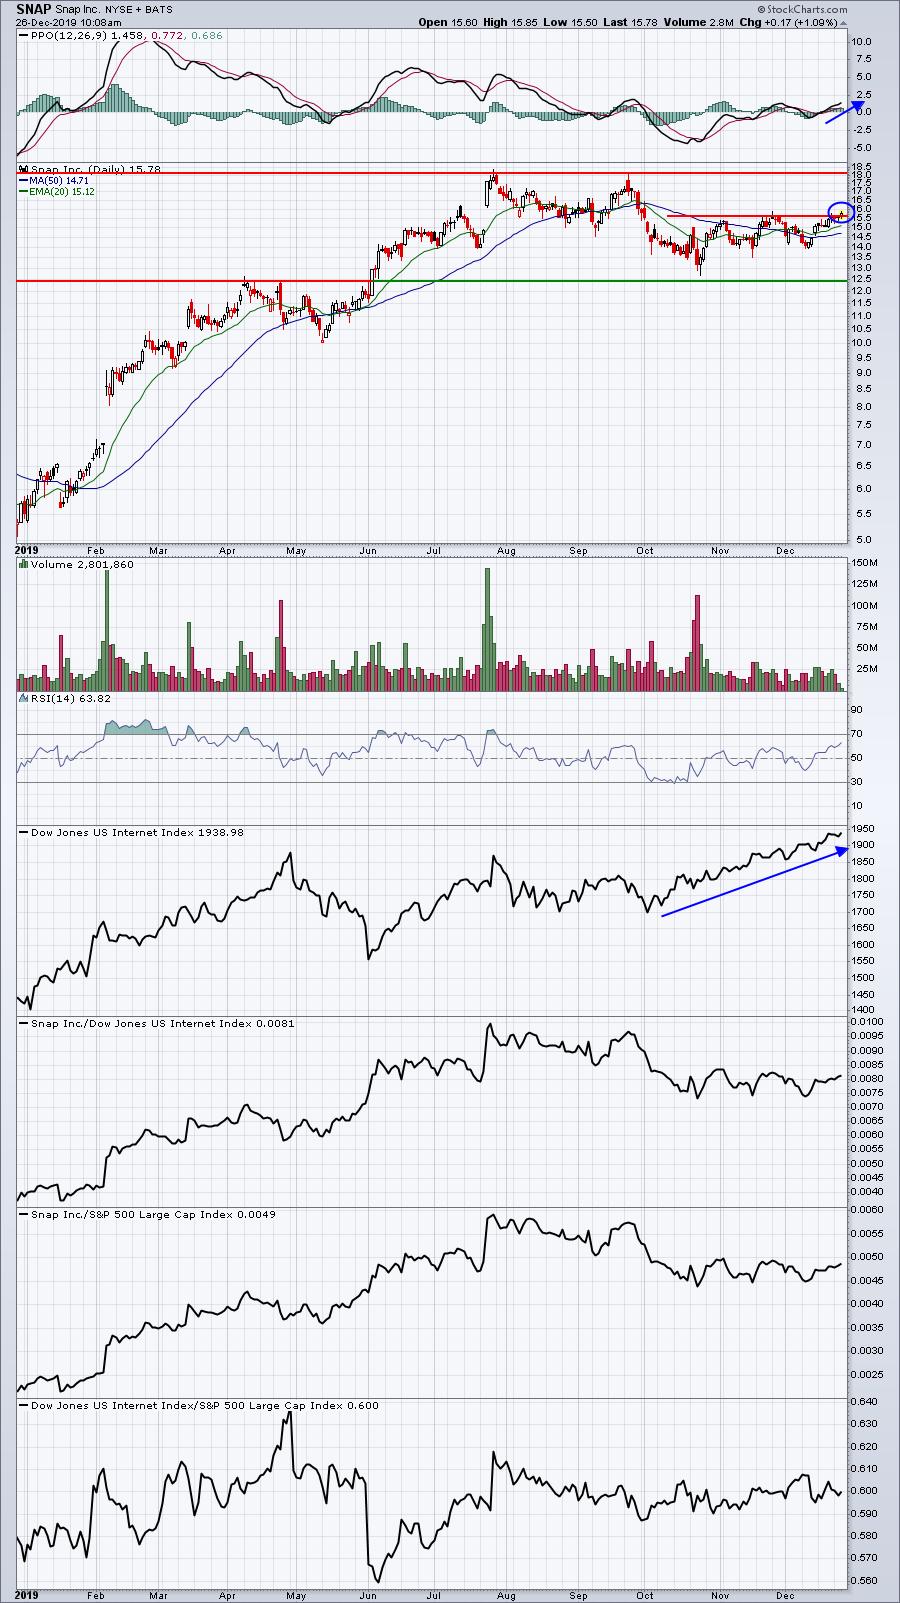
Internet stocks ($DJUSNS) are in breakout mode and SNAP is looking to follow suit. A close above 16 would likely lead to further strength and an upcoming test of resistance just above 18.
AMZN:
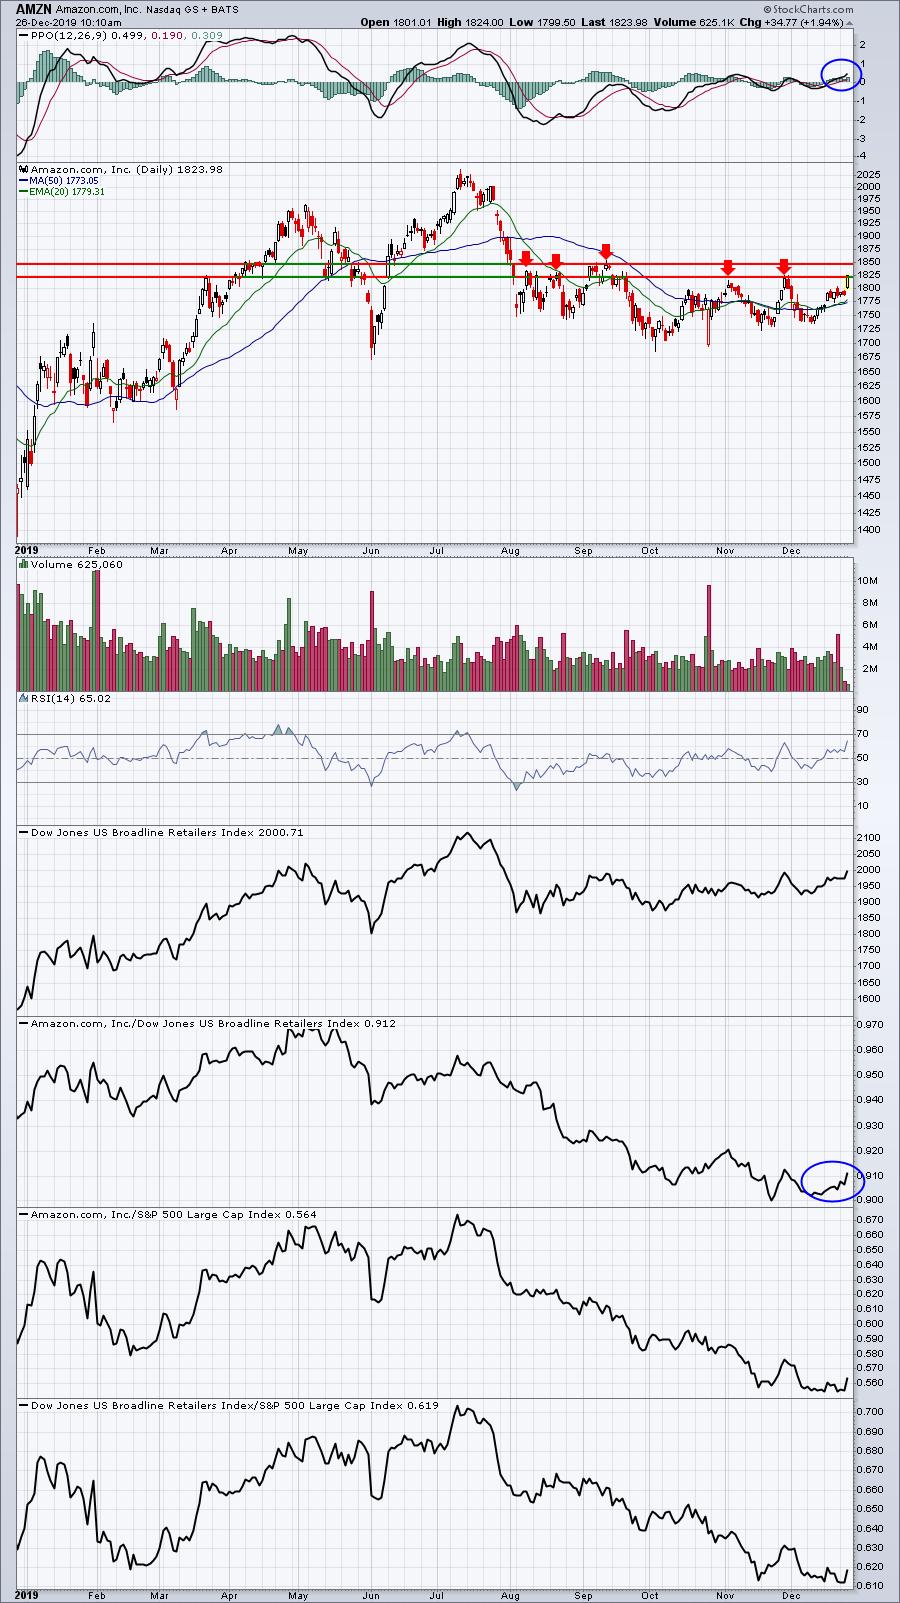
I have not been a fan of AMZN the past several months as relative weakness has taken a toll on the stock. But it's beginning to see its relative strength turn higher and its PPO is strengthening above the zero line. My only concern is all of the failures at price resistance from 1825 to 1850 over the past 5 months. Can AMZN clear resistance on volume? If so, AMZN becomes a potential trade candidate once again.
I'm providing my Daily Market Report here during the holidays, but this is what I send every day to EarningsBeats.com members throughout the year and it's only one small part of our service. If you'd like to try our service for a month, CLICK HERE to start your $7 30-day trial. As always, thanks for your support!
Earnings Reports
Here are the key earnings reports for this week, featuring stocks with market caps of more than $5 billion. I also include a few select companies with market caps below $5 billion. Finally, any portfolio stocks (or active trade alerts) that will be reporting results are highlighted in BOLD. Please make sure you check for earnings dates for any companies you own or are considering owning:
Thursday, December 26:
None
Friday, December 27:
None
Economic Reports
Initial jobless claims: 222,000 (actual) vs. 223,000 (estimate)
Happy trading!
Tom


