A common question I hear now that we've seen a significant advance in U.S. equities is, "when should I get in"? Well, we're in a secular bull market. It started in 2013 and won't end, in my opinion, until the end of this decade. Sure, we'll have corrections and maybe even a cyclical bear market or two. But I think it's a mistake to wait for a big selling episode in a raging bull market.
Instead, use market rotation to your advantage. There are a lot of great companies and they don't all follow the major indices higher every day. So start with the premise that you only want to buy companies where you can manage your risk. As a shorter-term swing trader, it means buying uptrending stocks when they undergo a period of profit taking.
Sounds good, right? But what's the best way to find those opportunities? Well, the first thing you have to do is define what a pullback means to you. For me, uptrending stocks that sell off or consolidate for awhile will see their daily RSIs dip back into the 40s. But I don't want any stock with an RSI in the 40s, I want strong stocks. That's where the SCTR (StockCharts Technical Rank) score comes into play. It's a relative strength ranking system that does a lot of the number crunching for us. Stocks are ranked among their market cap peers (large, mid, or small) based on how their price action has been vs. other stocks in their class. Much of this SCTR score is based on percentages above key moving averages, namely the 20 day EMA and 50 day EMA, and rate of change (ROC) - both the 125 day ROC and 20 day ROC. Those four percentages account for 90% of the SCTR score. From that, it's fairly easy to see that it's a momentum ranking system. I'm a momentum trader. Perfect!
Now it's time to run our scan. Let the StockCharts.com scan engine do all the work for you. The following is a simple scan to find momentum stocks (SCTRs above 90) that have pulled back (RSIs below 50). Here's the code:
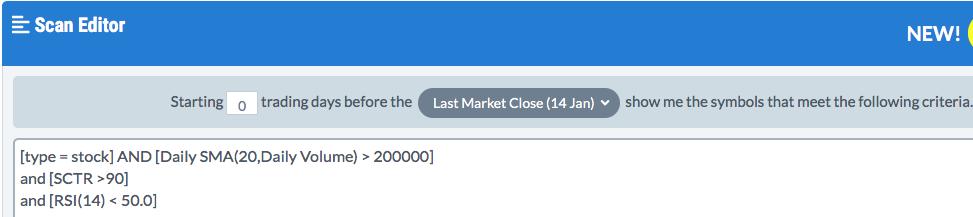
I added a volume filter of 200,000 average shares traded to make sure the stocks returned meet my liquidity requirements. I had 49 matching results. Here were a few to give you an idea of what I'd look for:
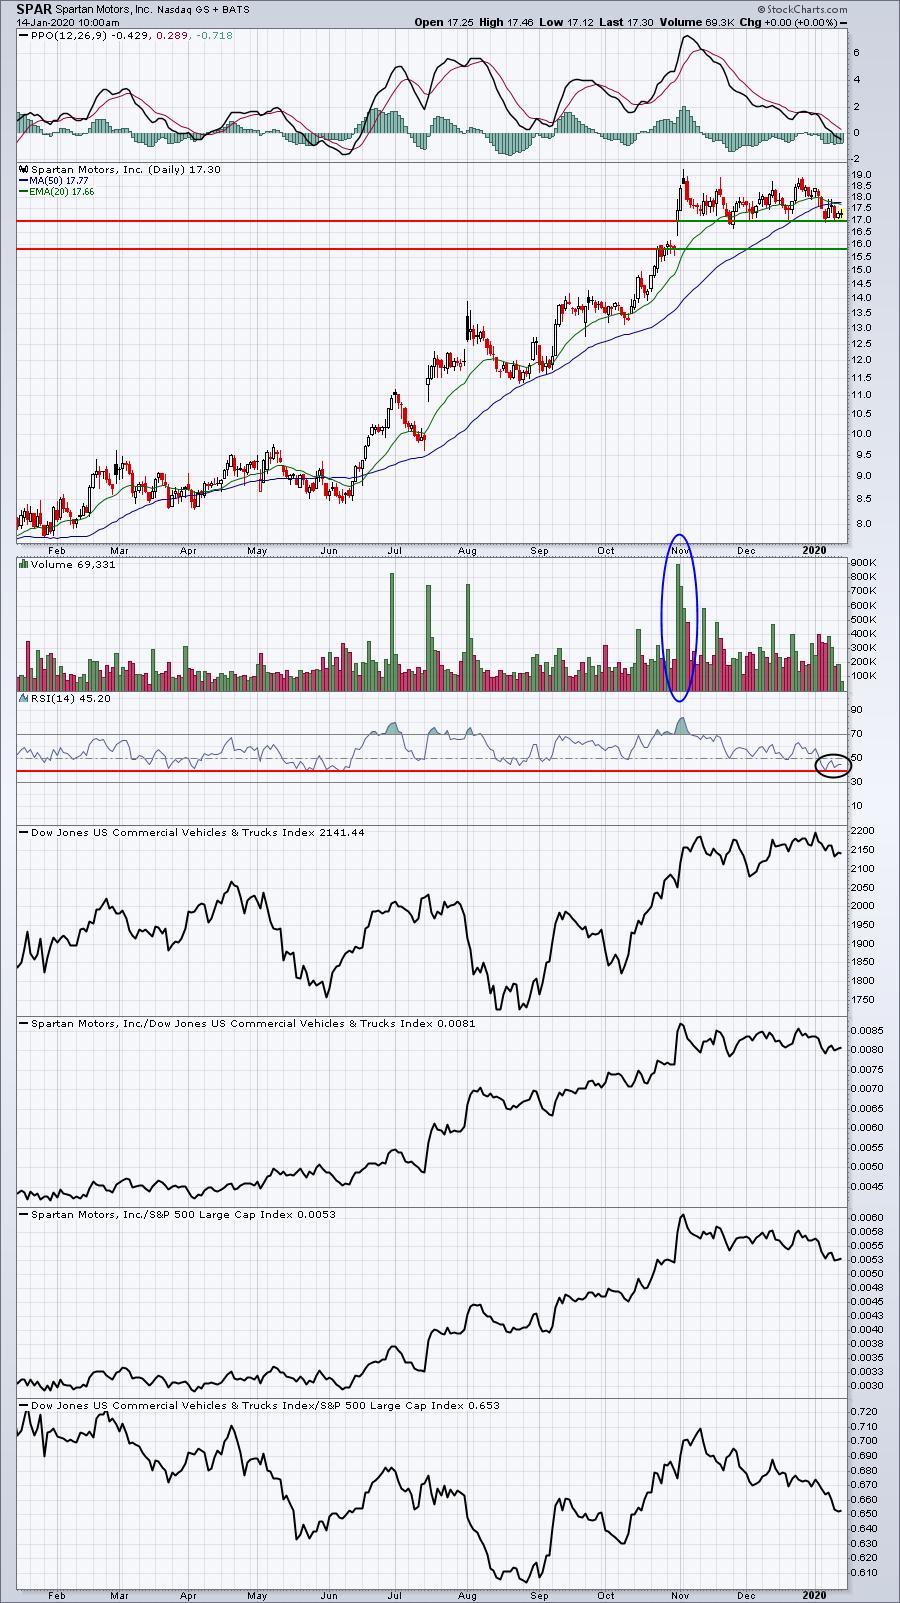
SPAR:
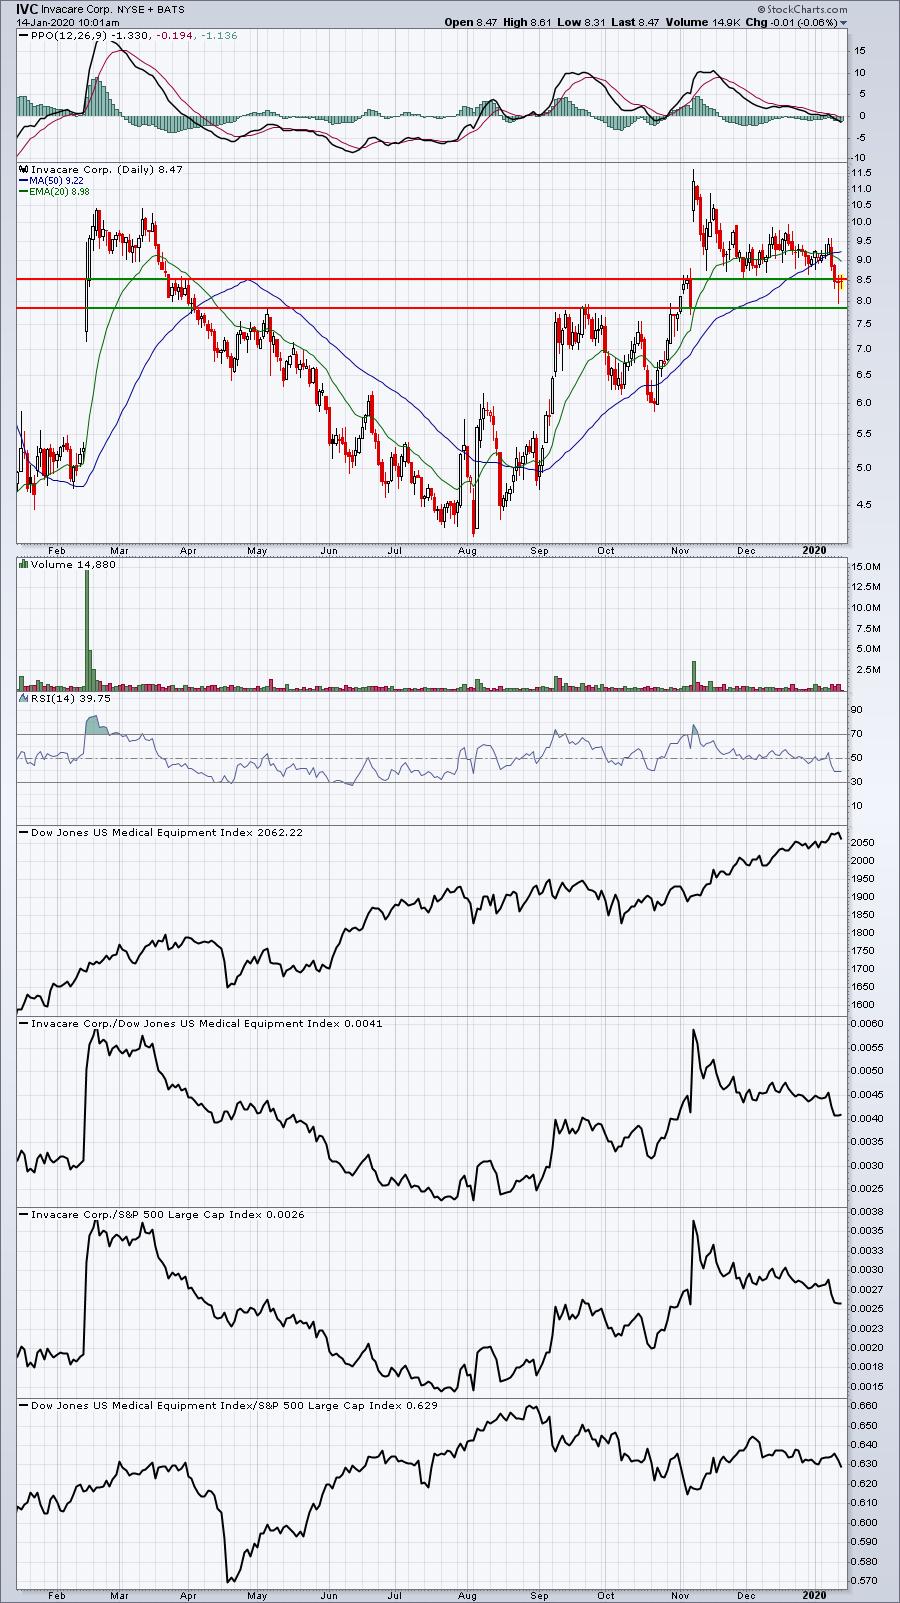
IVC:
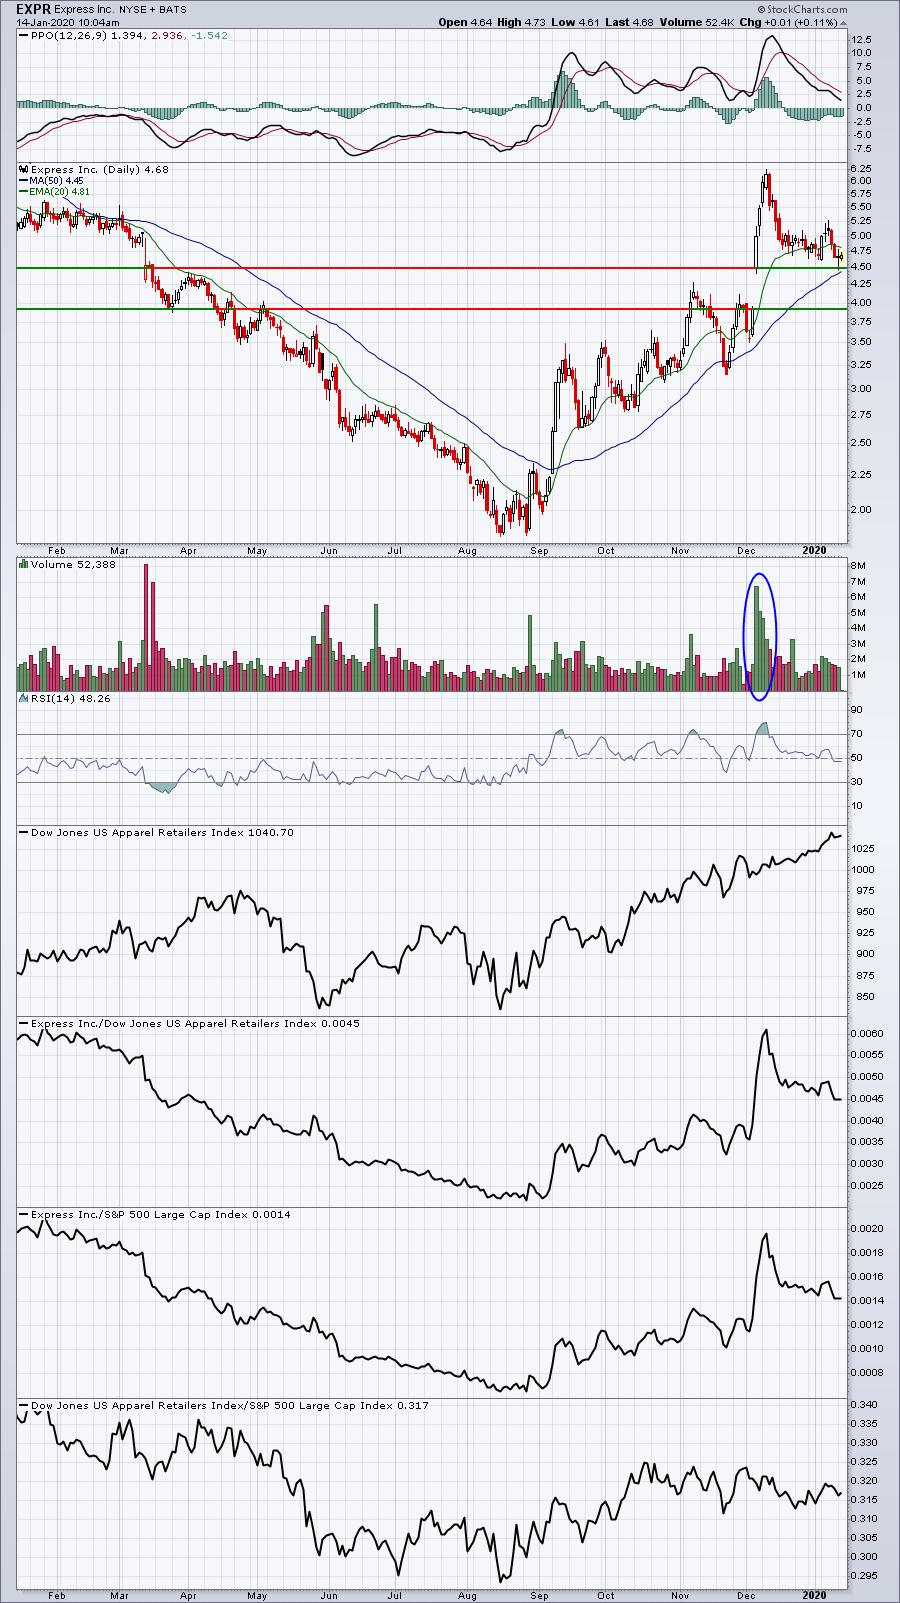
EXPR:
EVER:
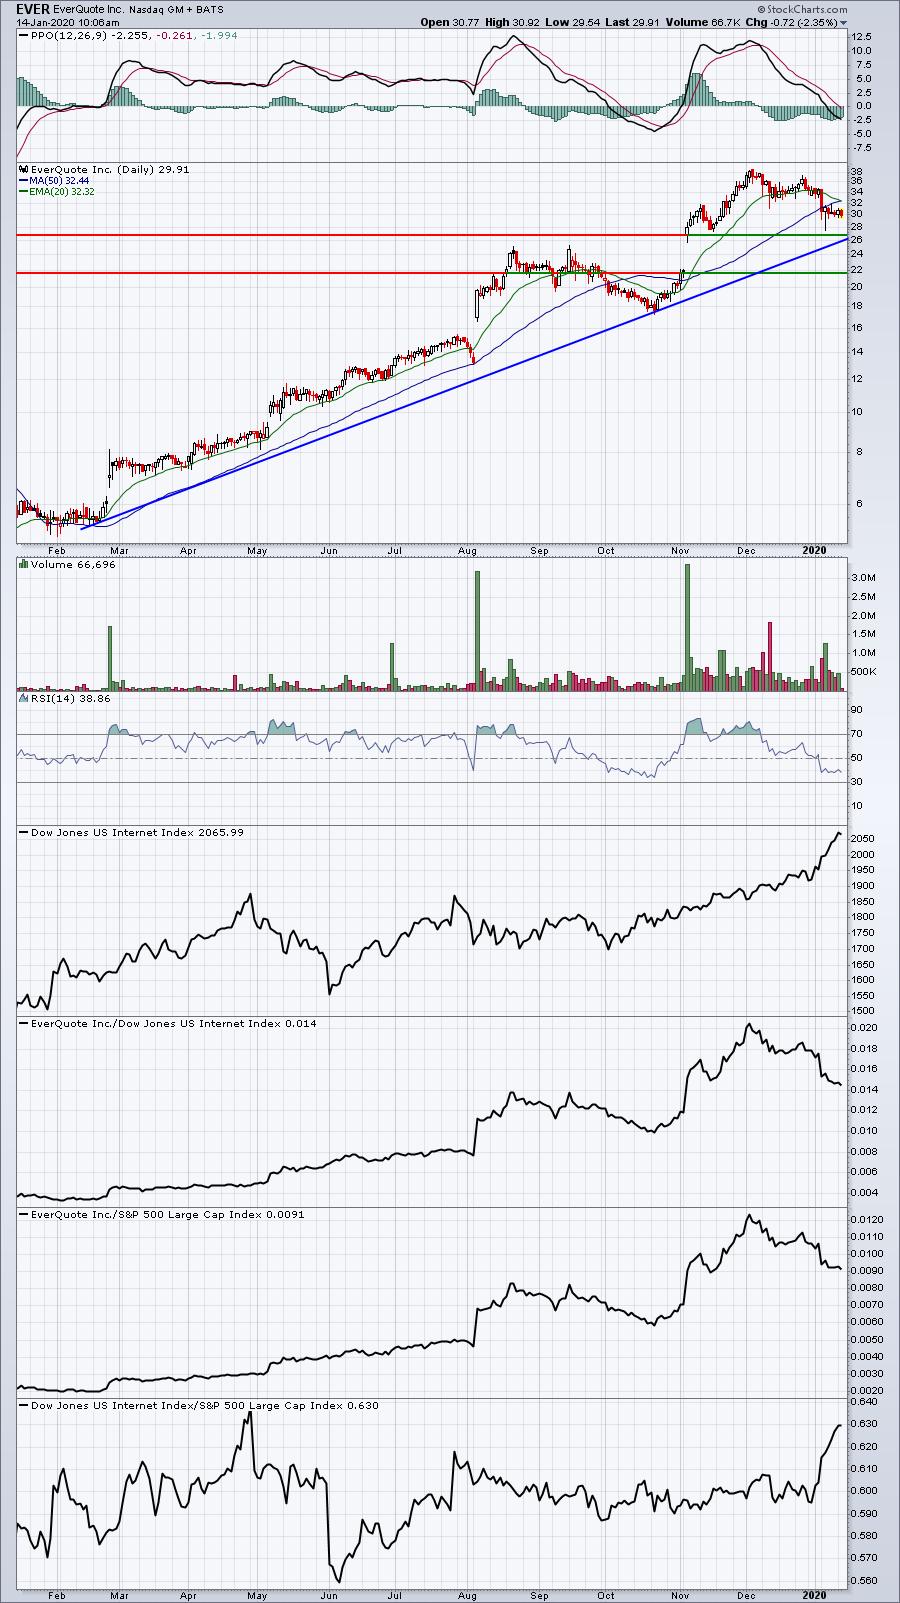
These are all companies that were recent leaders, but now are pulling back in basing patterns, while remaining in overall uptrends in my view.
Because I no longer post Trading Places blog articles on a consistent daily basis, it would likely be helpful to subscribe to my blog so that an email is sent to you immediately upon the publishing of a Trading Places blog article. Simply scroll down, type in your email address and click the SUBSCRIBE button!
Happy trading!
Tom


