Special Event
Below is a sample of the Daily Market Report that I sent to EarningsBeats.com members this afternoon.
Also, I'd like to extend an invite to everyone to join me at 4:30pm EST today as I will host our "Sneak Preview - Q4 Earnings" event. It's open to the public, but I'd love to have you join the EarningsBeats.com community by signing up for our 3x per week free newsletter, EB Digest. You can SIGN UP here.
You should be able to access the webinar using the following link. The room will open by 4:00pm EST and will start promptly at 4:30pm EST:
I hope to see you there! If you can't make it or have to leave early, no worries. We record all of our webinars and you'll be able to access the recording later this evening or tomorrow if you're part of our community.
Executive Market Summary
- There was plenty of negative headlines to open the week, including a HUGE selloff in Hong Kong ($HSI, -2.81%)
- Also, a world health threat could be emerging as China's coronavirus has already killed several people and the CDC just announced the first case in the U.S.
- Netflix (NFLX) will be the first FAANG stock to report its earnings after the bell today
- Our major indices opened lower, rallied to move into positive territory, but now are rolling over a bit
- Two defensive groups, real estate (XLRE) and utilities (XLU), are the leading sectors
- Energy (XLE) is down more than 1%, again the primary laggard; crude oil ($WTIC) has reversed off of early losses, however, and is currently up 0.20%
- Our only active trade alert VC was upgraded, traded much higher early, but has now moved into negative territory
Market Outlook
The U.S. Dollar Index ($USD) has rallied in January, but based on the falling spread between the U.S. 10 year treasury yield ($UST10Y) and the German 10 year treasury yield ($DET10Y), I look for the dollar to roll back over. The following chart illustrates the relationship:
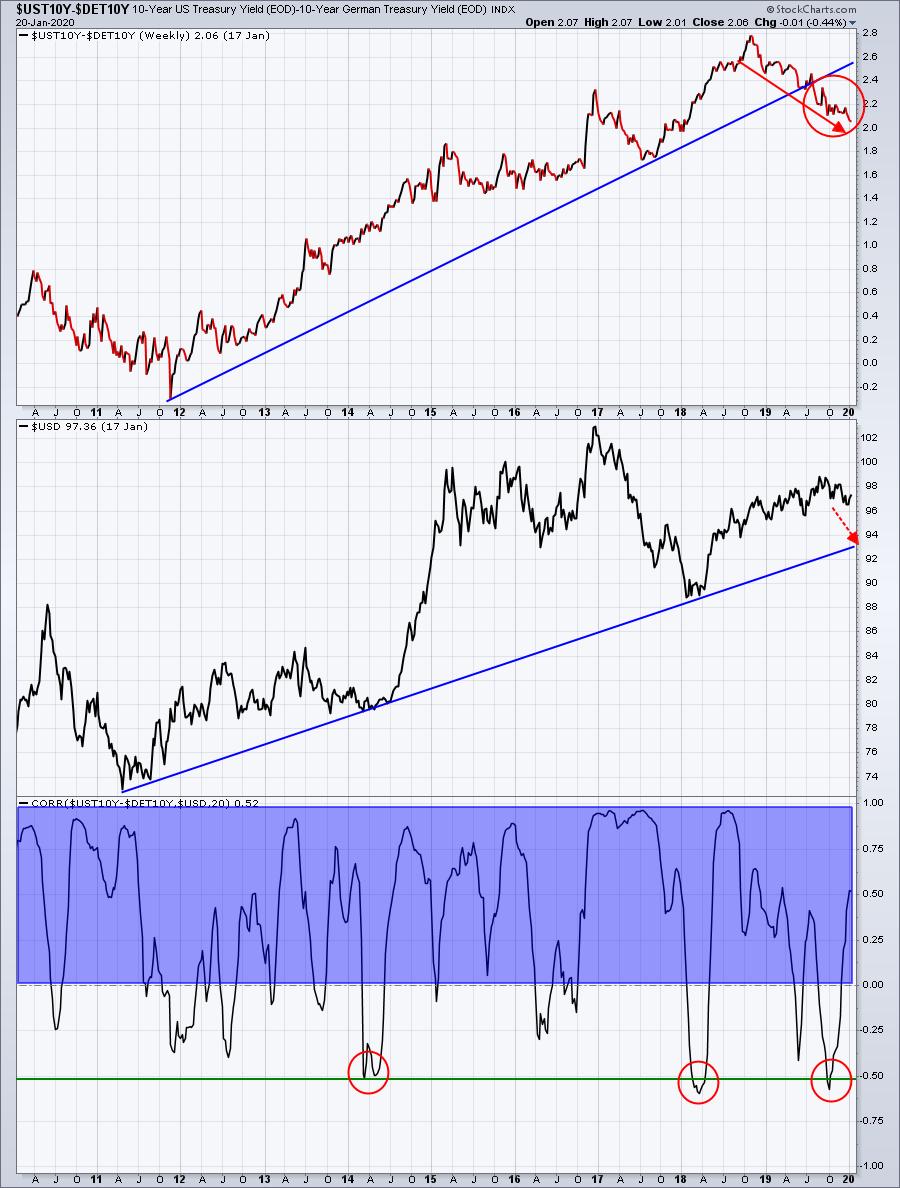
The blue-shaded area highlights the mostly positive correlation between the direction of the yield spread between the U.S. and Germany and the direction of the USD. The top panel shows German yields gaining ground faster than U.S. yields and that tells me we'll likely see more dollar weakness.
Sector/Industry Focus
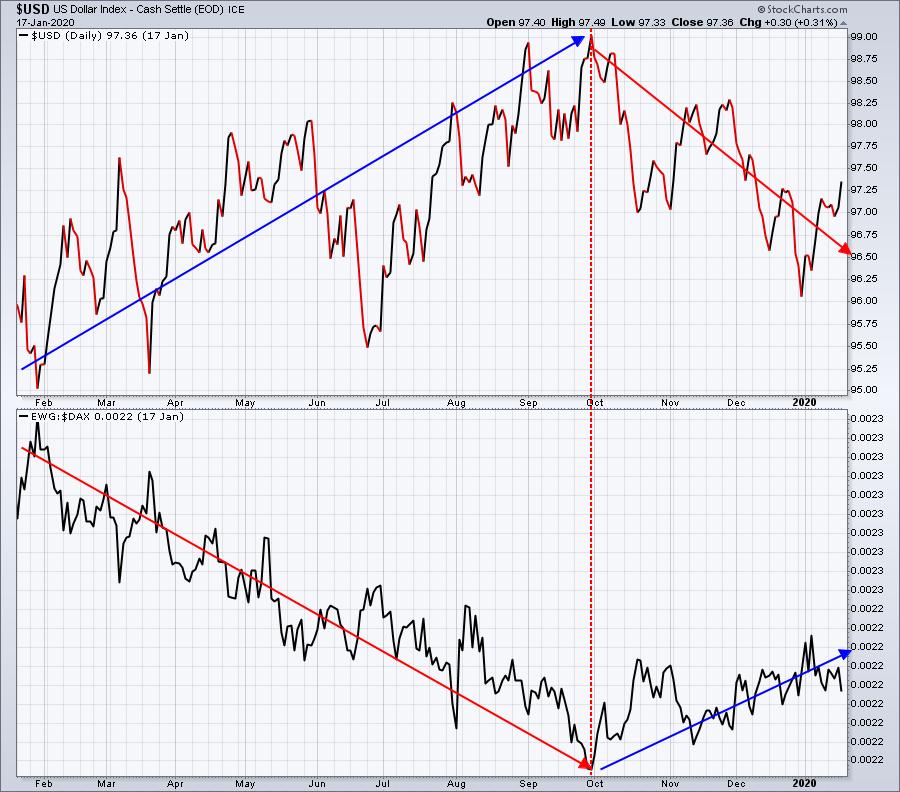
Should the U.S. Dollar Index fall as the chart above would suggest, trading an international ETF like the German iShaares (EWG) would make sense given the breakout to all-time highs on the German DAX ($DAX). The EWG is sensitive to dollar strength and weakness, outperforming the underlying German DAX when the dollar weakens. Here's a chart to illustrate:
If I'm right about the USD retreating for awhile, that would benefit the EWG no doubt. But then there's the question about whether the German DAX will outperform the S&P 500. While that's a more difficult question to answer, I believe the rising DET10Y vs. the UST10Y is suggesting that economic improvement in Germany may surpass what we see here in the U.S.
Furthermore, check out the breakout last week in the DAX, which closed at an all-time weekly high:
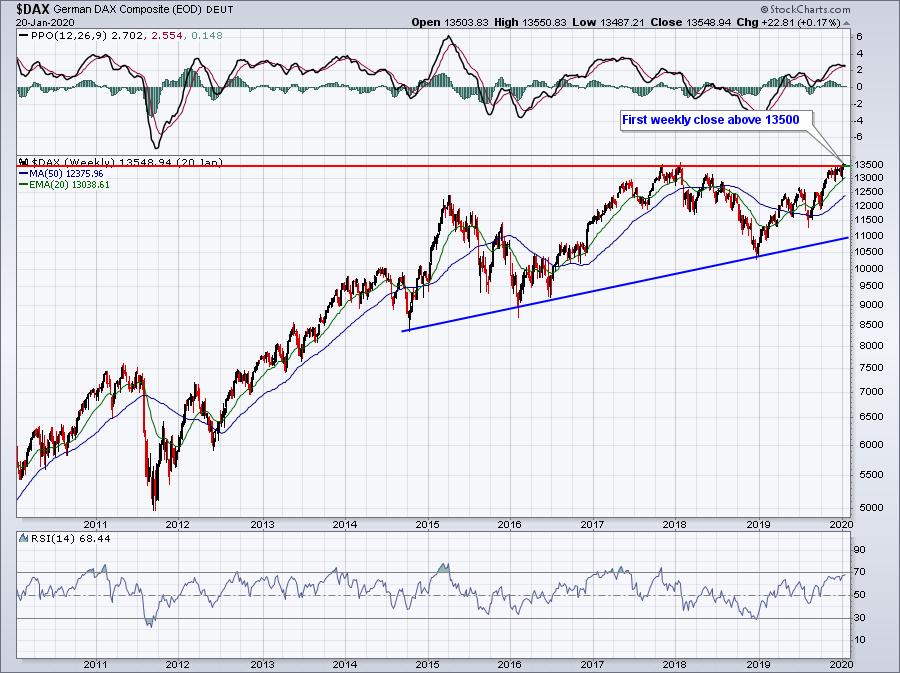
I could see a melt up on the DAX that would carry it initially to the 15000 level. The EWG will outperform that DAX move if the dollar falls simultaneously.
Active Trade Alerts
We have just one active alert right now:
VC (-0.25%) - reports earnings on February 19. VC shot higher out of the gate today, but is now fractionally lower. VC was upgraded this morning and promptly surged above 94. We're still looking for a confirmed close above the 50 day SMA, currently at 90.52.
Strong Earnings ChartList (SECL)
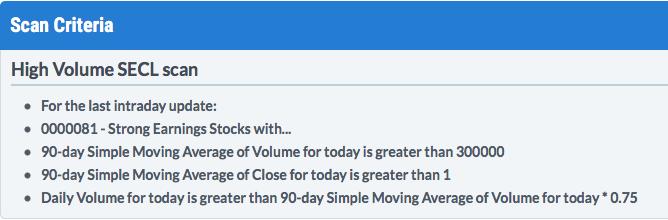
I ran a high volume scan, searching for SECL stocks that are trading higher than their normal level of shares (75% of normal volume or above already traded by 12:55pm EST). Here was the scan criteria I used:
Here were the stocks returned from the SECL (sorted by highest SCTR to lowest):
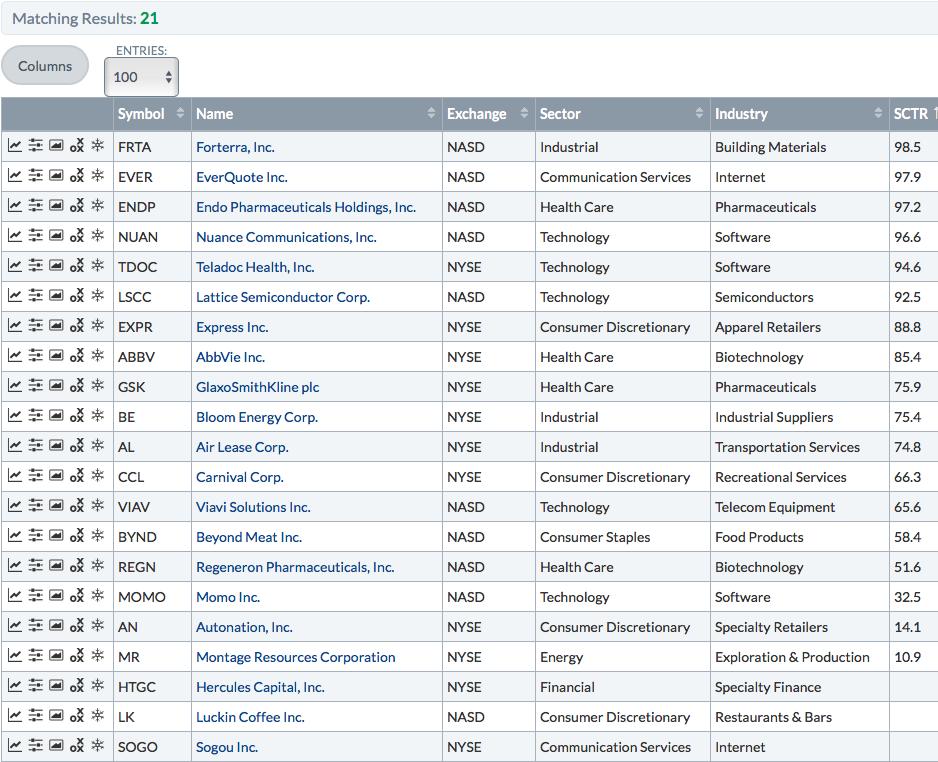
Many of these companies are exploding higher, but here are the charts I found most appealing:
LSCC:
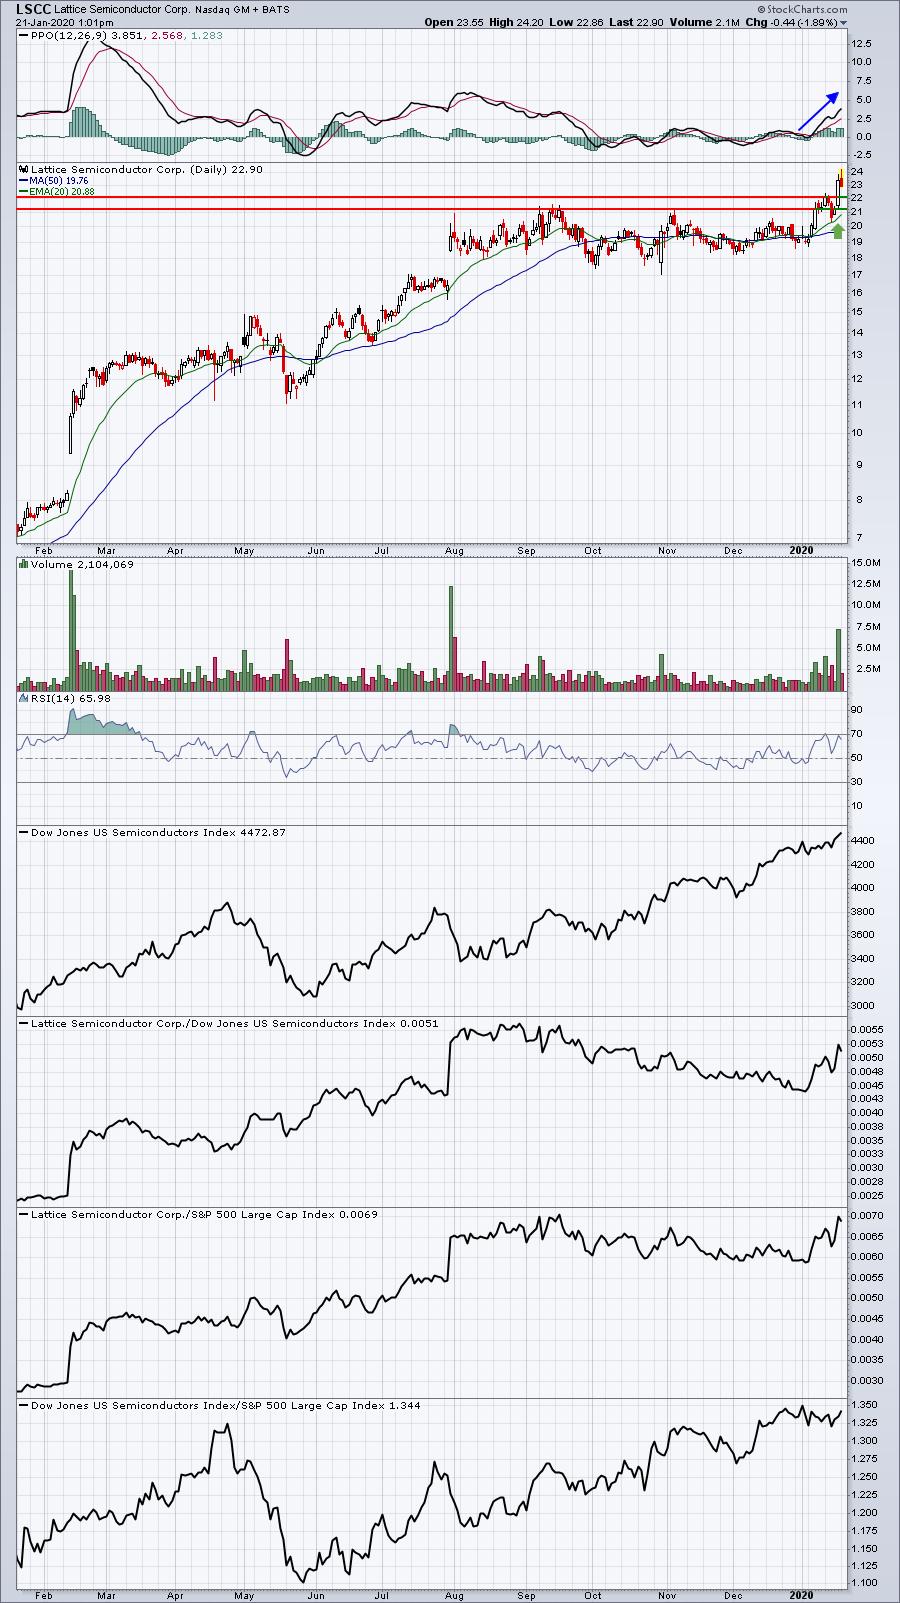
LSCC finally broke out recently after a lengthy consolidation. I believe it will continue to rally into its earnings, so a pullback to challenge price support and the rising 20 day EMA would seem an opportune time for entry.
EXPR:
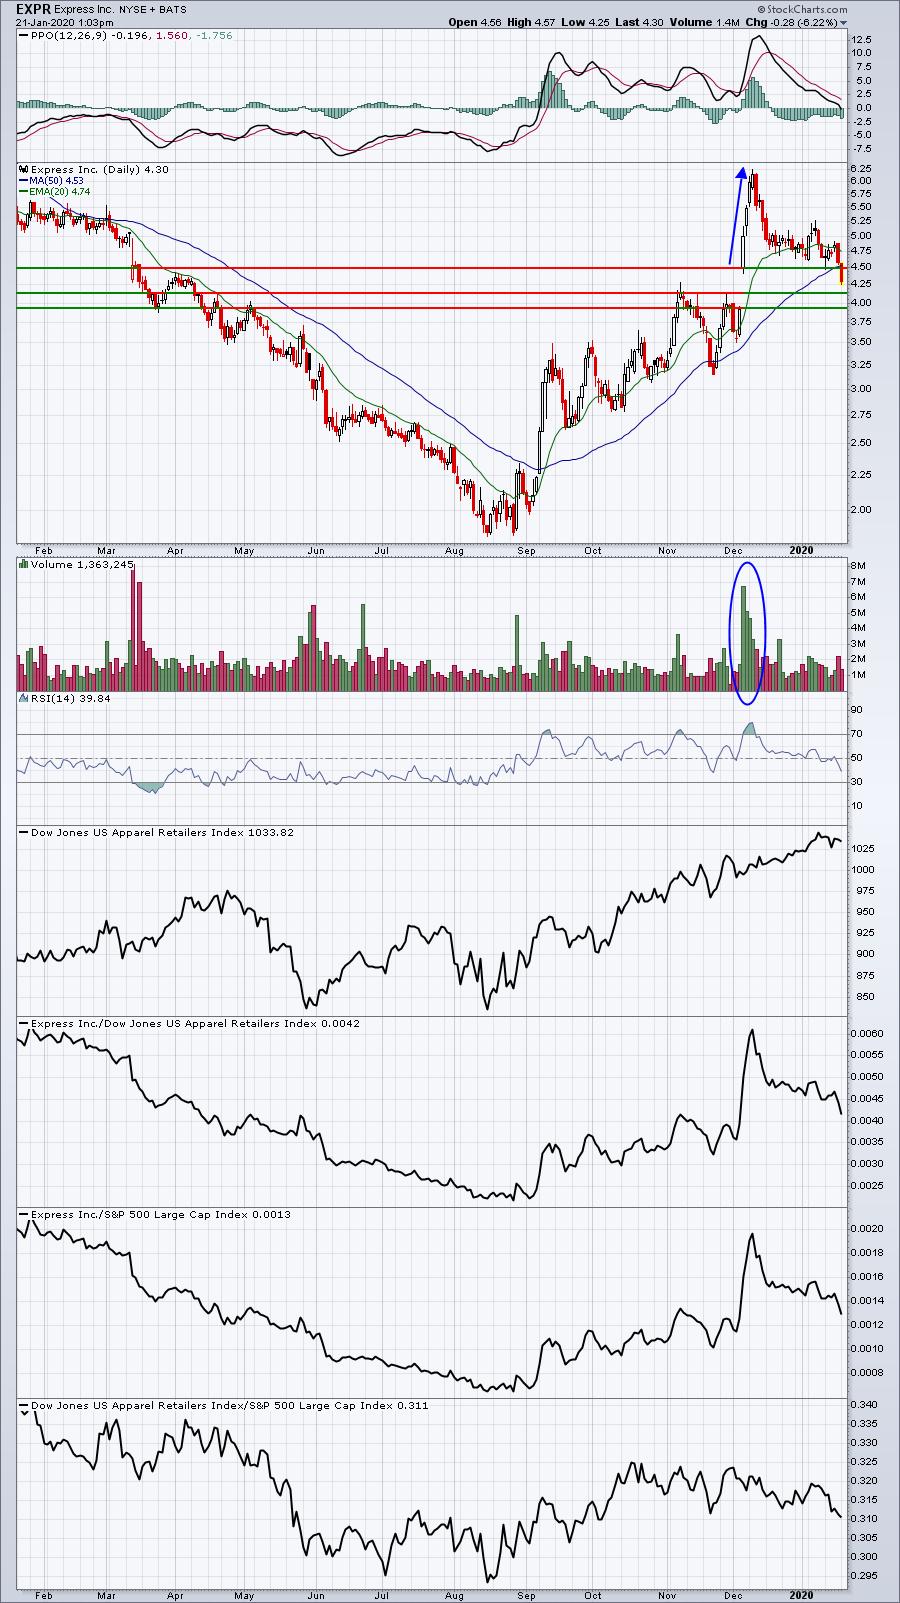
EXPR soared recently on excellent volume. This downtrend and break below the top of gap support could be a ploy by market makers to accumulate shares. I've drawn the three key lines of support that I'd watch. A reversing candle (perhaps a hammer?) at or near these levels might be worth a trade for an aggressive trader.
ABBV:
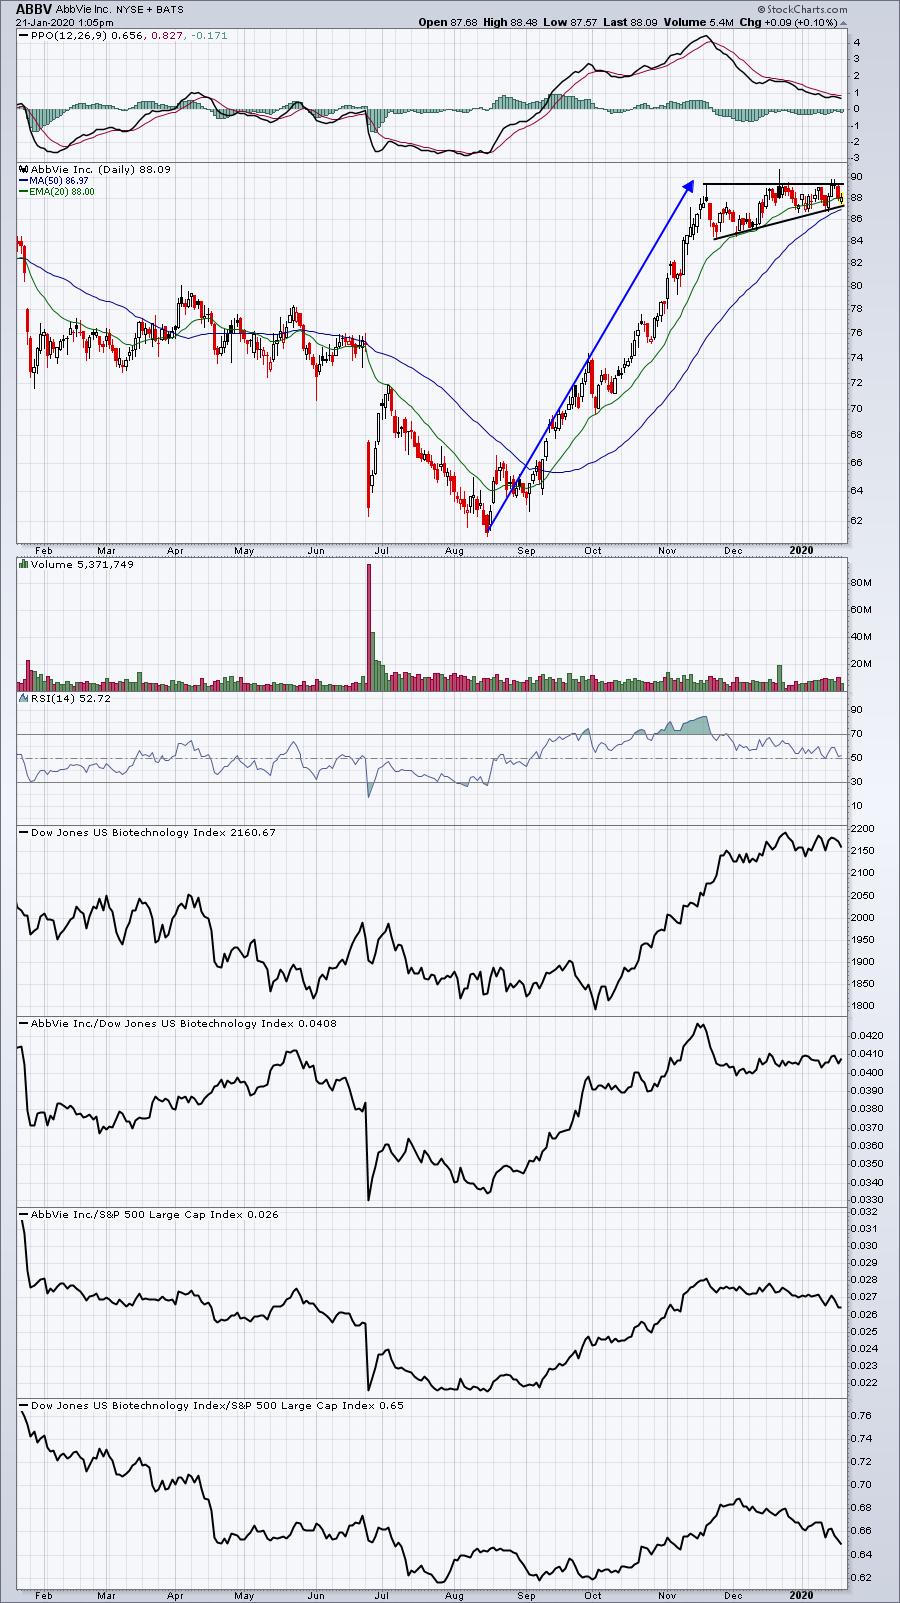
This is nice looking pattern (ascending triangle) that I'd expect to see breakout to the upside. Volume is heavier today, but the stock is relatively flat. Watch for the breakout, which would initially measure to 95 or so, although I expect to see ABBV trend much higher over time.
REGN:
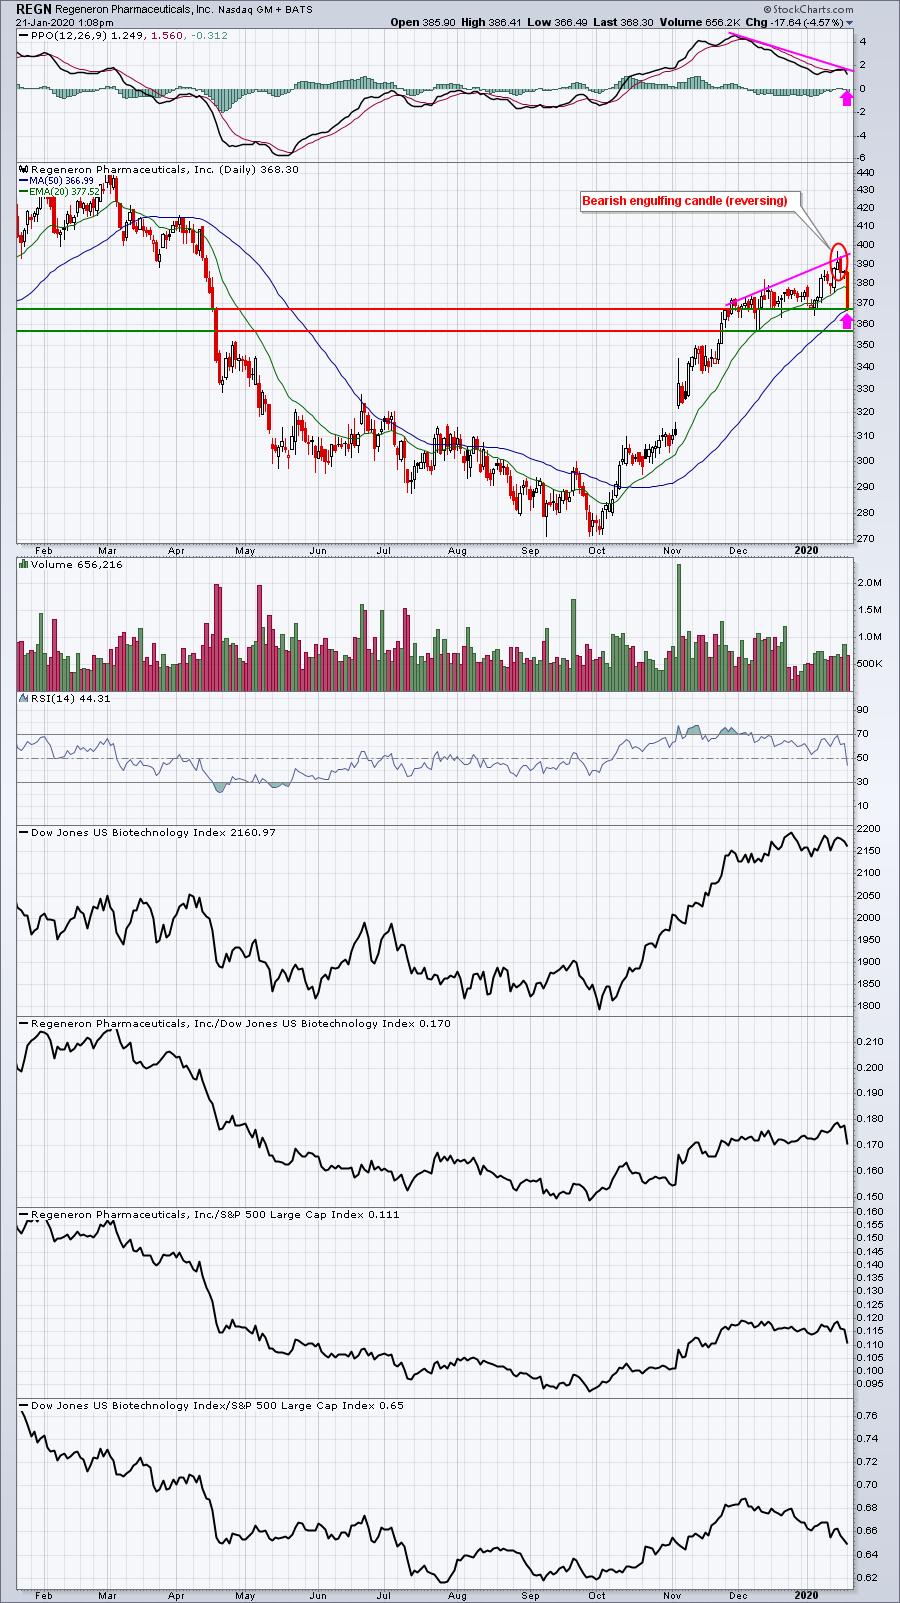
REGN printed a fairly significant short-term top with that bearish engulfing candle last Thursday. We've seen a quick trip back to test the 50 day SMA, which is exactly what I look for after a negative divergence and reversing candle print. I would look for REGN to find a short-term bottom from current price down to the December low just below 360.
EVER:
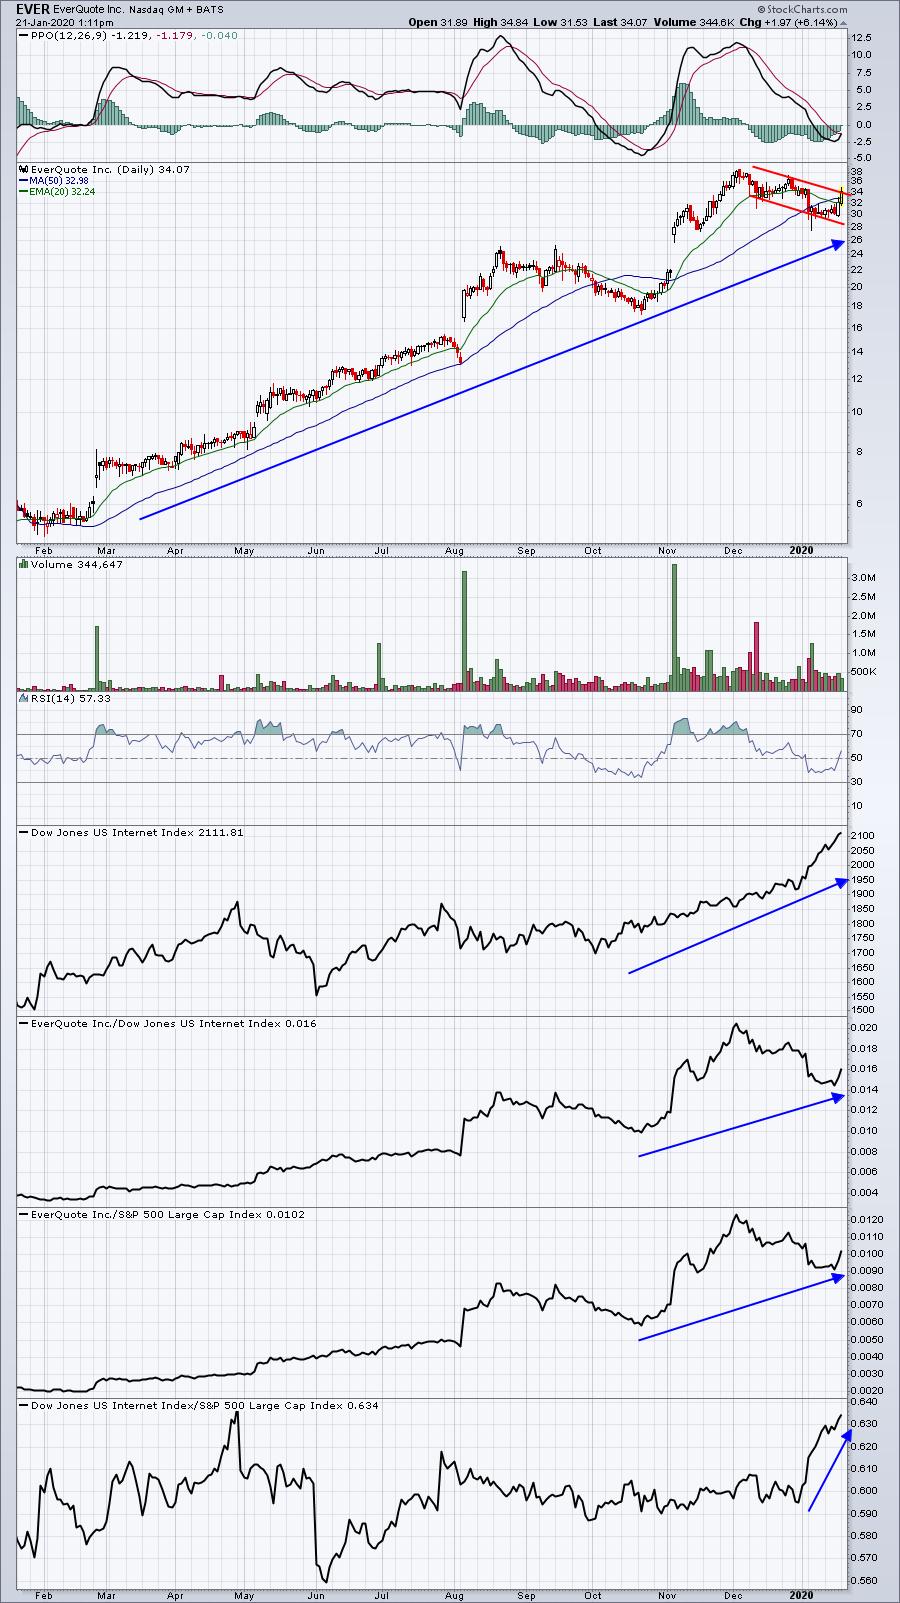
EVER has been somewhat frustrating because it's been consolidating, but that could be changing here. I'm watching the recent down channel to see if it breaks. Volume is beginning to pick up a little here and this could be the start of a pre-earnings rally higher. EVER carries a lot of risk, but it's part of a red-hot internet space ($DJUSNS), so the return could be very solid. You just have to decide if this type of stock, one that can be up or down 20% in the matter of a couple days or weeks, is the type of stock that you're comfortable owning.
Movers & Shakers
Costco (COST) received an upgrade this morning and is making a very bullish breakout as follows:
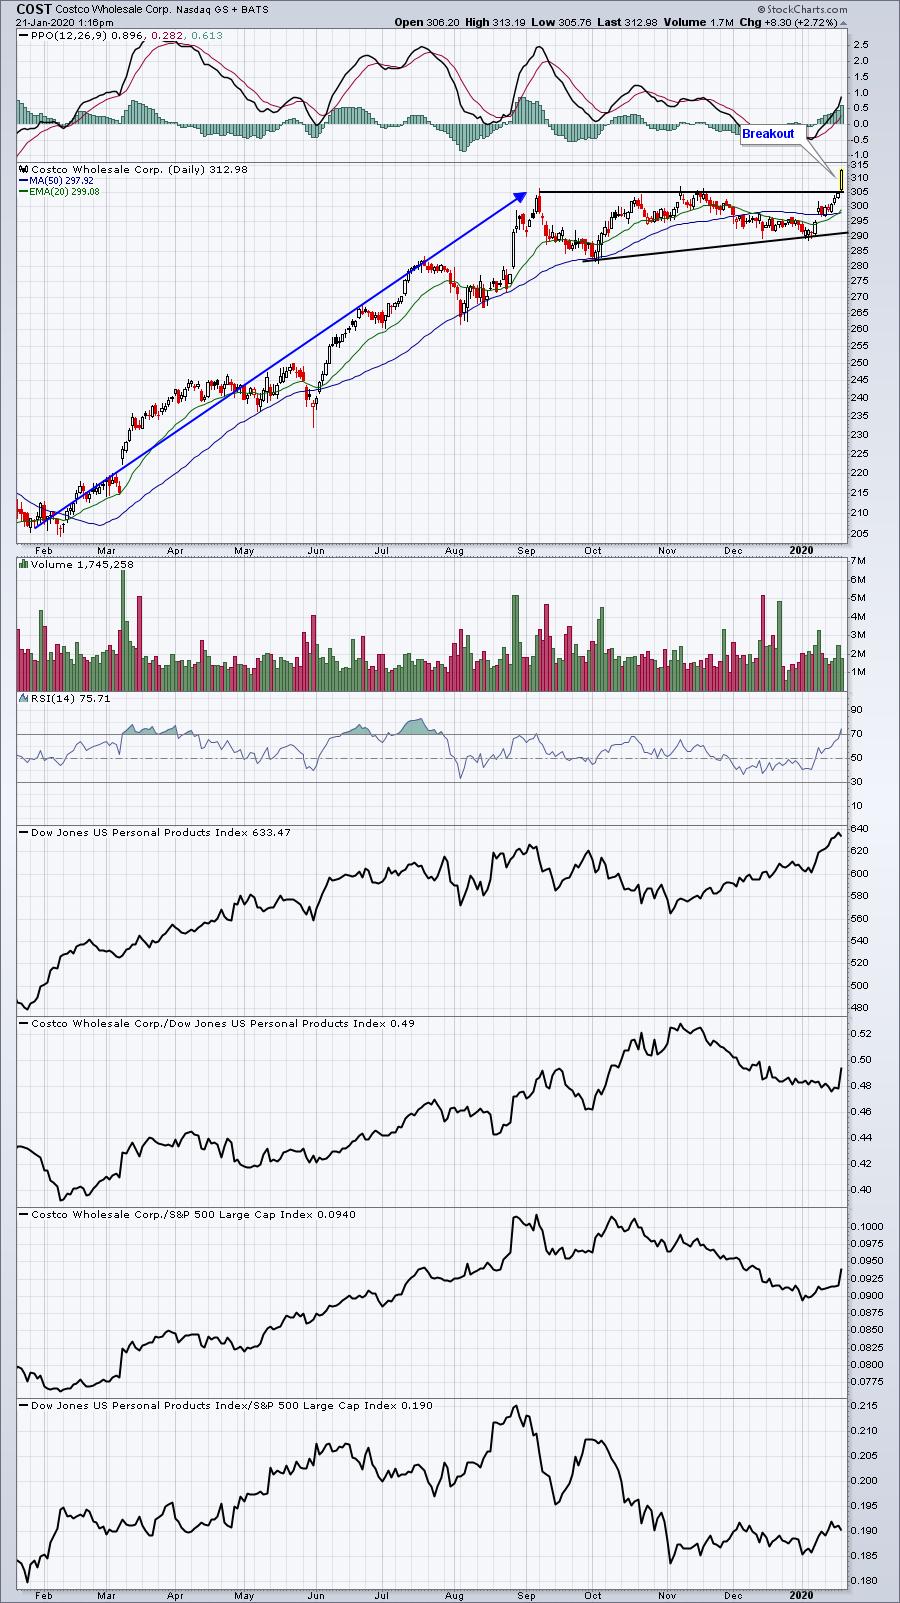
I love this pattern and today's high volume breakout. The initial measurement will be close to 330, but there's nothing to say that COST can't come back down one more time first to test its rising 20 day EMA, currently at 299, and the breakout level of 305. The reward to risk at those levels would be great.
Earnings Reports
Here are the key earnings reports for this week, featuring stocks with market caps of more than $10 billion. I also include a few select companies with market caps below $10 billion. Finally, any portfolio stocks (or active trade alerts) that will be reporting results are highlighted in BOLD. Please make sure you check for earnings dates for any companies you own or are considering owning:
Tuesday, January 21:
NFLX, COF, AMTD, UAL, HAL. Others less than $10 bil: CMA, ZION
Wednesday, January 22:
JNJ, ABT, ASML, TXN, PLD, KMI, APH, RCI, BKR, NTRS, FITB, CTXS, TDY, RJF, TER, ALLY. Others less than $10 bil: SLG, STLD, SLM
Thursday, January 23:
PG, INTC, CMCSA, UNP, ISRG, KMB, VFC, TRV, LUV, DFS, STM, MTB, SWKS, KEY, FCX, TEAM, HBAN, SIVB, AAL, ETFC. Others less than $10 bil: JBLU, AVT, AVX, HTH
Friday, January 24:
NEE, AXP, APD, ERIC, SYF. Others less than $10 bil: HRC, SNV
Economic Reports
None
Happy trading!
Tom


