Trying to call bottoms is a difficult exercise, but human behavior can be quite predictable. Long-term investors are definitely long-term....as long as the market goes higher. But when we see the type of selling and panic that we've experienced these past few weeks, even the most disciplined investors are challenged to stay the course. I've had discussions with many "long-term" investors over the past few days and they're bailing or at least considering it. Why? Because they can't take the emotional and financial pain. I get it. When all you see are headlines that tells us that doom and gloom are here to stay, it affects your psyche. It wears us down. Then stress and anxiety take over and we react to the emotions. We just want the pain to end.
From a stock market perspective, thankfully we don't see these panicked periods very often - not like the period we have at hand. In fact, yesterday the Volatility Index ($VIX) closed at 75.47, the 4th highest reading since the VIX has been tracked. Here are the top 5 readings this century:
November 20, 2008: 80.86
October 27, 2008: 80.06
October 24, 2008: 79.13
March 12, 2020: 75.47
November 19, 2008: 74.76
This panicked selloff is reaching the heights of the financial crisis, which I honestly didn't think I'd ever see again in my lifetime. Part of the fear is certainly justified as we know the coronavirus has seriously impacted parts of our economy, particularly areas involving travel and recreation. Tumbling crude oil ($WTIC) is making many question a possible credit crunch. Throw in the huge drop in treasury yields and the havoc that plays with financial companies, particularly banks ($DJUSBK) and life insurance ($DJUSIL), and we could see a hesitancy to lend. So there's plenty to worry about, but the depth of the eventual economic realities simply cannot be predicted. The stock market, however, tends to heavily discount prices using a worst-case scenario, which is why extreme VIX readings and extreme equity only put call ratios ($CPCE) tend to coincide with MAJOR stock market bottoms.
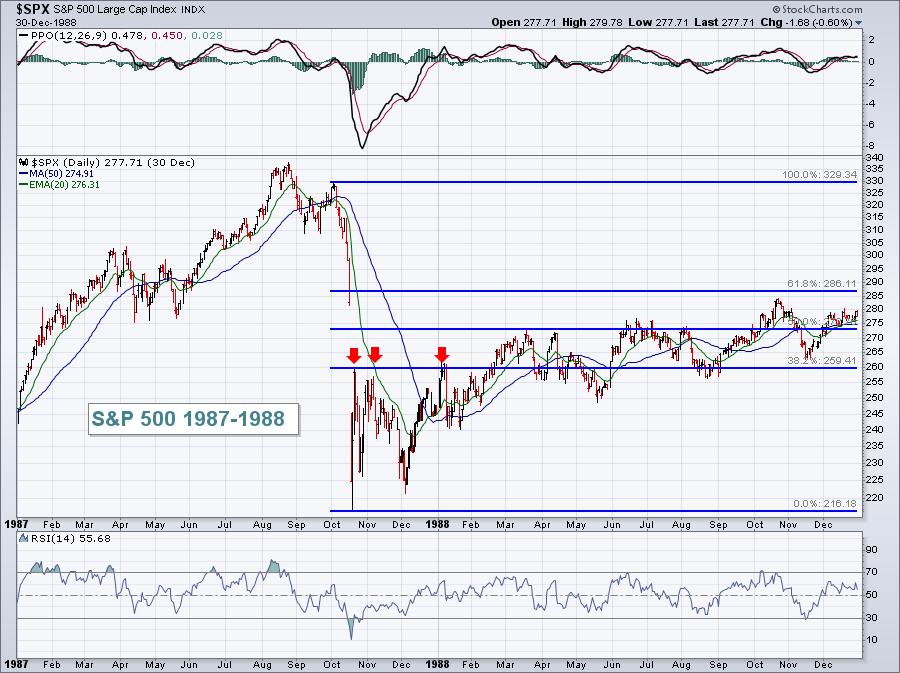
Personally, I believe the sudden fear in an otherwise healthy bull market looks a lot like the 1987 stock market crash. We were firmly emerged in a secular bull market advance when the 1987 crash hit. Yesterday's percentage losses were the worst since Black Monday in October 1987. Let's first look at the S&P 500 in 1987 followed by 2020 to see the similarities:
1987:
2020:
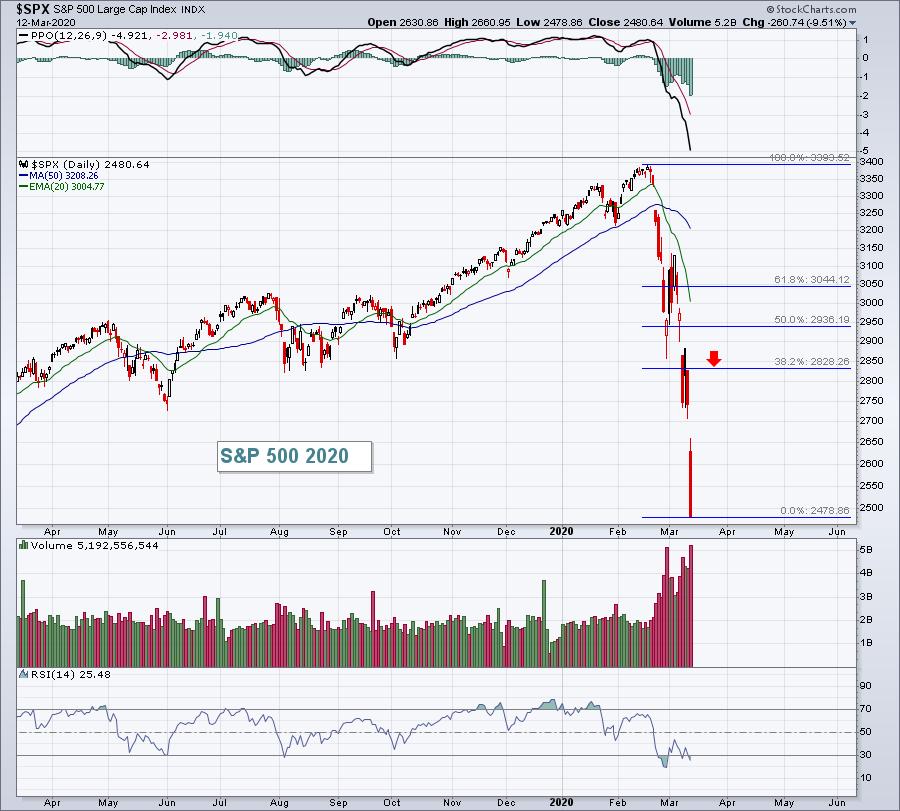
Based on that 1987 meltdown, the Fibonacci retracement zone at 38.2% was a difficult one to initially pierce. That would mean that we should keep a close eye on the 2828 level, if we can rally that far. A reversal there would have historical precedence.
It's been a rough few weeks, so I'm hosting an EarningsBeats.com community gathering today at 1pm EST to discuss what's transpired and what likely lies ahead. We will be sending out room instructions to members later this morning. If you'd like to join us, and are not currently a member, you can CLICK HERE for a refundable $7 30-day trial.
Happy trading!
Tom


