Enjoying the ride? I've made a conscious decision to sit this wild ride out. I write a Daily Market Report (DMR) to our EarningsBeats.com members every day and last Tuesday (February 25th), I wrote the following (an excerpt):
"I'm bullish. I've remained bullish throughout many short-term corrections. But that doesn't mean that I will completely ignore the environment around me. The VIX is gaining steam to the upside and when the VIX is high, we MUST remain on high alert for impulsive bouts of selling that are not rational. How do you prepare for that? Well, from my perspective, I'm a short-term trader. Cash is king and the preservation of cash is extremely important. I don't like making emotional trades. So I've made the decision to cut down the number and size of my trades considerably and I do not plan on being an active trader in the very near-term - at least until the dust settles.
I'd rather miss a reversal and some upside than to hold during a big decline. Honestly, I don't know how anyone, with any precision, can call market movements in periods like this. So I'd rather be on the sidelines, or mostly on the sidelines. I have not changed my bullish stance on the market, nor on the big picture environment, which still includes strong earnings growth, low inflation, lower interest rates ahead, etc. I wouldn't change my strategy if I was a "buy and hold" type investor. I believe this will pass in time. But having a long-term mentality as a short-term trader can prove devastating during very brief periods and I'd rather avoid that possibility. Here's a chart of the VIX:"
I believe that was a rather astute "state of the market" comment. I've been around the market for a long, long time and I know when it's time to sit out. The past couple weeks has definitely been a time to sit out. We don't know what we're going to wake up to and the intraday moves are fast and furious. During periods like this, the stock market is irrational and technical analysis really doesn't work. MAJOR support levels are lost without even a pause. Market makers go on "vacation". They're like matadors as prices come tumbling toward them. They don't provide liquidity in the same manner they do during rational markets and the reason is simple. Fear leads to irrational behavior and panicked selling. Market makers know what happens when fear is at current levels. Volume accelerates and the proverbial kitchen sink is thrown in. They wait to buy the kitchen sink.
Extreme readings in the Volatility Index ($VIX) mark major stock market lows and support levels. Let's review a few of those extremely fearful readings and study the price action. Why not start with the biggest extreme of all - the 2008 financial crisis? It's the only time in history where we've seen the VIX hit 90:
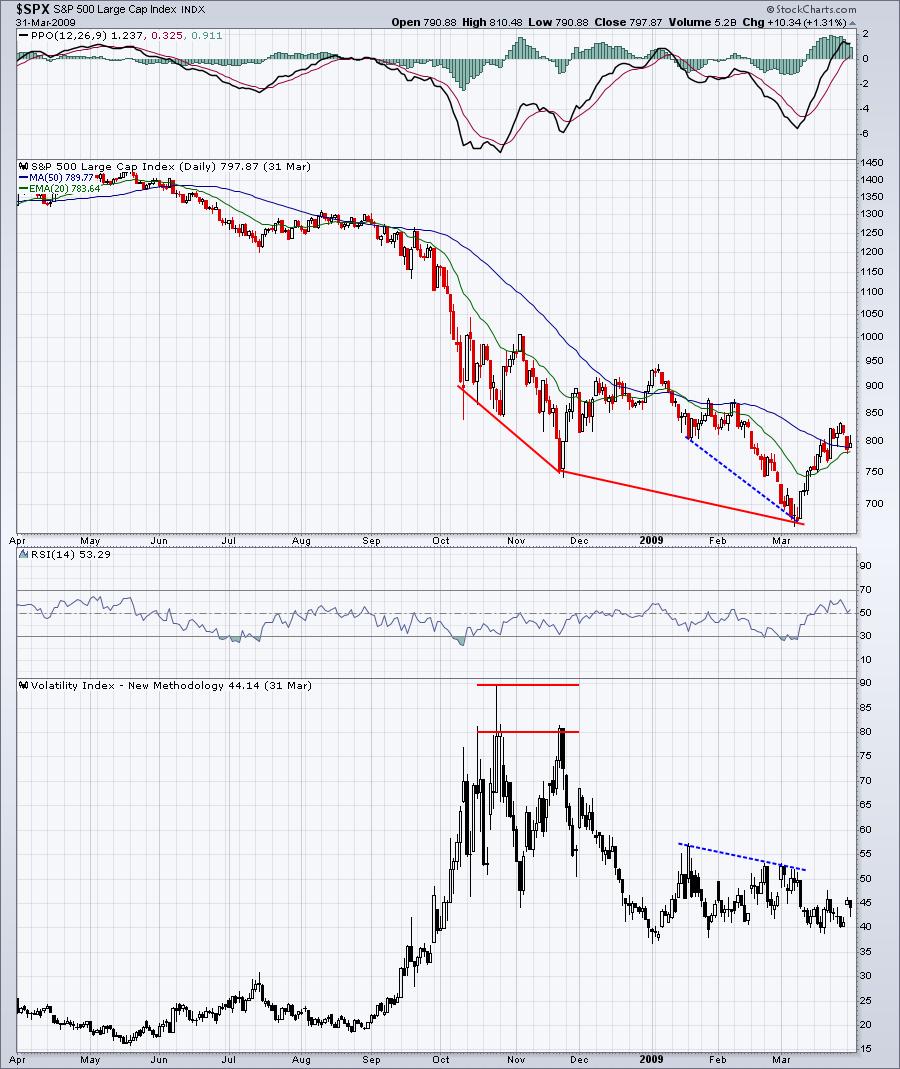
While the VIX at 90 did not mark the ultimate bottom, we can see that as we moved to new lows in November 2008 and March 2009, the VIX was setting lower highs. In other words, fear was declining even though price action was getting worse. In hindsight, that may have been a bullish signal, but the financial crisis was such a once-in-a-lifetime market meltdown, I try not to compare that to other short-term periods of despair. Also, it represented the last hurrah of the secular bear market that began in 2000.
Let's move on to 2011 and the sudden drop in July/August:

First, the red-shaded area highlights the rally attempts into key Fibonacci retracement zones, which failed multiple times. Note that the VIX remained elevated above 30 throughout this period. Volatility (fear) remained an issue and the market couldn't recover until we saw the VIX break below 30.
Let's move on to 2015/2016, which was a difficult period of consolidation during the current secular bull market:

Both of these drops saw rally attempts to key Fibonacci retracement levels (blue arrows) before rolling back over and forming double bottoms (black arrows). This history provides us no guarantee of how the stock market will perform in the future, but it does provide us a glimpse into how price action has acted during previous high volatility environments, which can be useful to drown out all the media noise.
So what did 2018 look like?

This was a different story. Note that from the February 2018 low, we actually rallied twice back above the 61.8% Fibonacci retracement level, only to fail. Those were head fakes. But in Q4 2018, the Fibonacci retracement levels provided excellent pivot points on the chart before finally breaking down beneath the double bottom. Double bottoms formed on both occasions.
Finally, we fast forward to where we sit today. The VIX closed yesterday at nearly 40. It's on the rise again and this morning we see Dow Jones futures lower by 700 points (at last check). The collective stomachs of the bulls will be tested once again at today's open. From my review of history, here are a few things I'd consider:
- Be extremely careful if you're a short-term trader. I prefer cash as my buying power goes up as stock prices move down.
- Look for a double bottom, at a minimum. It doesn't always occur, but from recent history, I believe the odds support another move lower to test the recent price low
- Watch those Fibonacci retracement levels. The odds of a market recovery grow significantly when those retracement zones are cleared
- Don't be a hero. From history, we can see that not every bottom forms exactly the same. What we do know is that these extremely high VIX readings help to mark very important support levels and I suspect we're in the process of marking one right now.
With this in mind, now let's look at the current picture:

I can fairly confidently say that I don't believe this chapter in stock market history has played out just yet. I honestly don't know where we go from here. Based on history, let's look eventually for at least a test of price support near 2850. Also, don't be shocked if we see other big rallies that take us to the Fibonacci retracement area in the red-shaded area. Determining which way we go each day? Give me a coin and I'll give you my best guess.
Be careful.
I'll be following the coronavirus issues, along with relative strength and earnings reports, and reporting on this 3x a week in my EB Digest newsletter. It's completely free to everyone and you can subscribe to it HERE.
Happy trading!
Tom


