I've been watching in horror at some of the recent economic reports, especially the initial jobless claims, which yesterday sported a second consecutive week above 3 million. It was just a few short weeks ago that we were seeing 200,000-220,000 every week. We live in a different world right now, however, and we may find out exactly how bad the job market has deteriorated later this morning when nonfarm payrolls are released for March. The consensus estimate has it pegged at -150,000, though the range moves anywhere from +100,000 to -1,250,000 (!!!). We are in for more shocking numbers ahead, this is just getting started.
As investors open their March month end statements over the next few days, there'll be plenty more shock to go around. From the February 19th intraday high to the March 23rd low, the S&P 500 fell a remarkable 35.41%. Even after the sizable 3 day rally, the S&P 500 was still down more than 25%. And we've been drifting lower since.
But let me say this. Now is NOT the time to bury your head in the sand and ignore your investments. There have been two promising developments since this downtrend began:
Accumulation/Distribution is on the Rise
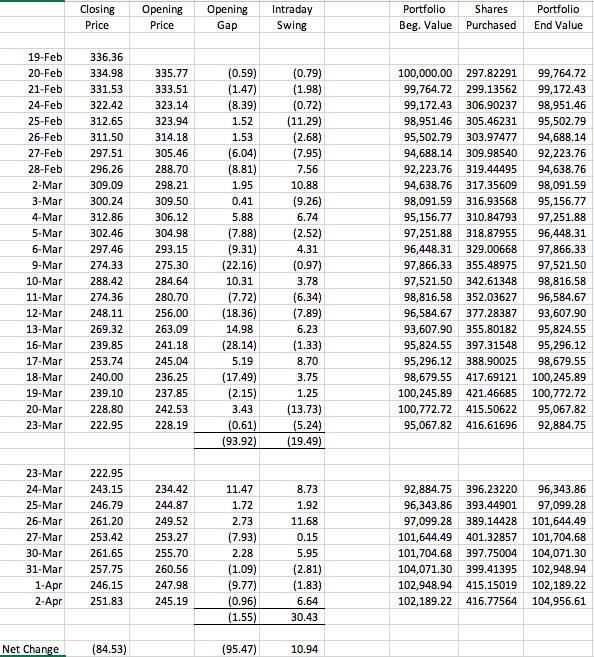
Much of the selling has been at the open over the past six weeks. To help illustrate this, I did an exercise where I started with a $100,000 balance on the February 19th close. That was the day the S&P 500 hit its intraday high. I thought to myself, "what would have happened if I avoided holding stocks overnight and simply bought at the open and sold at the close?" Well, I did this exercise for the SPY (ETF that tracks the S&P 500). Would you like to hear something truly amazing? If you had started this process at the February 19th close and continued it right through yesterday's close, your $100,000 investment would have risen to $104,956.61 at yesterday's close, a gain of 4.96% during one of the worst periods in stock market history.
Huh?
The point here is that the fear and panic have caused many large gap downs at the opening bell, but make no mistake about it, there have been plenty of buyers as panicked investors and traders flock to the exits during the opening bell pandemonium. Here's an Excel spreadsheet to illustrate this strategy:
This is the way that an accounting geek like me would illustrate what's been happening. If you'd like to move to a more traditional technical analysis tool to visualize what's going on, how about we look at the Accumulation/Distribution line vs. the On Balance Volume on the SPY over the same period:
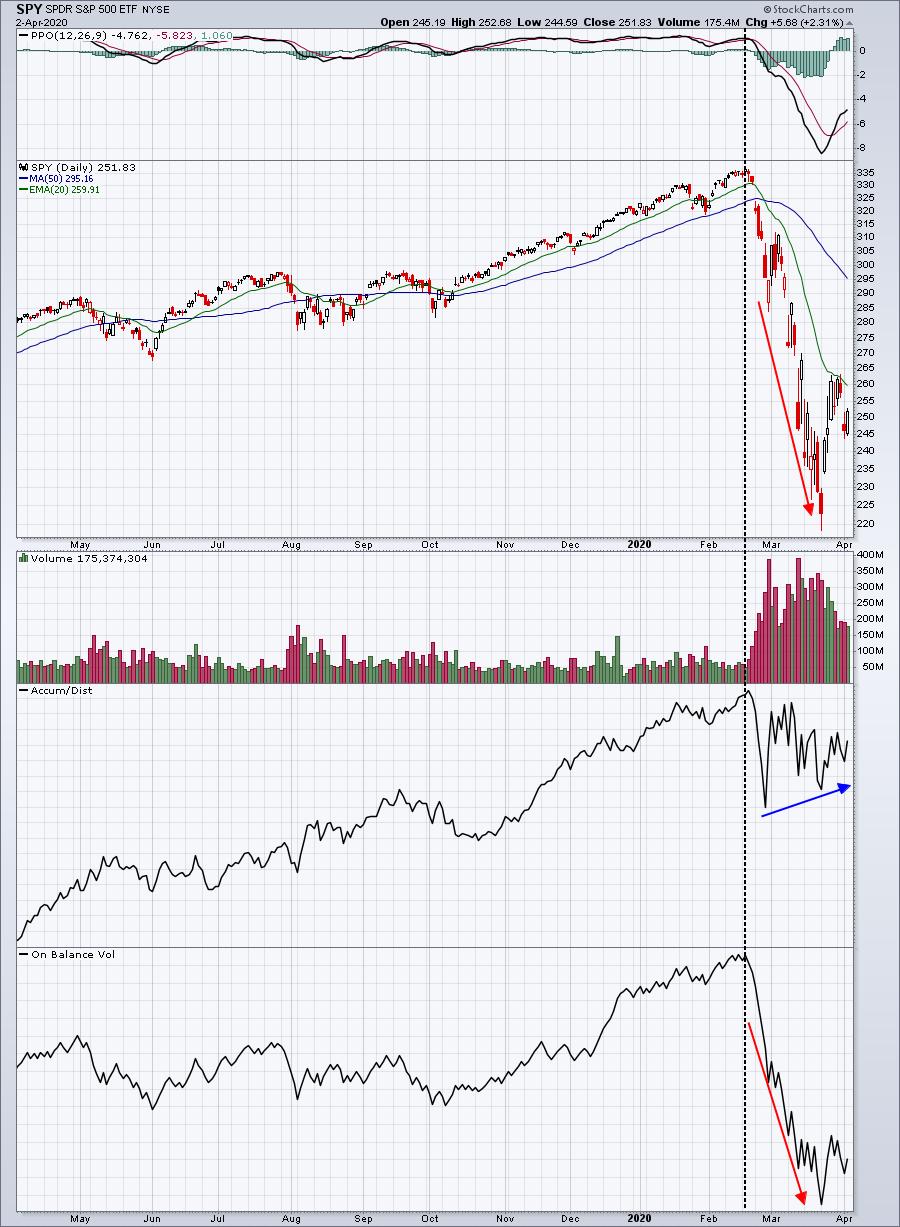
On balance volume fell right along with the price action. Why? Well, because it simply looks at whether you close higher or lower from the prior day. It does not take into account anything that transpires on an intraday basis. So if the SPY were to close at 300 one day, open at 260 the next, and then finish that day at 299, the on balance volume says "you dropped a dollar so the entire day's volume results in a huge drop." But when we look at the accumulation/distribution line on a similar day, it would shoot higher because it focuses more on what transpired during the trading day. Quite honestly, as a trader, that's much more important to me. In the example provided I'd view that one dollar drop very bullishly after it had opened 40 dollars lower. Someone is doing a whole lot of buying to generate that type of reversal. That's what the accumulation/distribution line measures.
So when I glance back up at that SPY chart, I realize that from late-February, the big drop in the SPY appears to be major accumulation by professionals. During other highly volatile periods the past several years, we've seen this disparity in the OBV vs the AD line before. Check out this 5 year chart:
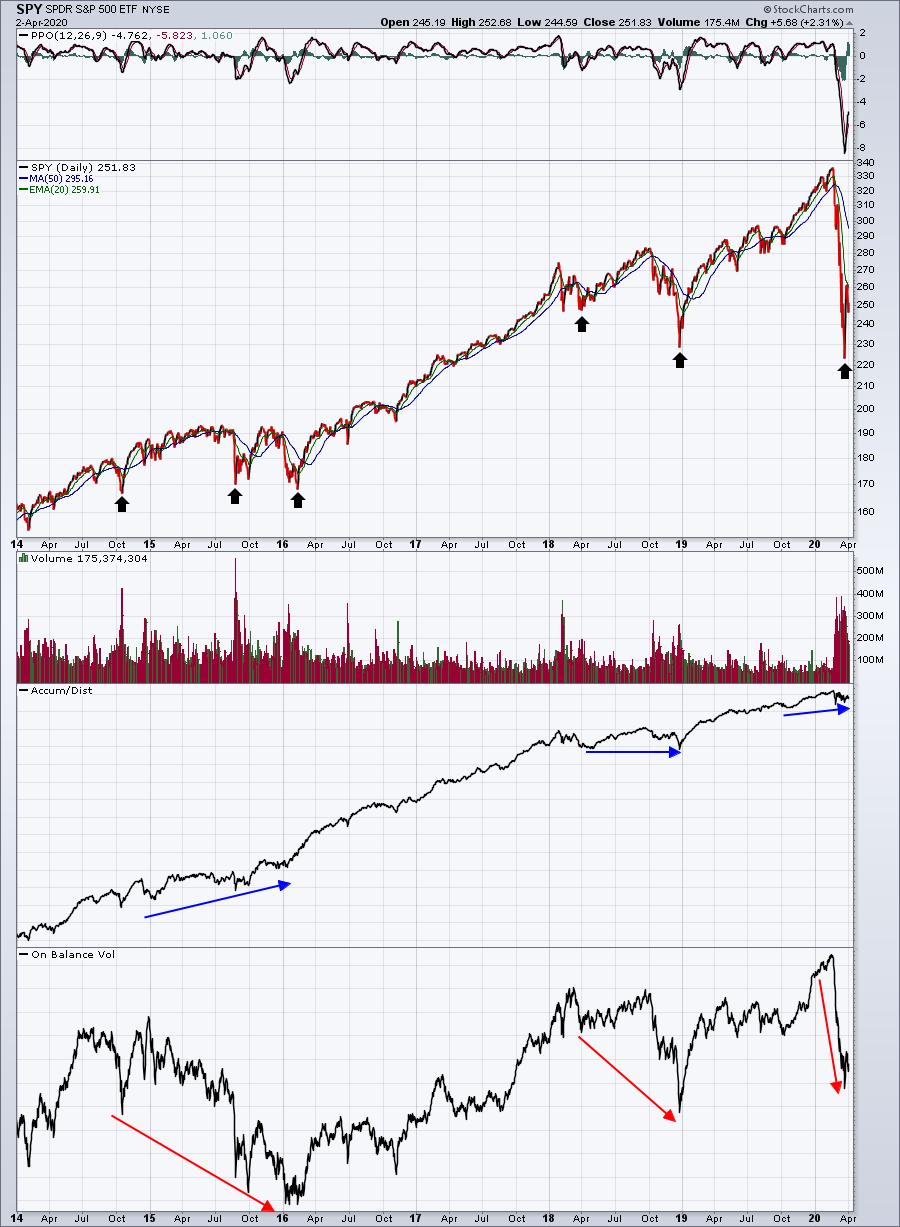
The black arrows represent key lows during volatile periods. The OBV simply tells us what we already know - that prices moved lower. However, the positive divergence in the AD line suggests that buying is taking place under the surface and THAT is a very important signal. When all of this ends, we are very likely to see a rapid acceleration to the upside. Are you positioned correctly for that?
Let me be clear about one thing. When we TRULY see distribution, it will show up on the AD line. Let's take the cruise lines as an example. This is an industry group that is not just seeing gaps lower at the open, but the follow-through selling throughout the trading day is obvious as well. Let's look at Carnival Corp (CCL) for a visual:
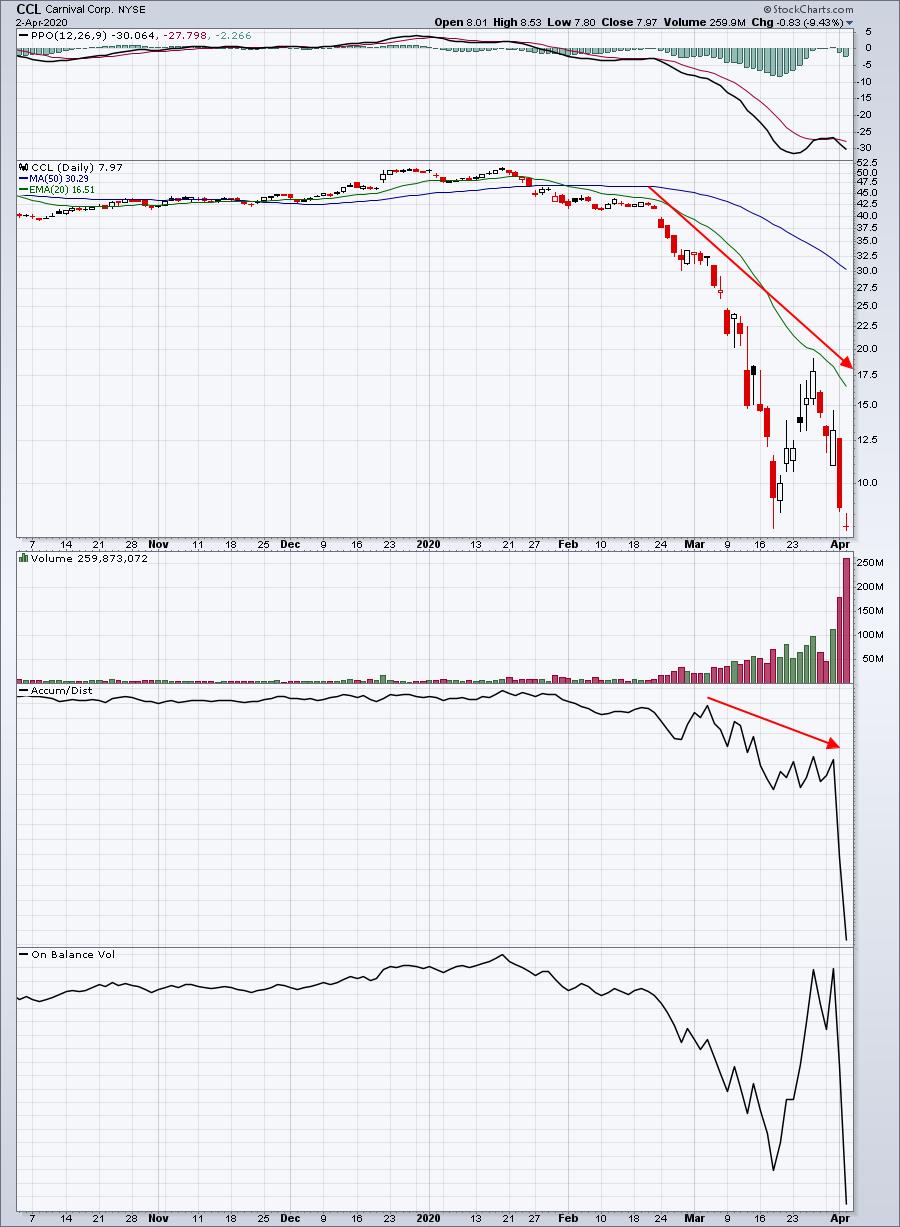
Do you see the difference? I believe the AD line provides us a really important perspective as to whether a selloff is sustainable or not. This knowledge won't erase any losses sustained in your portfolio, but I hope it helps you understand that the market is sending us a signal that plenty of opportunities lie ahead - just not likely in the cruise lines.
This leads me to Point #2.....
Analyzing Rotation will provide the Opportunity of a Lifetime
This is what I absolutely LOVE to do. It's in my DNA. Telling you that the S&P 500 is down xx% isn't exactly providing you earth-shattering knowledge. You can take one look at the chart and see that for yourself. However, telling you that key industry groups and stocks are being accumulated ahead of what likely will be a powerful rally later in 2020 (maybe weeks ahead, maybe months) is knowledge that could make or break your financial future. That's exciting to me and why I do what I do. I firmly believe we remain in a secular bull market and the way this cyclical bear market selling has taken shape does nothing but confirm it. I believe this will end much more like 1987 than 2008. Of course, there's the contingency of finding a solution to the coronavirus, but I believe we will endure this crisis and quickly begin to recover. I think most Wall Street professionals believe the same thing, which is why there's the appearance of accumulation.
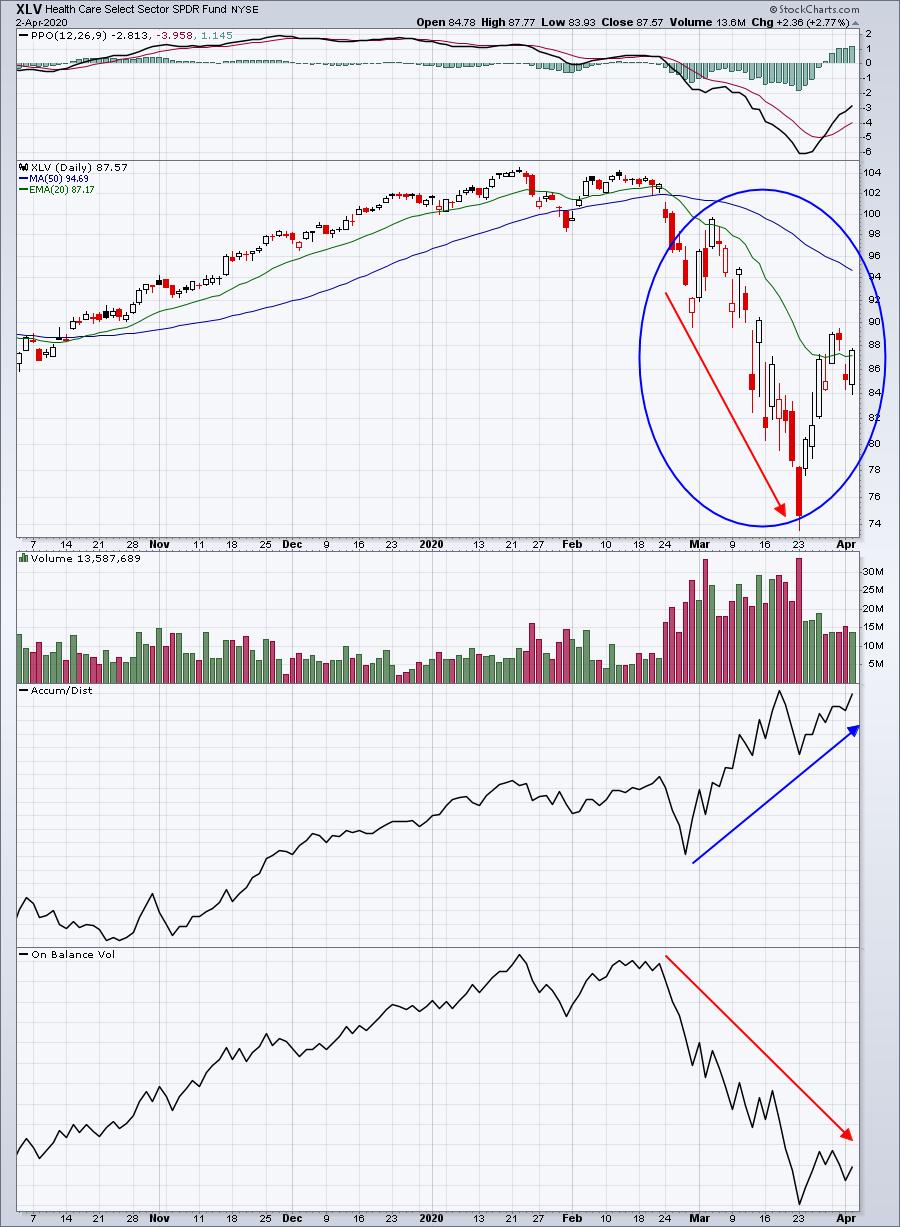
Would you like to see what accumulation in a strong sector or two looks like during this massive selloff?
Healthcare (XLV):
Technology (XLK):
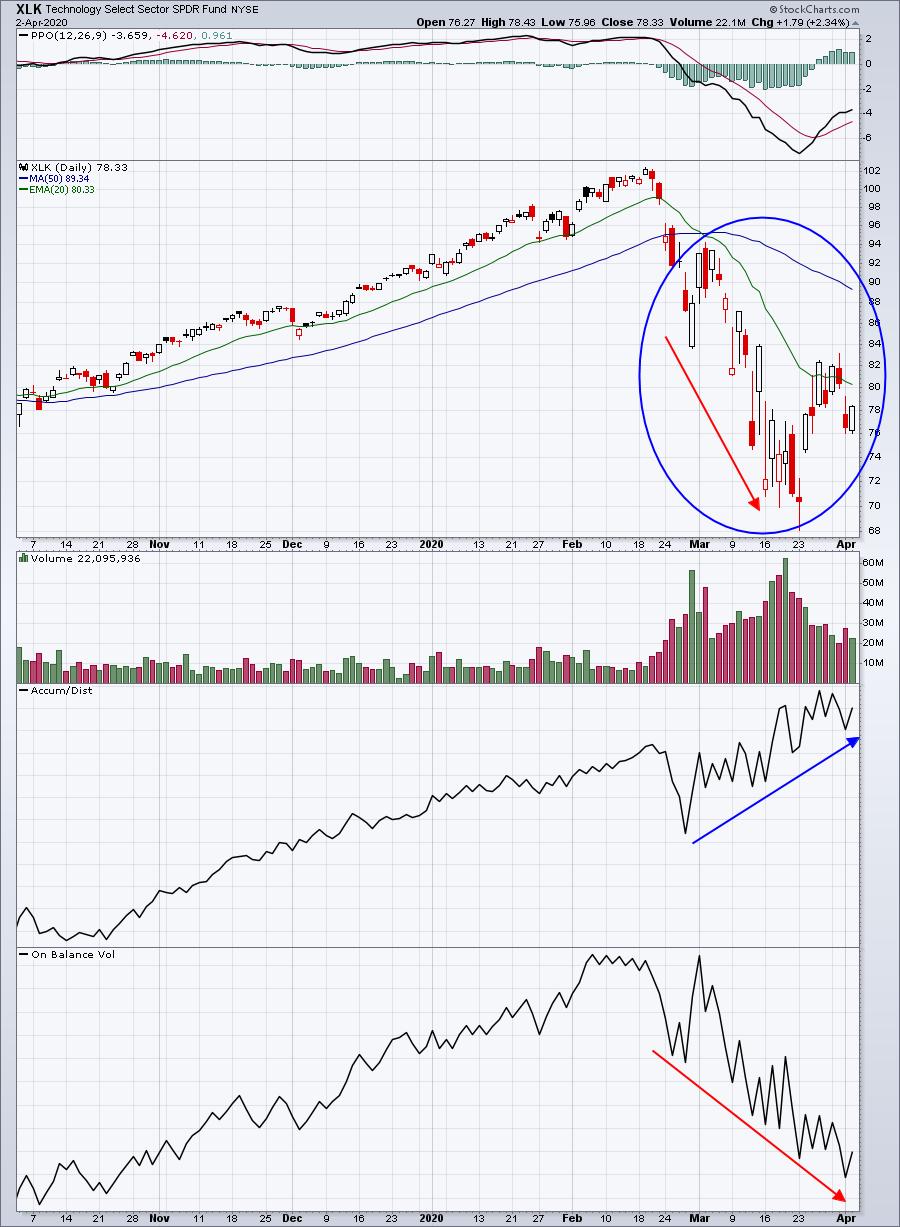
Look first inside those blue circles. Check out how many hollow candles (close above open) you see vs. filled candles (close below open). Hollow candles suggest net buying during the trading session, while filled candles indicate the opposite. There remain plenty of willing buyers in these two sectors despite all the negative news, the panic, and perhaps the worst stock market drop in my lifetime.
I am hosting a FREE webinar today. It's open to our entire EarningsBeats.com community, both paid members and free subscribers to our 3x per week EB Digest newsletter. Our webinar will start at 10:00am EST, although the room should be open by 9:00am EST. If you'd like to join for this presentation, all I ask is that you become a free newsletter subscriber. We'll take care of that for you.
I have completely changed my approach to trading this extremely volatile and dangerous market. I've also done a lot of research and plan to share my findings with everyone in attendance, including:
- the best stocks, industries and sectors to invest in prior to the big rally that's coming
- short-term trading strategies
- scanning techniques to find the those stocks being accumulated
- combining multiple StockCharts tools to weed out the winners from the losers
- paradigm shifts and the stocks well-positioned to benefit
Here's the webinar room link:
During this period of social distancing and while fear is running high, I want to bring our community together, offering hope during a period of constant negativity. I hope you can join me. If you can't make it today, be sure to sign up for our free EB Digest newsletter as we'll likely be providing opportunities to our community members to view the recording if they're unable to attend live.
Happy trading!
Tom


