Below is the Daily Market Report (DMR) that I send out to EarningsBeats.com members every day that the stock market is open. I keep our members posted as to key developments, including what's driving the stock market in both the short-term and long-term. One key factor is always earnings and at 4:30pm EST today, I'll be hosting our members-only "Q1 Earnings" webinar, looking at charts of companies that recently reported stellar quarterly results. Also, I'll provide my outlook on companies that will be reporting later this week. If you have any interest in attending, you can CLICK HERE for more information and to start your fully refundable $7 30-day trial.
I hope you enjoy today's DMR!
Today's Event and SECL Update
We are having our Q1 Earnings webinar after the close today. The room will be open by 4:00pm EST and we'll start promptly at 4:30pm EST. A link to the room is provided on our website (home page).
The Strong Earnings ChartList (SECL) has been updated through the earnings reports released on Friday, April 24th. There are currently 112 charts on this list. I removed 80+ charts as these companies are nearing their earnings dates. If they report strong results (beating revenue and EPS estimates), show relative strength, and also have a solid accumulation/distribution line, they'll be added back to the SECL. This list will grow significantly over the next few weeks as thousands of companies report their latest results.
If you're an Extra member or above at StockCharts.com, you can download ChartLists that I provide (eg, SECL) directly into your StockCharts.com account. Make sure that you're signed into StockCharts.com first. Then go to the ChartLists page at EarningsBeats.com, find the ChartList you'd like to download and follow the instructions provided. It's a fairly simple process that should take you no more than 10-15 seconds once you become used to it. If you have any issues, feel free to contact us at "support@earningsbeats.com".
Executive Market Summary
- Futures were strong to open the week, buoyed in part by strength in Asia and Europe
- The 10 year treasury yield ($TNX) is up 5 basis points to 0.65%, aiding equities, particularly financials (XLF, +3.04%)
- Real estate (XLRE, +2.60%), consumer discretionary (XLY, +2.38%), and industrials (XLI, +2.08%) are all up more than 2% today
- Energy (XLE, +0.61%) remains under pressure on a relative basis as crude oil ($WTIC) tumbles another 26%
- Gold ($GOLD) is down $11 per ounce to $1724 as volatility ($VIX, -8.93%) quiets; GOLD historically benefits from a fearful market
- The FOMC begins a two-day meeting tomorrow with a policy decision scheduled for 2pm EST on Wednesday
- Earnings reports will kick into high gear later this week; Alphabet (GOOGL) reports on Tuesday after the bell
- We have no active trade alerts at this time
Market Outlook
U.S. indices are rallying once again, confounding those who only see the pessimistic side of things. Yes, the pandemic is real and it's a major health crisis. But the 1918 pandemic resulted in a Dow Jones that rose 10% in 1918 and 30% in 1919. A health crisis can be reason to panic for health reasons, but don't let it affect your financial decisions. The 1918 pandemic also happened to take place alongside World War I. If the underlying current is one of a secular bull market, never lose sight of that fact. Wall Street is accumulating hundreds of stocks as I've written about endlessly since accumulation/distribution lines took a turn to the upside in early March. We remain in a secular bull market that I believe will last at least another decade.
I don't know how the balance of 2020 will play out. But I'd bet there's a much better chance we'll see an all-time high, especially on the NASDAQ 100 ($NDX), in 2020 than a retest of that March low. Lows like that form when individuals cannot take any more pain and simply sell at any cost. The Volatility Index ($VIX) rises to crazy levels and bottoms form. I'd bet that with a VIX reading above 80 in March that a bottom formed that none of us will ever see in our lifetime again.
It's just my opinion so feel free to disagree.
Sector/Industry Focus
Computer services ($DJUSDV) have shown tremendous absolute and relative strength since early March. Check out the current technical picture:
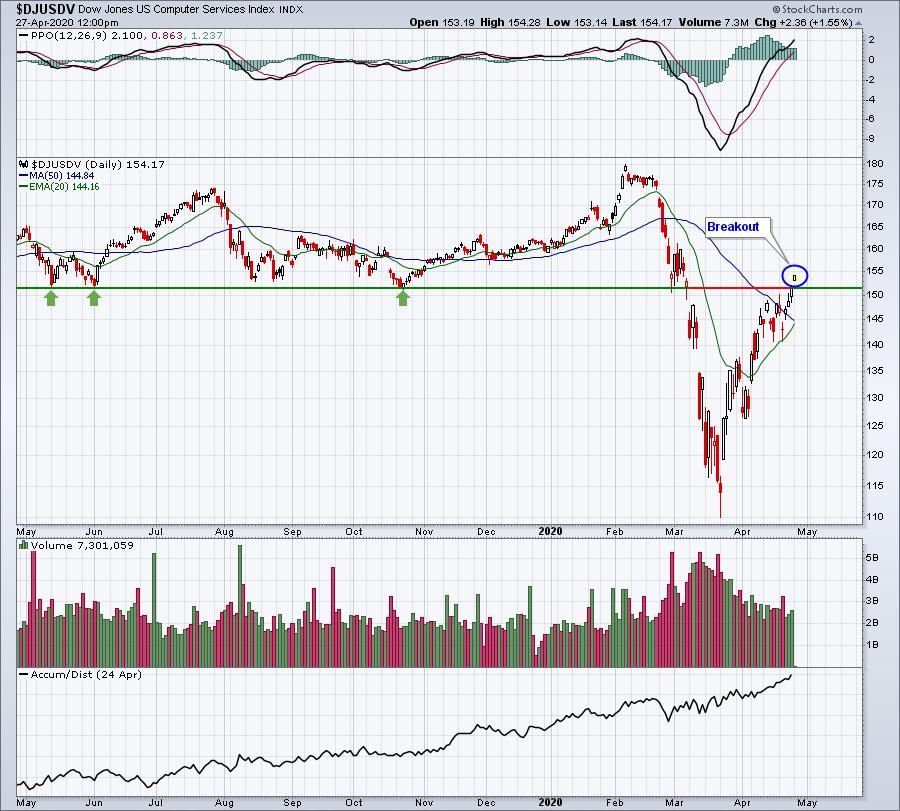
When I see strength like this, the first thing I do is look for companies on the SECL and Strong AD ChartLists that belong to this group. So, for example, if I pull up the Strong AD ChartList in "Summary" form and then type in "Computer Services" in the search box, here are the results I get (ranked in high-to-low SCTR order):
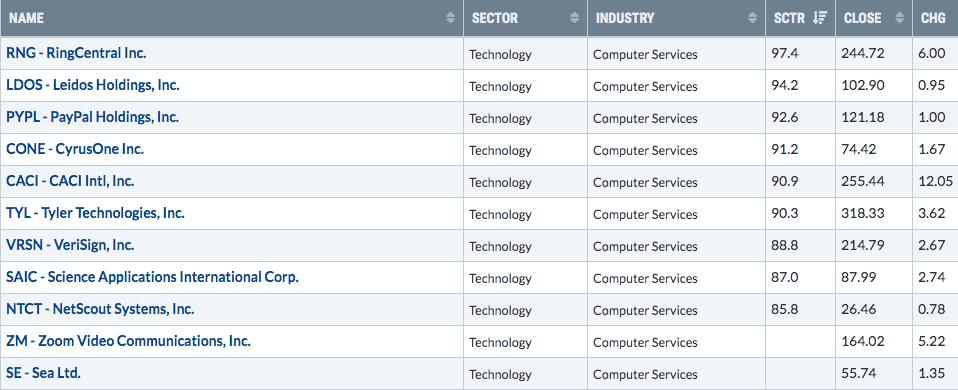
While RNG has been exceptionally strong throughout this pandemic, my immediate attention is drawn to the stock on this list with the highest percentage gain today - CACI:
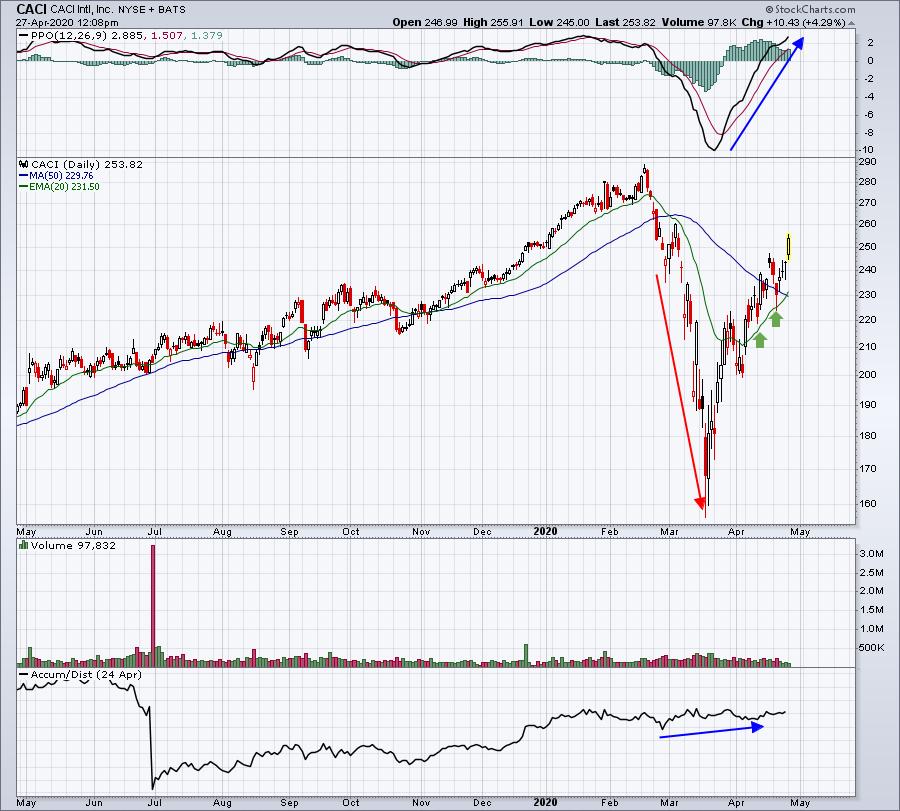
This has been SO typical of what's taken place in March and April. Prices move lower on many stocks, reacting to the enormous fear. All the while, Wall Street is happy to accumulate while individuals are panicking out of positions. You can see it clearly on the rising accumulation/distribution line that I've been discussing for weeks now. You want to remain on the bullish side and not be swayed by all the naysayers and fear mongers. Most media outlets care only about ratings. So called "journalists" spew their opinions everywhere, but most have absolutely no financial or stock market background. It's truly a shame. Stick with our ChartLists that have clearly been working. Unless the rotation changes in a major way, which I'll be watching (and adjusting to, if necessary), we have the best approach to this current market environment.
Strong Earnings ChartList (SECL)
I ran a scan of SECL stocks that have traded at least 75% of their normal daily trading volume as of 11:40am EST. The 5 stocks were AXTI, DGX, SNBR, WSM, ZM.
Featured Chart from this scan:
WSM:
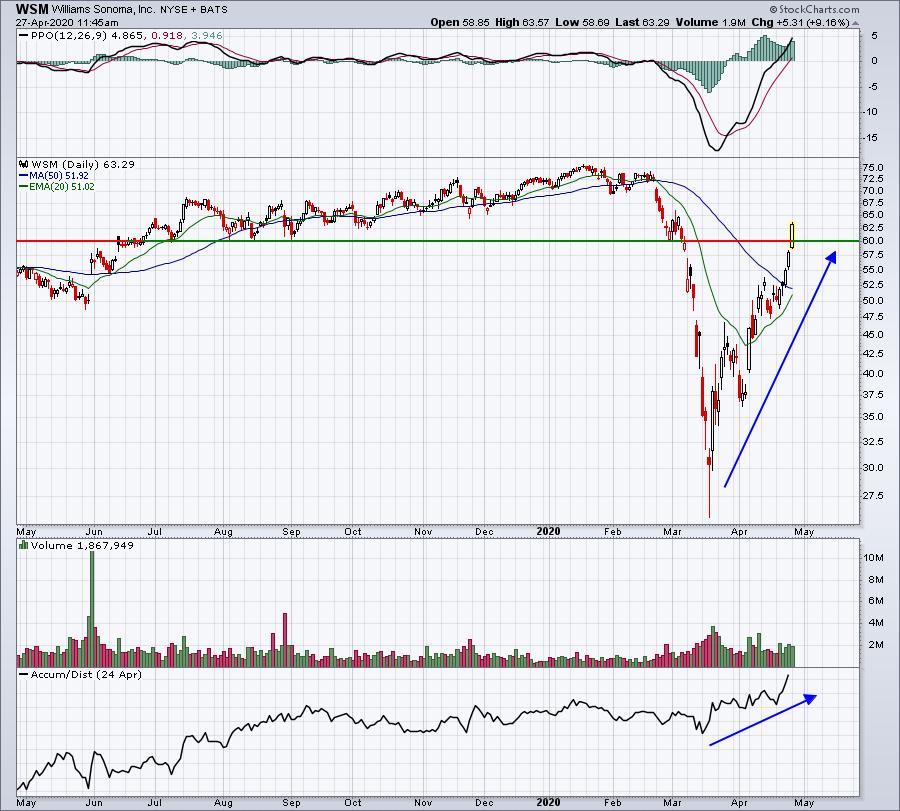
The bears are really getting into serious danger now, because a new batch of stocks like WSM that didn't perform so well during the March selloff and saw its AD line suffering are now bouncing back with a fury! The PPO has turned positive and WSM is attempting to clear a major price hurdle at 60. It needs to close above that level, especially with volume building today.
Strong and Weak AD ChartLists
Personally, I focus on long trading candidates, as opposed to short candidates. The stock market is behaving quite bullishly so let's run a scan on the Strong AD ChartList. Today, I looked to see Strong AD stocks that are trading with an RSI below 50. Here were the 10 stocks returned:
EHTH, HRL, LLNW, SAFE, TAL, TIF, TOCA, TR, VSTM, and WEC.
Featured Charts from this scan:
EHTH:
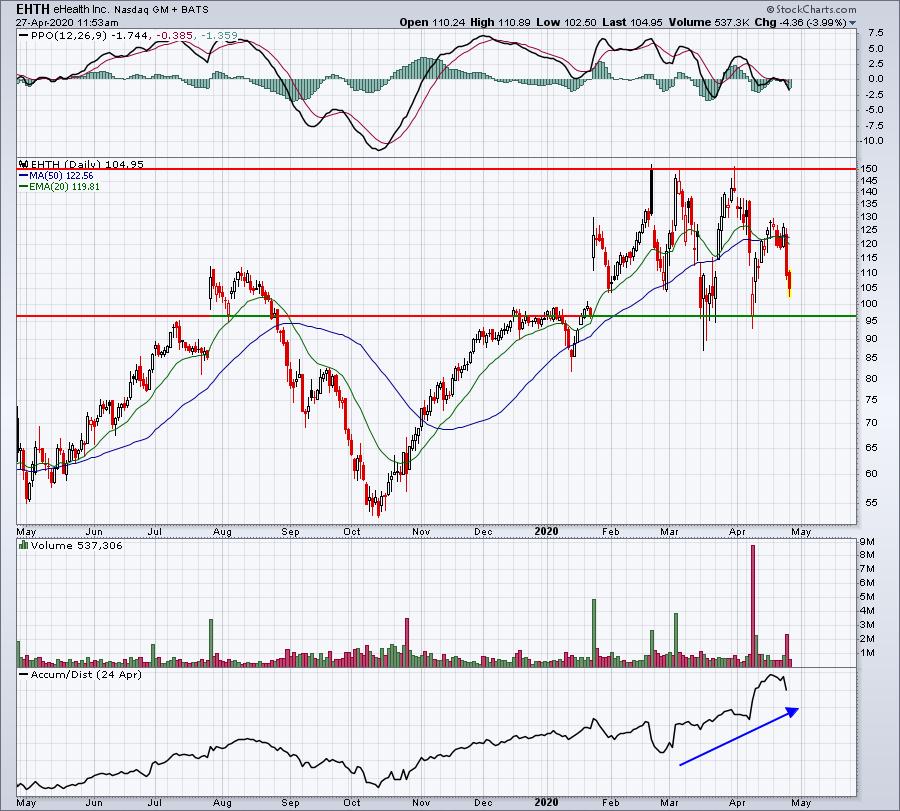
The AD line was been very strong here with EHTH and the stock is moving closer to price support in a very wide trading range. The reward to risk seems to be growing with every tick to the downside. Friday was a rough day for EHTH with a huge red-filled candle. But we haven't seen many of those lately, so the odds are we could see a rebound later today on EHTH. Given the zero-commission trading environment, building a position on EHTH during a period of further weakness would make sense as well.
WEC:
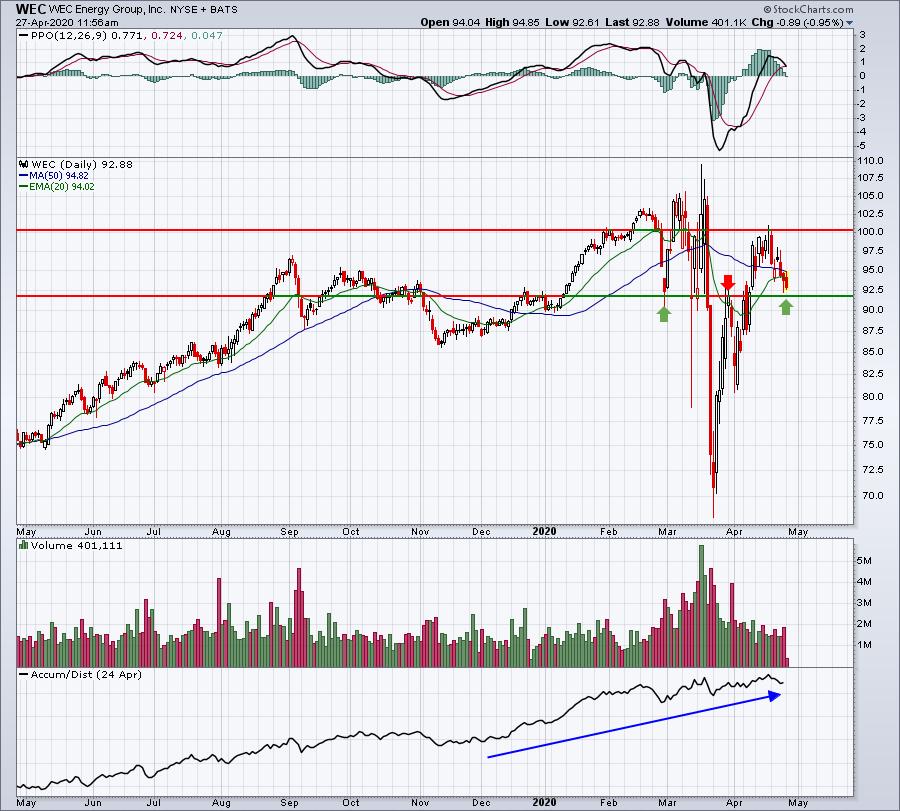
First, WEC is a utility so that might provide a bit more safety for those who are more risk-averse in their trading routines and strategies. 92 has proven to be a key pivot point and price support level for WEC and we're nearing it on the recent selling. I'd consider the current trading range to be 92-100, so the odds seems to favor longs at this point.
Earnings Reports
Here are the key earnings reports for today and tomorrow, featuring stocks with market caps of more than $10 billion. I also include a few select companies with market caps below $10 billion. Finally, any portfolio stocks (or active trade alerts) that will be reporting results are highlighted in BOLD. After today, I'll be placing an asterisk (*) next to stocks that are showing excellent relative strength and accumulation/distribution lines heading into their respective earnings report. In my judgment, I'd expect strong results and guidance, although correctly predicting which way a stock might gap after an earnings report is much more difficult. If you decide to hold a stock into earnings, please understand the significant short-term risk that you are taking. Please be sure to check for earnings dates for any companies you own or are considering owning:
Monday, April 27:
CNI, KDP, NXPI, PPG, ARE, CMS, CHKP, CINF, BRO, CE, UHS, CGNX. Others less than $10 bil: BRO, CE, UHS, CGNX, PKG, FFIV, OMF, AMKR, CNX, LRN
Tuesday, April 28:
GOOGL, MRK, PFE, NVS, PEP, SBUX, UPS, MMM, BP, MDLZ, SPGI, AMD, CAT, ECL, CNC, VALE, ROP, DXCM, TAL, MSCI, IQV, SIRI, TROW, TEL, CERN, CMI, CSGP, ROK, DTE, F, YUMC, BSBR, AKAM, LUV, GLW, DHI, MXIM, AGR, BXP, TRU, PAYC, OKE, WAT, YNDX, NUE, OMC, MASI, ZBRA. Others less than $10 bil: CHRW, MPWR, JNPR, MKSI, MRCY, PII, XRX, HELE, HOG, WERN, LSCC, FEYE, MTH, IRBT
Economic Reports
None
Happy trading!
Tom


