I've run into multiple friends of late, socially-distanced of course, who keep asking me, "Aren't the airlines a great value now?" Ugh. Really? What business can you think of that (a) has lost 95% of its customers AND (b) has little hope of attracting new customers in the foreseeable future and is somehow a great value? If you can debate the merits of investing in airlines at this moment in time, I'll give you the captain of the other debate team - Warren Buffett. Mr. Buffett, the "Oracle of Omaha", almost never turns down a great "value" deal. He sold every share of every airline he owned! And he owned big stakes in four major airlines. He didn't buy more and wait to "unlock the value" in this industry, which is what he did with banks during the 2008 financial crisis. He said I WANT OUT RIGHT NOW, EVERY PENNY. Big difference. I have an industry group relative ChartList and when I look at it in Summary view for the last 3 months, this is what I see at the bottom in terms of relative performance:
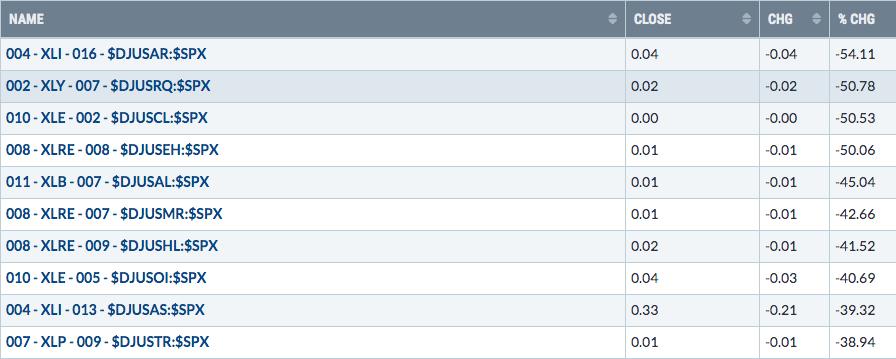
Airlines ($DJUSAR) is at the very bottom, or in this case, at the very top since we're ranking these groups from worst to best. Since the March 23rd low close, the S&P 500 has rebounded 692 points, or more than 31%. The DJUSAR has fallen another 4% during the bounce!
Moral of the story: AVOID AIRLINES.
Energy? Puh-lease! Unlike airlines, I do think there are energy companies that could be a bargain right now, but I don't see the group outperforming the benchmark S&P 500 for months, probably years. Even before the pandemic and demand grinding to a halt, there was an overabundance of supply. This is Economics 101 folks. Weak demand and too much supply. Recently, they were giving crude oil away. Seriously, I'm not kidding. If you wanted to store some crude in your backyard pool, you were being paid to do it. The value of your product is negative. What a great business model! In time, energy will very likely pull through, but I'm not the type of investor who buys and patiently sits back, waiting for the value proposition to unfold in 2027. Heck, I'd be bored by Tuesday at noon!
"Ummm, but Tom, wouldn't ridiculously cheap oil add to the value argument for airlines?" Listen, we're done with airlines, okay? Yes, they could fly their planes around at a much lower cost, but where does the revenue come from? No more airlines questions please.
Cruise lines? "Pass." Gambling stocks? "Nope." Hotels? "See airlines above."
"Okay, okay, okay, we get it. Avoid the beaten-down stocks. But you certainly wouldn't chase the strong stocks after this huge rally, would you? What about that retest of March 23rd lows?"
We're not retesting the March 23rd low, it's not happening. Everyone is calling for it and that makes it much less likely to happen. I've been saying in recent weeks that you will not see the S&P 500 at 2191 ever, ever again in your lifetime. To answer your first question, yes chase the leaders. If you think you'll see them back at March levels, I have a bridge I'll sell ya. The leaders are leading because they have been able to adjust to this crisis and still grow their earnings. This gets back to my days working in public accounting, but valuations of companies look at two key criteria (there are others, but let's focus on the biggies). One is future earnings growth and cash flows. The other is current interest rates. The majority of the companies leading the charge right now are posting record earnings. An exceptionally low interest rate environment, and we have the lowest rate environment on record right now, combined with increasing growth rate projections results in historically high PE ratios. The whole PE argument that many fundamentalists are using right now is COMPLETE HOGWASH. Did I emphasize that enough? You can't compare PE ratios in the 1980s, 1990s and 2000s to now. It makes no sense. The 10 year treasury yield ($TNX) closed Friday at 0.68%. 40 years ago today, on May 9, 1980, the TNX closed at 10.30%. Do you honestly think that companies should be valued in the same manner today given the huge disparity in market rates of interest? Seriously? If so, then you're not aware how valuation calculations are performed. I immediately tune out anyone that compares historical PE ratios because the argument makes no sense, except to try to confirm their predetermined bearish bias. This is Valuation 101. Apparently, I'm going to use up all my 101s in one article.
For those who believe that the virus hasn't run its course and that we'll be shutting down the country later this year once again, that's a valid argument if it happens. That would certainly add another level of crisis and fear to an already fearful world. How would the market react to that? How would I know? But the only period in history that compares to this one would be 1918 and 1919 where a similar pandemic (Spanish flu) raced around the globe. There were shutdowns in the U.S. People panicked. Masks were worn. Public transportation was avoided. Oh, and by the way, we were in the midst of World War 1. Were you aware of that?
One of the best articles I've seen on this subject can be found HERE. It was written just before the March 23rd bottom and it was a rational analysis of the last major pandemic and how the Dow Jones reacted before, during and after the crisis. It was a great read and quite prophetic.
So let's say I'm right and we have blue skies ahead. What should we be investing in? Well, I follow the footprints left by market action. In March, during the peak of Wall Street's losses, it was apparent to me and all of EarningsBeats.com members, that accumulation was clearly taking place in certain sectors, industry groups, and stocks, while distribution was taking place in others. Based on the accumulation/distribution line, I created two separate ChartLists, the Strong AD ChartList and the Weak AD ChartList. Buying stocks in the former and shorting stocks in the latter (although I'm personally not a fan of shorting stocks in a secular bull market) has overall been a tremendous strategy the past two months. Last week, for instance, here's the breakdown of weekly performance in each ChartList:
Strong AD ChartList (372 stocks):
Stocks gaining > 50%: 4, or 1.08%
Stocks gaining between 25% and 50%: 11, or 2.96%
Stocks gaining between 10% and 25%: 72, or 19.35%
Stocks gaining between 5% and 10%: 89, or 23.92%
Stocks gaining between 3.5% (S&P 500's return last week) and 5%: 42, 11.29%
Stocks gaining between 0% and 3.5%: 104, or 27.96%
Stocks that lost value: 50, or 13.44%
Weak AD ChartList (268 stocks):
Stocks gaining > 50%: 1 (PTLA acquired), or 0.37%
Stocks gaining between 25% and 50%: 1, or 0.37%
Stocks gaining between 10% and 25%: 46, or 17.16%
Stocks gaining between 5% and 10%: 54, or 20.15%
Stocks gaining between 3.5% (S&P 500's return last week) and 5%: 19, or 7.09%
Stocks gaining between 0% and 3.5%: 62, or 23.13%
Stocks that lost value: 85, or 31.72%
These numbers would have been even more skewed if it weren't for Friday's action, which saw a lot of beaten-down areas of the market rally. Nonetheless, here's a breakdown of how many stocks from each ChartList gained at least 10% last week.
Strong AD ChartList: 23.39%
Weak AD ChartList: 17.91%
Total number of stocks that failed to meet the S&P 500's 3.5% return last week were as follows:
Strong AD ChartList: 41.40% (that means 58.60% beat the S&P 500)
Weak AD ChartList: 54.85% (that means 45.15% beat the S&P 500)
If you're trading stocks on the long side, your odds are much better if you stick with stocks that are represented in our Strong AD ChartList. If you become an EarningsBeats.com member (fully refundable $7 30-day trial) and you're also a StockCharts.com Extra member or above, you will be able to download our ChartLists, including the Strong AD and Weak AD ChartLists in maybe 10 seconds each right into your SC account. I'd love to have you join!
Later today, Grayson Roze and Bill Shelby of Stockcharts will join me for the following FREE webinar:
Event: "Integrating StockCharts.com's Features and Tools into a Successful Trading Plan"
Date: Saturday, May 9, 2020
Time: 2pm EST (room opens at 1:30pm EST)
Room Link: https://us02web.zoom.us/j/85789863749 (won't be able to access until room opens around 1:30pm EST)
Agenda: CLICK HERE


