One thing that this pandemic has caused - and few would disagree - is an inordinate amount of fear. An easy way to depict this is simply to look at the Volatility Index ($VIX) and the equity only put call ratio ($CPCE). When these two spike, it's a definitive sign of fear. Below is the 5 day simple moving average of each:
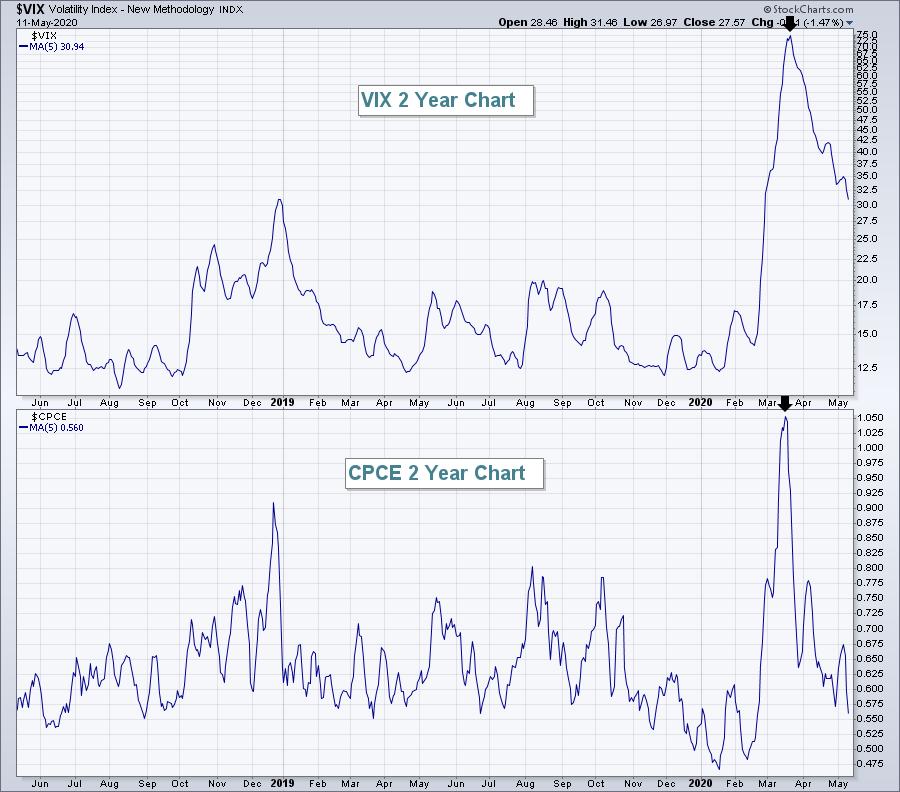
The lower panel shows that put buying grew tremendously in the first quarter, particularly in the 2nd half of February throughout much of March. When you buy a put, you profit from prices moving lower. But there is a defined risk - the amount paid for a put. There's another form of bearishness that is much riskier, however, and that's shorting a stock. If you'd like to listen to a video on what shorting means, check out THIS VIDEO and scrub to the 3 hour, 5 minute mark, "Trading Short Squeeze Opportunities". I had a great time on Saturday, May 9th with Grayson Roze and Bill Shelby of StockCharts.com and we shared a lot of knowledge about StockCharts.com and stock market opportunities. While there, make sure you SUBSCRIBE to our YouTube channel.
I've provided opportunities to benefit from heavy short selling in the past in my various blogs and shows as these short sellers must eventually cover their positions, which means they must BUY back their borrowed shares and return them. They represent guaranteed buyers. A rapidly-accelerating stock can create an emotional need for these short sellers to buy the stock, adding to the technical demand for a strengthening company. One metric to follow closely is the "short % of float". The float represents the number of shares actually available for trading. The short % of float is the number of shares short divided by that float. Any "short % of float" above 10% is high. If it reaches 20% or more, the impact can be very significant as shorts add to buying pressure. Here are two examples of stocks that I've written about in recent articles:
ChartWatchers Article - December 20, 2019 (TSLA)
Don't Ignore This Chart - April 25, 2020 (PTON)
TSLA advanced 125% in 6 weeks after my December 20th article. PTON has advanced 33% in a little more than 2 weeks since being featured and I don't believe the advance here is over. In fact, I like both of these companies for the balance of 2020 given current fundamentals and technicals.
So what might be the next short squeeze opportunity? Well, I've done a TON of research and now have a Short Squeeze ChartList with 144 potential candidates on it. Many are legitimate short candidates that will likely struggle for an extended period of time. So this list wasn't developed as a "one size fits all" type of list. I wouldn't just randomly buy any stock on this ChartList. Instead, I'd want to focus on those stocks that are gaining relative strength, showing signs of accumulation, and breaking above key resistance. Those are the characteristics that could lead to rapid acceleration in price. In addition to TSLA and PTON, both of which are likely to trade higher in my opinion, here's an example of one I'm now watching:
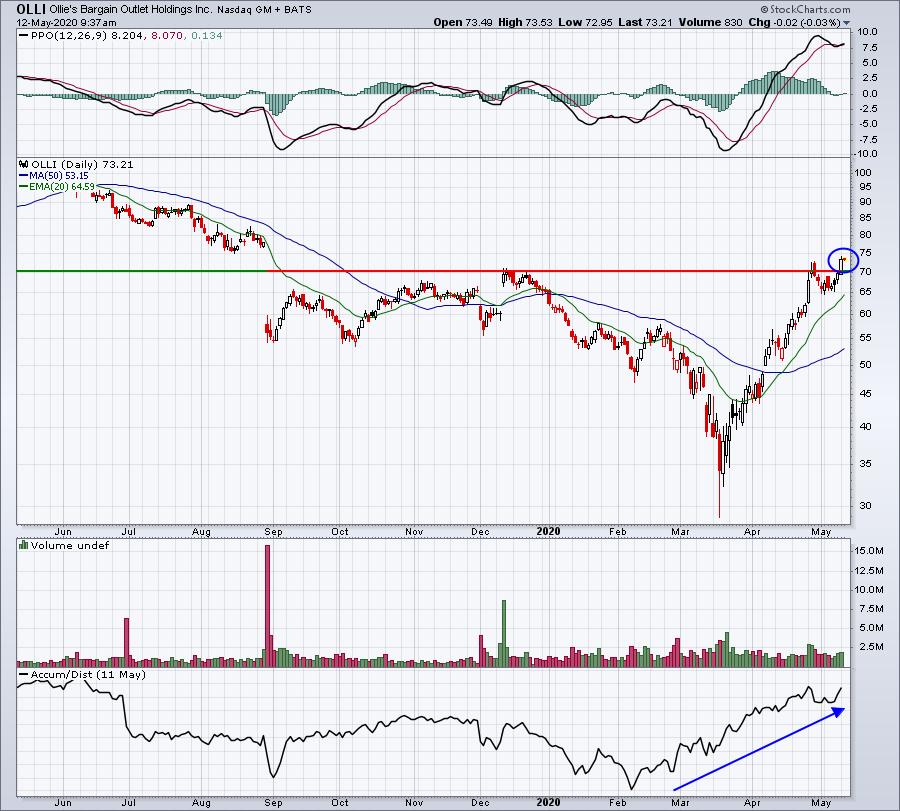
Note that the accumulation/distribution line started rising in early February, while price action didn't follow suit until a month later. Now we're seeing a breakout. From Yahoo! Finance, here are OLLI's statistics:
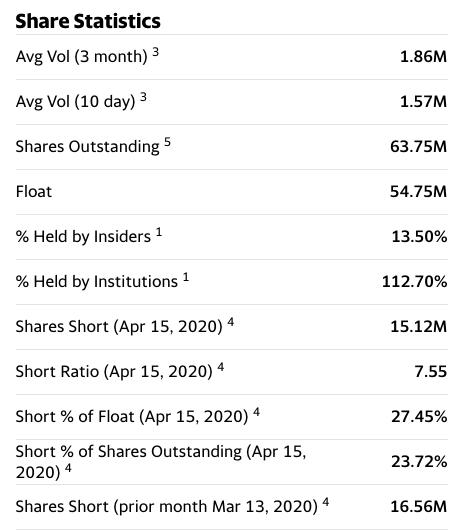
OLLI's "short % of float" is at more than 27%. That's a lot of traders betting against the stock with unlimited risk that will have to begin thinking about covering their short positions soon. If they do, they'll join technical buyers of the stock seeing this breakout, which could trigger a very rapid acceleration in the price of OLLI.
TSLA, PTON and OLLI are just three of the stocks on this powerful list! The 144 highly-shorted stocks are packaged in a nice neat ChartList that each of you can download into your StockCharts.com account. You need to be at least an Extra member to be able to download this ChartList. If you're not a member, you can sign up for a StockCharts' 30-day free trial HERE.
Once you're a member of StockCharts, you'll have the ability to download our ChartLists. Then you'll simply need to be an EarningsBeats.com member. We offer a fully refundable, $7 30-day trial. Change your approach to the stock market now and become a much more knowledgeable and successful trader. 30 days will provide you a perfect window to experience the change!
Happy trading!
Tom


