It's the most exciting time of each quarter for EarningsBeats.com and its community members. We're one day away from the equivalent of the NFL Draft for equities. The beauty of our Stock Market Draft, however, is that no one else participates! We can literally select the Top 10 Stocks in the market universe. Think about that for a second. As individual investors, we have no limitations. Just because someone else has picked Apple, Inc. (AAPL) in their portfolio doesn't preclude us from also picking AAPL. So shouldn't we be able to beat the S&P 500? If the S&P 500 is simply an index fund that's widely diversified, it's just an average performance of 500 multinational companies, right? Can we not beat average on a consistent basis? Mutual funds can't. I saw a statistic from a year ago that said 64.5% of mutual funds lagged the S&P 500 in 2018, 85% of mutual funds lagged the S&P 500 over a 10 year period, and 92% of mutual funds trailed that benchmark over a 15 year period. That's awful. There aren't many jobs out there where you can underperform for 15 years and keep your job. Yet investors still pour their hard-earned money into mutual funds. It makes no sense.
18 months ago, EarningsBeats.com began creating portfolios with one goal in mind. Beat the S&P 500. Our flagship portfolio, the Model Portfolio, was created on November 19th, 2018. It's an equal-weighted portfolio of our 10 best ideas. It's typically a "best of the best" portfolio, where we look for 10 of the best stocks within 10 of the best industry groups. Every three months, we dump the stocks in the portfolio and pick 10 fresh equal-weighted stocks, all relative leaders once again. So, in theory, our portfolio is always working hard as we're constantly following the stocks and areas that are leading market action. That's the whole idea.
The results have been outstanding. In total, since that November 19th inception date, our Model Portfolio is up nearly 70%. The S&P 500, by comparison, is up less than 10%. Now go back up and read that statistic from a year ago. Mutual funds struggle to beat the S&P 500 at all, let alone beat it by 60 percentage points!
Here's an inception-to-date performance chart of the Model Portfolio vs. the S&P 500 (through Friday, May 15th close):
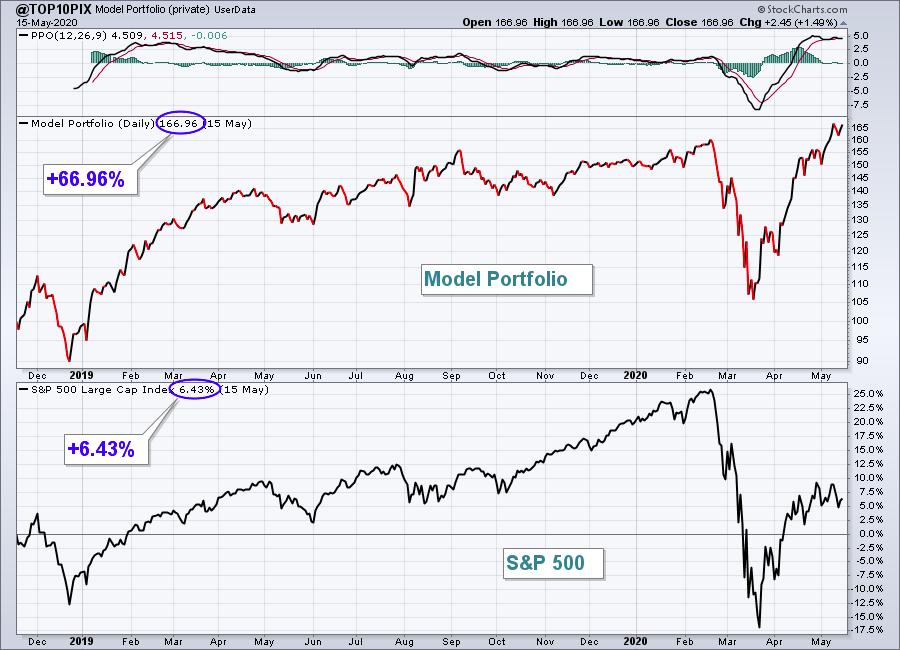
The User-Defined Index feature here at StockCharts.com is a great way to track a user-defined portfolio like the ones we have at EarningsBeats.com. Today's gain in the Model Portfolio will likely take this return to near 70% (another all-time high), while the S&P 500's gain today should push the index up to approximately 10% since November 19th, 2018, and still well below its all-time high just under 3400.
The key to our Model Portfolio performance has been sticking with leaders, through thick and thin. It's a little easier to sleep at night if you believe that you own 10 of the strongest stocks in the market. Also, our portfolios are really a blend between (1) active trading and portfolio management and (2) the buy-and-hold strategy. We buy and hold 10 stocks for three months. That's our commitment. Not a day longer and not a day shorter. After the three months are over, we do our homework and commit to the next batch of 10 leaders.
Here's the performance of the Model Portfolio by quarter (vs. the S&P 500):
November 19, 2018 through February 19, 2019
- Model Portfolio: +25.67%
- S&P 500: +3.31%
Best Model Portfolio Performer: EHTH +84.80%
February 19, 2019 through May 19, 2019
- Model Portfolio: +3.55%
- S&P 500: +2.87%
Best Model Portfolio Performer: CMG +19.43%
May 19, 2019 through August 19, 2019
- Model Portfolio: +13.83%
- S&P 500: +2.24%
Best Model Portfolio Performer: ROKU +60.61%
August 19, 2019 through November 19, 2019
- Model Portfolio: -0.67%
- S&P 500: +6.72%
Best Model Portfolio Performer: TER +20.78%
November 19, 2019 through February 19, 2020
- Model Portfolio: +9.07%
- S&P 500: +8.52%
Best Model Portfolio Performer: EVER +47.16%
February 19, 2020 through May 19, 2020 (through Friday, May 15th)
- Model Portfolio: +4.03%
- S&P 500: -15.43%
Best Model Portfolio Performer: SHOP +41.20%
I have to say that everything I do as Chief Market Strategist at EarningsBeats.com is made easier by the tools here at StockCharts.com. Without these tools, I'm not sure how I'd be able to do what I do. We are having a "Sneak Preview" today of our Stock Market Draft, which will take place tomorrow. During today's Sneak Preview, I'll discuss the methods and strategies that I use to create portfolios that have crushed the S&P 500. Use the tools here at StockCharts.com and simply be smarter than the rest of stock market participants. Today's "Sneak Preview" webinar will begin promptly at 4:30pm ET and it is free to everyone. We will add those participating in the webinar to our free 3x per week EB Digest newsletter, if you're not already a free subscriber. The webinar room has opened and can be accessed by following this link:
https://us02web.zoom.us/j/87100050334
If you have any problems, go to www.earningsbeats.com and click on the room link there.
Happy trading!
Tom


