One part of the U.S. stock market has been setting new highs and dragging other areas higher with it. Then we have groups reaching the depths of despair with little or no end in sight to their selling and misery. I've honestly never seen anything quite like it.
Welcome to the COVID-19 paradigm shift.
Let's be honest, who would've thought that two months ago Peloton Interactive, Inc. (PTON) was poised for outstanding growth with their "connected" fitness products platform? It's a solid concept, but you have to convince a lot of people to give up their gym memberships to see really strong growth. Well, COVID-19 became their top sales virus. PTON not only benefited immensely from "stay at home" orders and "social distancing", but there were tons of shorts betting against PTON's future. The latest short selling statistics still show PTON with 28.6% of its float short. There are more guaranteed buyers ahead.
So let's check out how badly PTON has performed during this "bear market":
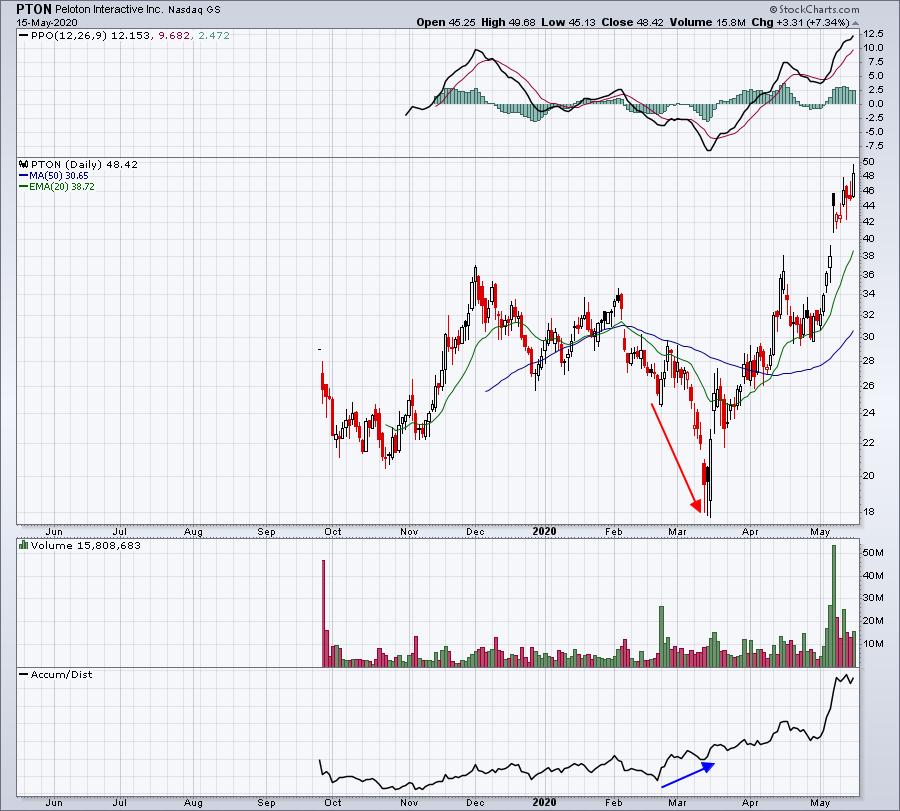
PTON's in a bull market. There may be a lot of professionals and traders calling this a bear market, but I don't see bear market looking at this chart. PTON is just one of hundreds of companies that have seen their business benefit from the virus. Companies that were already doing business online have seen enormous growth and their future outlooks have changed permanently, in my opinion. Many brick and mortar retail companies are fighting to stay alive - like JC Penney (JCP), while others have seen their businesses explode. Check out online home improvement retailer Wayfair (W) and online specialty retailer Carvana (CVNA):

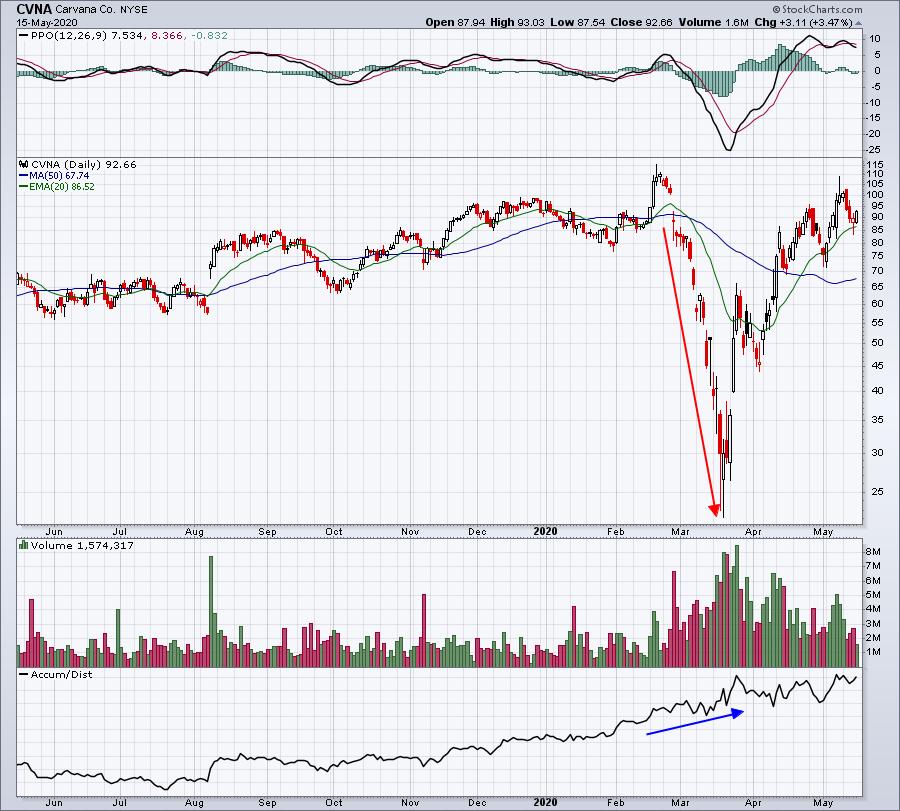
The common denominator in these 3 charts is that as prices were selling off in March, along with the S&P 500, these 3 companies were being accumulated during the trading session. Gap downs, then buying. That was the theme. The accumulation/distribution line (AD line) wasn't an indicator that I used prior to this pandemic. But StockCharts.com provides all of us a HUGE array of tools and features to help us navigate ANY kind of market and the AD line became my best friend since March. You have to be willing to do your homework, though. Or.....allow EarningsBeats.com to do your homework for you. That's what we do. We don't spread fear. We calmly analyze what's taking place "under the surface" of the market and we provide our research to both professionals and traders.
While we've seen a nice 30% surge in the S&P 500 since the March 23rd bottom, I believe owning the SPY (ETF that tracks the S&P 500) is doing your portfolio a big disservice. Why? Because you own a lot of stocks that you do not want to own. Airlines ($DJUSAR) are dead money. In the bullish examples that I provided above, I showed you the diverging AD lines (lower prices, higher AD lines). This illustrates the willingness of professionals to buy and accumulate stocks that were being trashed with all the others at the opening bell. (Think baby being thrown out with the bath water.)
Now I'm going to show you an area where the true bear market resides. Check out United Airlines (UAL):
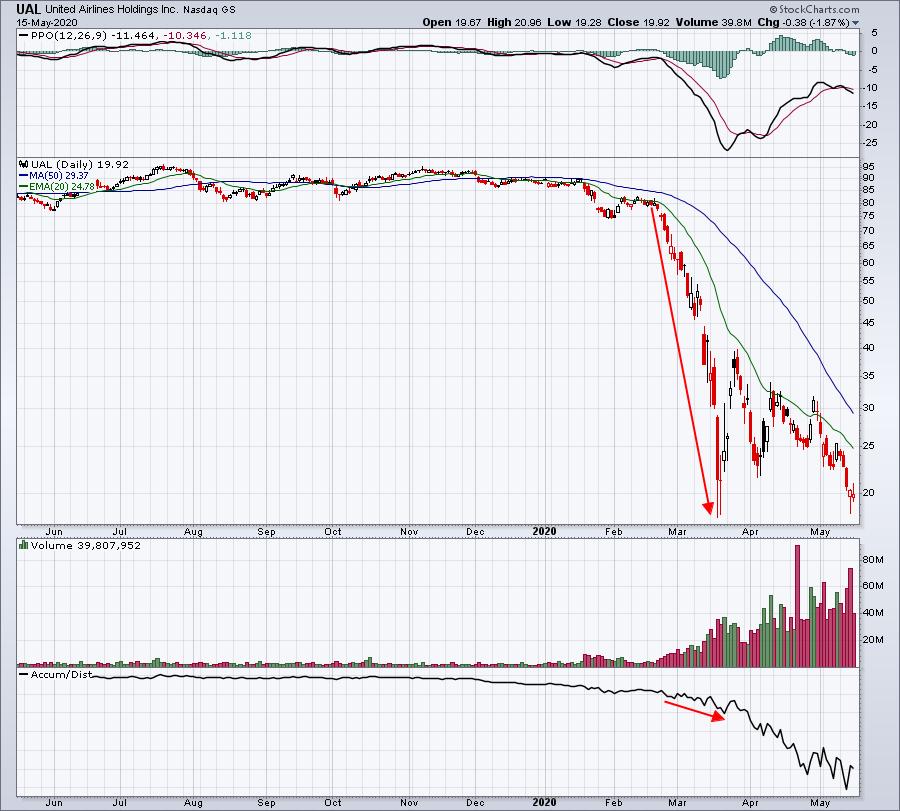
Warren Buffett said that Berkshire Hathaway sold its entire interest in four airlines. He's the best value investor on the planet. He sees so little hope for this group that he sold every single share of his holdings. And I'm supposed to buy? Ummmm, no thank you. But when you buy the SPY, you're owning a piece of UAL and many other airlines. You're also owning scads of financials, industrials, and energy stocks. Many market environments are categorized as "stock pickers' markets", but I don't believe it's ever been more true than right now. Put your money to work FOR you.
I have been providing two critical ChartLists to our members for download - our Strong AD ChartList and our Weak AD ChartList. The only caveat is that you must be at least an Extra member at StockCharts.com in order to be able to download ChartLists into your account. StockCharts.com offers a free 30-day trial - take advantage of it if you're not already a member! It'll change the way you invest for the better.
I want to share with you the unbelievable results from our ChartLists over the past month while the market has been flat. On April 17th, the S&P 500 closed at 2874.56. On Friday, May 15th, it closed at 2863.70, so essentially we've had a flat market for a month. Below is an image of my Excel spreadsheet that details one-month performance results from my Strong and Weak AD ChartLists (and my SECL - Strong Earnings ChartList):
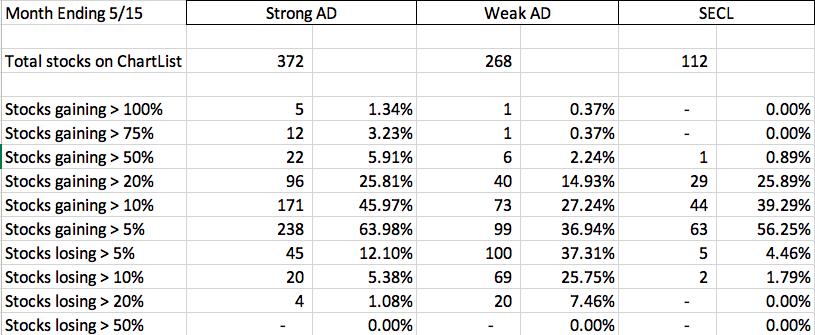
If you want to trade stocks on the long side, how important would it be to trade stocks on the Strong AD ChartList? Roughly 64% of all stocks on this ChartList have outperformed the S&P 500 by at least 5 percentage points in one month! You've had nearly a 50% chance of outperforming that benchmark by 10 percentage points. And if shorting is your preference, your odds are much, much greater if you short stocks on the Weak AD ChartList.
The SECL is another powerful ChartList that I share with EB.com members, showing the power of owning companies with both strong fundamentals (must have beaten Wall Street consensus estimates as to both revenues and earnings) and strong technicals (uptrending stocks with strong relative strength). These ChartLists are available to all of our EarningsBeats.com members and, again, I do all the homework for you. And it couldn't be simpler. We provide you a link and password to each ChartList. All of the homework is done for you. You literally should be able to download our powerful ChartLists into your account in 5-10 seconds each. In one minute, you'll download stocks in these various ChartLists that it took me days and days of research to create.
One week after the market bottomed, I wrote an article right here in my Trading Places blog that discussed the AD line and how powerful it was in helping us identify paradigm shifts taking place. You can check it out HERE. I've been providing excellent paradigm-shift-related trading opportunities to our EarningsBeats.com community ever since. While most analysts were extremely bearish and talking "Great Depression 2", I was analyzing the market and creating tremendous opportunities for our membership. It led one professional money manager to write to me and say, "You And Stock Charts have absolutely replaced my need for the Bloomberg Terminal". He went on to say that EarningsBeats.com's annual subscription is the best value in his educational arsenal as a portfolio manager. Those are high words of praise and I'm humbled by them. I work tirelessly for our EarningsBeats.com community. For all of our current members, I say THANK YOU for your continuing support! And for those of you that haven't tried our service, give us a shot. We have a fully refundable $7 30-day trial. There's also never been a better time to join. Why? Well, I'll be unveiling my Top 10 Stocks for 4 different portfolios on Tuesday, including our flagship Model Portfolio. I started this Model Portfolio on November 19, 2018 and, using the User-Defined Index feature here at StockCharts.com, I'm able to chart the inception-to-date performance vs. the benchmark S&P 500:

Yes, these numbers are legitimate. My Model Portfolio is up 66.96% in 18 months, while the benchmark S&P 500 is up 6.43% over the same period. That's 60 percentage points of outperformance in 18 months! Every quarterly stock selection session over the past 18 months has been recorded. Alls it takes is an EarningsBeats.com trial membership to get you our ChartLists and into the webinar room on Tuesday as I unveil my latest stocks for inclusion into all of my various portfolios.
Happy trading!
Tom


