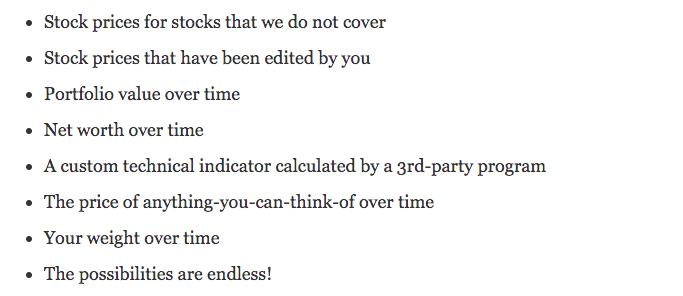
Well, I plan to host a free webinar on Saturday to demonstrate how we use this cool StockCharts.com feature to track our portfolios at EarningsBeats.com. In the StockCharts.com "Support Center", you'll find many examples of why you might want to consider using a User-Defined Index. From the Support Center article, here's a list of possible reasons to maintain a UDI:
That third reason is why we use it. We created multiple portfolios to illustrate how investing in leading stocks within leading industry groups can make a huge difference in beating the benchmark S&P 500. Our strategy is a true mix of the "buy and hold" and "trading" strategies for those individuals who want to somewhat manage their investments, but don't want to sit in front of their computer for hours a day. For those types of EarningsBeats.com members, we do the research for you. Every quarter, we review thousands of earnings reports, narrowing those thousands down to just a few hundred and we keep them in our Strong Earnings ChartList (SECL), which our members are able to download into their StockCharts.com accounts. When we announce our Top 10 Stocks (equally-weighted) in each portfolio, we do so after considering the price charts of all the companies we've already filtered based on fundamentals. Once selected, those 10 equal-weighted stocks remain in our portfolios until the next quarterly selection date. We just let those leaders work for us. Then it's rinse and repeat each quarter.
Our Model Portfolio, this quarter alone, is +10.32% (since August 19th close), while the S&P 500 is -0.35%. That's 11 percentage points of outperformance in just 6 weeks! Since inception on November 19, 2018, our Model Portfolio is +150.73%, while the S&P 500 has risen a more modest 24.98%.
After entering the daily portfolio values of our Model Portfolio into a User-Defined Index, you can then produce a SharpChart that tracks the portfolio value over time as follows (I've added the S&P 500 beneath our Model Portfolio for comparison purposes):
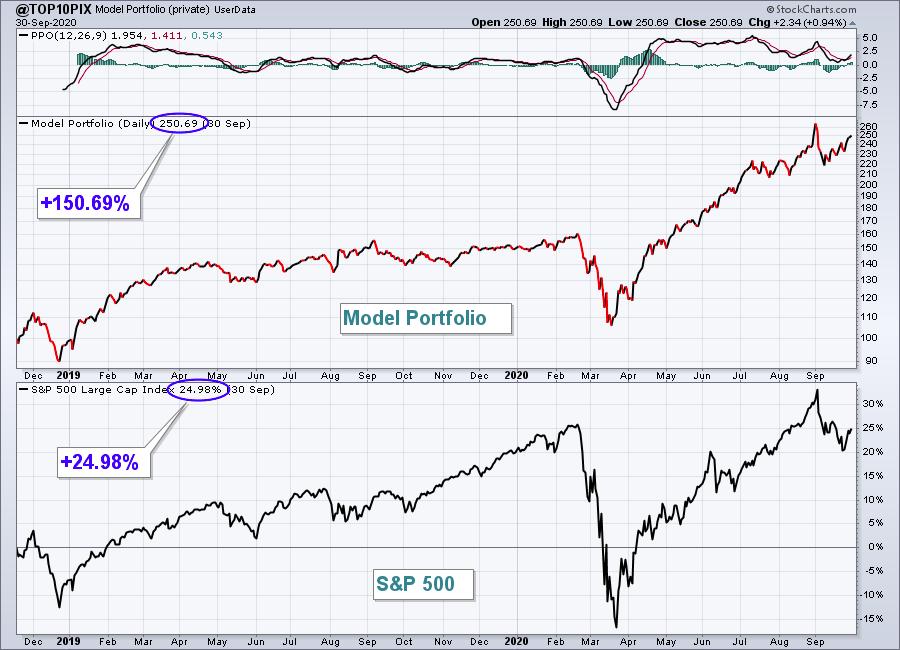
This chart has been updated through Wednesday's close and was printed based on the data that I've uploaded into StockCharts. The Excel spreadsheet that I use resides outside of StockCharts. I simply enter the daily valuation from my spreadsheet into this User-Defined Index and print a SharpChart that summarizes the data. It's a very cool feature that may be of great value to you.
If you'd like to learn more about User-Defined Indexes and follow along with a live example, we'll be sending out room instructions for our Saturday, October 3rd 11:00am ET webinar to our entire EarningsBeats.com community. You can join me by simply subscribing to our free EB Digest newsletter. There's no credit card required and you can unsubscribe at any time. CLICK HERE to enter your name and email address.
Happy trading!
Tom


