Global markets are rallying as more and more analysts look beyond the devastation caused by the 100-year pandemic and see a very bright economic outlook. Pent up demand, combined with historically-low interest rates will likely prove to be very bullish in the end. I continue to believe that we're still in the fairly early stages of a secular bull market that could last another dozen years.
The biggest clue for me that the pandemic would not cause long-term damage to our financial markets was the obvious accumulation that took place during the height of the panic and selling. Let's rewind to March and April and check out the accumulation on the SPY (ETF that tracks the S&P 500):
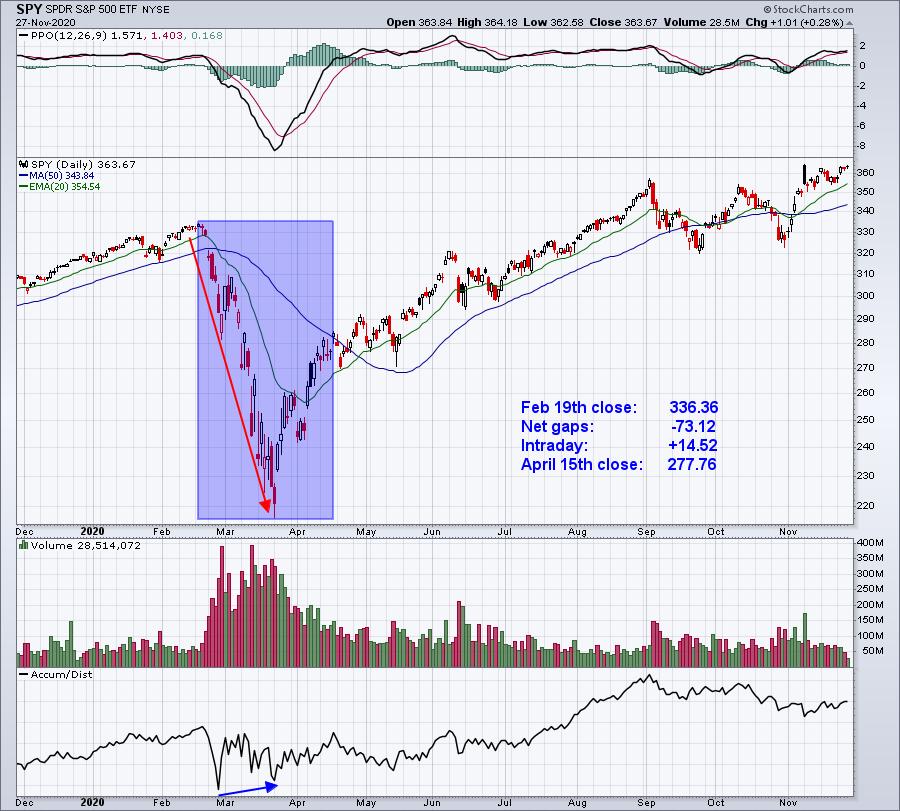
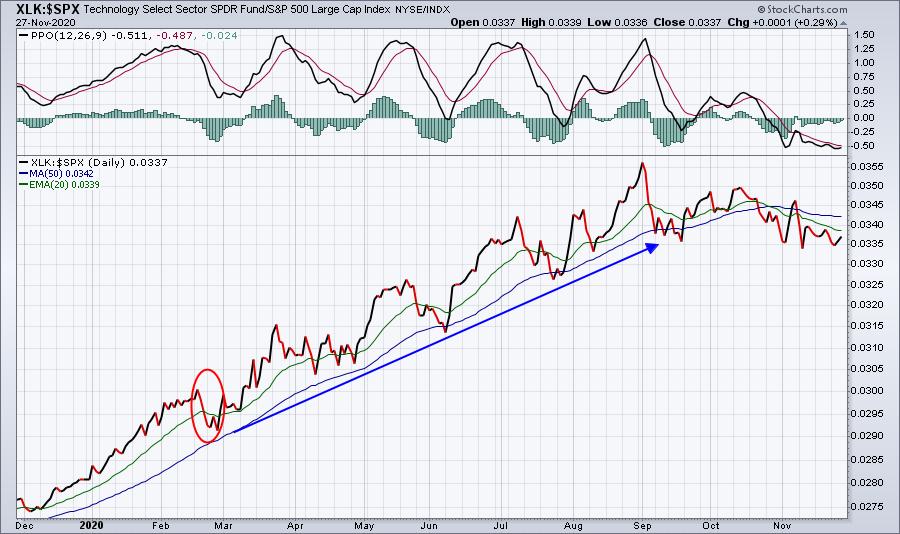
While the media was screaming "the sky is falling!!!" and, supposedly, The Great Depression 2.0 was being ushered in, institutions were accumulating stocks. And they weren't just accumulating any stocks. They were accumulating high-octane, growth stocks. Check out the following price relative charts:
Technology vs. S&P 500 (XLK:$SPX)
Growth stocks vs. Value stocks (IWF:IWD)
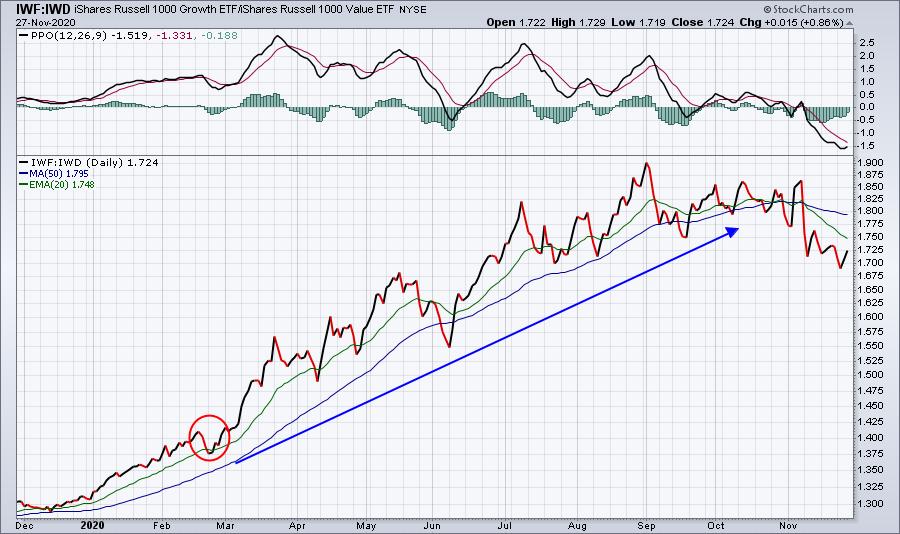
If you look at these 3 charts, you'll see that the initial reaction in late-February was quite bearish. The SPY printed several red-filled candles that suggested distribution and both price relative charts took initial hits (red circles). But it was almost as if the big investment firms decided to have a meeting at the end of February to discuss the fact that the 1918 pandemic saw equity prices move higher during a secular bull market. The accumulation game was about to begin, but I guess they forgot to tell the public they were buying while encouraging everyone else to sell. We know from history they'd never do that, right? (Insert Here: Subprime mortgages)
Seriously, why would growth stocks outperform value stocks as we headed towards armageddon? Why would technology stocks outperform? Why would AD lines (accumulation/distribution lines) rise on many stocks, while their stock prices declined? We must always remain skeptical of the overall trend of equity prices. Look beneath the surface to find the true story. The "S&P 500 is up" or the "S&P 500 is down" isn't good enough. Dig deeper.
Anyhow, the point of all of this is don't follow the rants of the media. The headlines are click bait. They want to scare the bejesus out of you so that you'll read their article. Their ratings draw advertisers. That's who they truly care about - the advertisers and their pocketbooks. Seeing these ridiculous headlines over and over again for weeks on end takes an emotional toll on just about everyone. I am many times in the dark on current events, because I refuse to watch the news. I never know what to believe as the line is always blurred as to what's fact vs. what the agenda is. If I don't watch it, then I don't care. I can then read the charts objectively.
Learn to understand the drivers of the stock market. It's not CNBC, that much I can assure you.
The stock market is going higher. I know it's hard to convince yourself that stocks can go any further to the upside. After all, the S&P 500 is up from 2191 at the March low to the 3638 close on Friday. Without actually doing the calculation, I can say it's roughly a 67% gain in 8 months. That's too much, right? Well, it's all about perspective. Another way to look at this is......the S&P 500 was close to 2900 nearly 3 years ago. Despite a solid and rapidly-improving economic environment, excluding the short-term economic restrictions due to COVID-19, and historically-low interest rates that should send valuations soaring, the S&P 500 is up less than 25% in close to 3 years. That's nothing more than an average annual return a period where I'd expect double or triple that.
The double and triple are coming.
Here's my last thought and chart. For major market tops and bottoms, I like to follow sentiment readings. Major market tops rarely occur when there's fear in the air (ie, an elevated Volatility Index, or VIX). I'm not a fan of sentiment readings that include how people "feel". I value readings that focus on what's taking place in the stock market - what people are doing with their money, not their mouth. If we look back at this century, the two biggest tops in the last 20 years occurred when weekly VIX readings were near 10, showing a significant level of complacency. Check out where we currently stand:
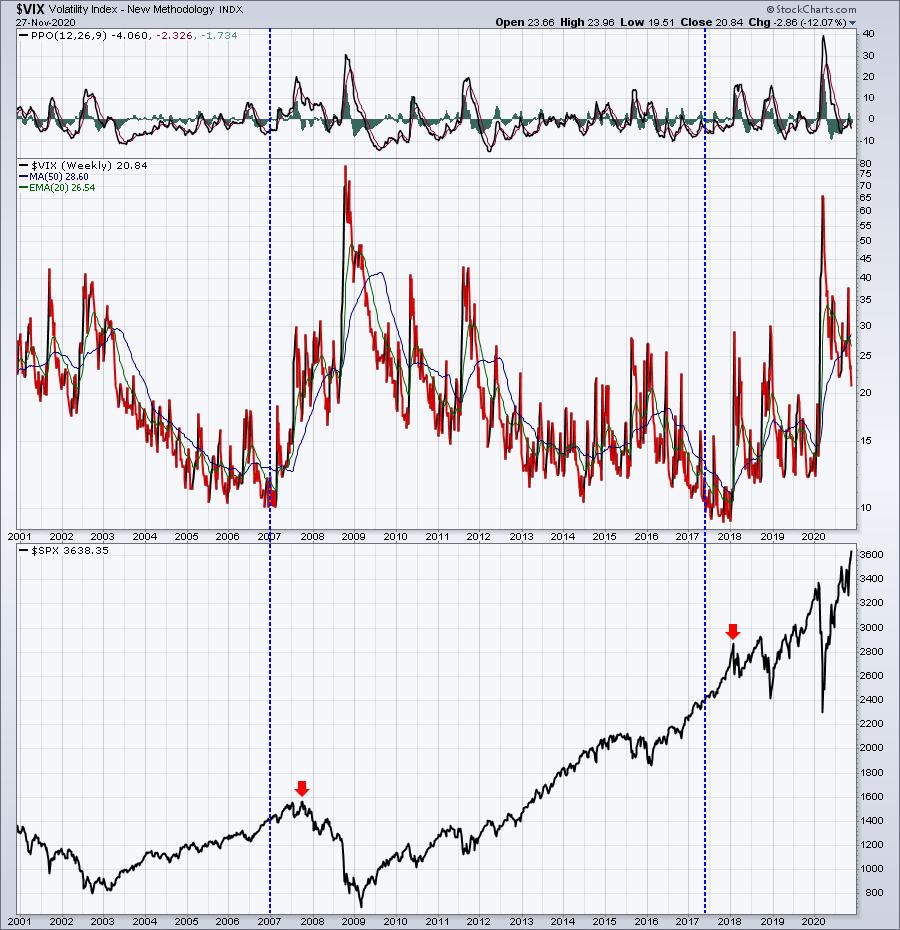
When we see the VIX return to 10, I'll grow more concerned about big picture sentiment issues. We're currently above 20. Historically, that's a fairly high level that suggests there's still plenty of fear out there. Markets don't typically top with elevated fear levels, though I'd be the first to admit that anything can happen. So I wouldn't blindly invest and leave civilization for 10 years. We need to watch new developments and evaluate market reactions, but I do remain quite bullish. Short-term sentiment issues will arise from time to time in the form of low equity only put call ratios ($CPCE). We have one of those now that could be an issue as December monthly options expiration approaches. But those are not long-term concerns.
I can't make financial decisions for others. I'm not a Registered Investment Advisor. But I have learned a great deal over the years, thanks in large part to those willing to share their knowledge and experiences. My colleagues here at StockCharts.com share their knowledge and expertise every day and I'm particularly thankful for the work that John Murphy has done over the years. If you want to learn more about the inner workings of the stock market, I'd highly recommend his books. As I gain my own experiences, I pass them along the best I can. The beauty of the stock market is that it's ever-changing. One minute you think you have it nailed, the next minute you look like a fool. It's quite humbling.
I will stick, however, with our primary theme at EarningsBeats.com, which is stick with leaders. Through the ups and the downs, Wall Street has its collective finger on the pulse of the market. Their MBAs and PhDs are, quite frankly, brilliant. When they begin to accumulate a stock, so should we. Our portfolio principles are based on this concept and our track record speaks for itself. If you'd like to see our portfolio performance, which is astounding, CLICK HERE.
Be sure to sign up for our free EB Digest newsletter while you're there and also I'd love to have you try our paid service. There's a fully-refundable, $7 30-day trial that I believe you'll enjoy.
Happy trading!
Tom


