Portfolios Update
4 of our 5 portfolios - Model, Aggressive, Strong AD, and Model ETF - all exceeded their prior closing highs on Friday. The Strong AD Portfolio soared more than 18% last week, absolutely crushing the S&P 500. Here's a quick summary of our portfolios:
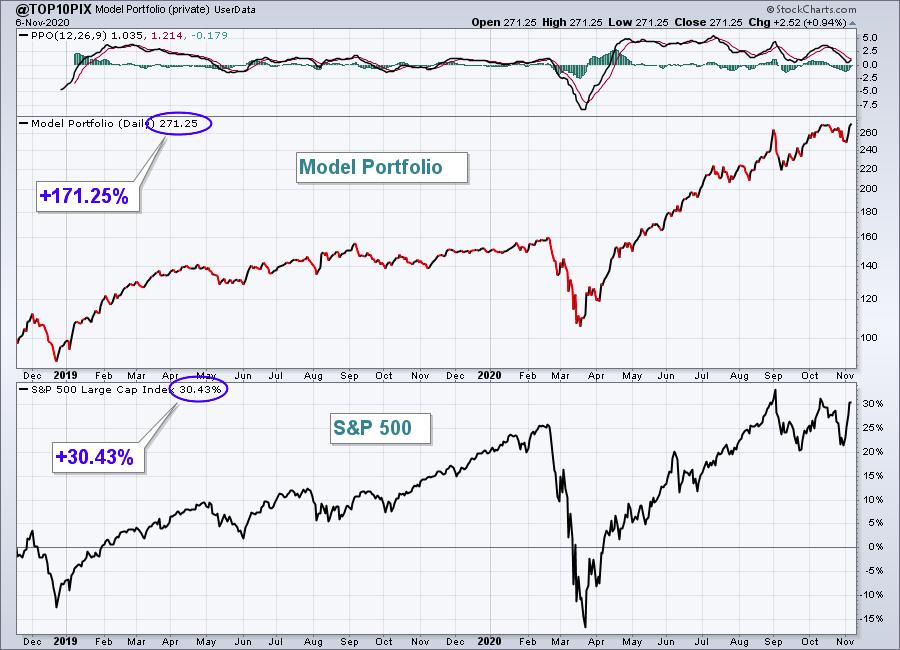
Model Portfolio:
Current quarter (since 8/19/20): +19.36% (S&P 500: +3.99%)
Since inception on 11/19/18: +171.28% (S&P 500: +30.43%)
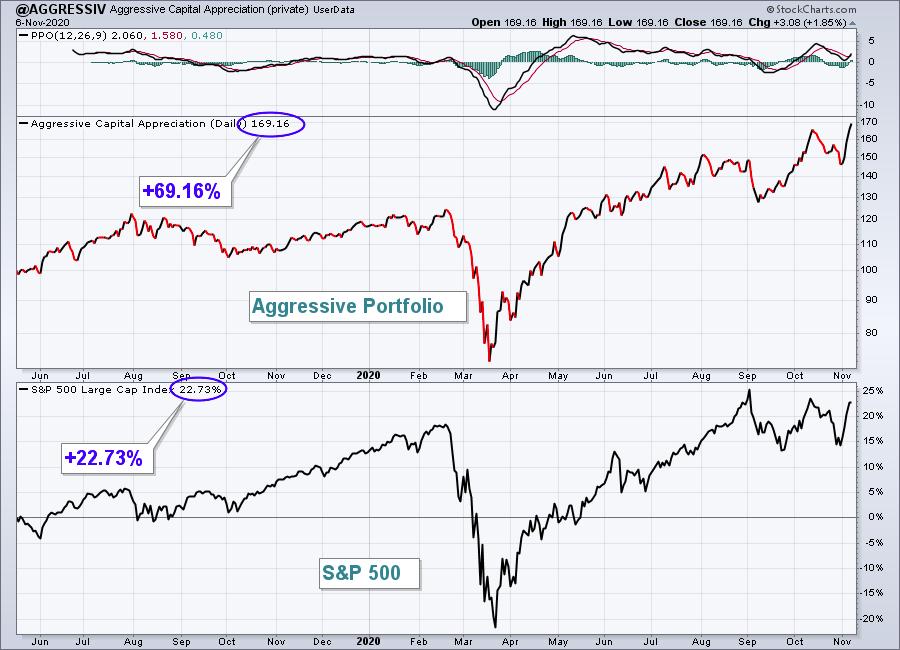
Aggressive Portfolio:
Current quarter (since 8/19/20): +14.56% (S&P 500: +3.99%)
Since inception on 5/19/19: +69.22% (S&P 500: +22.73%)
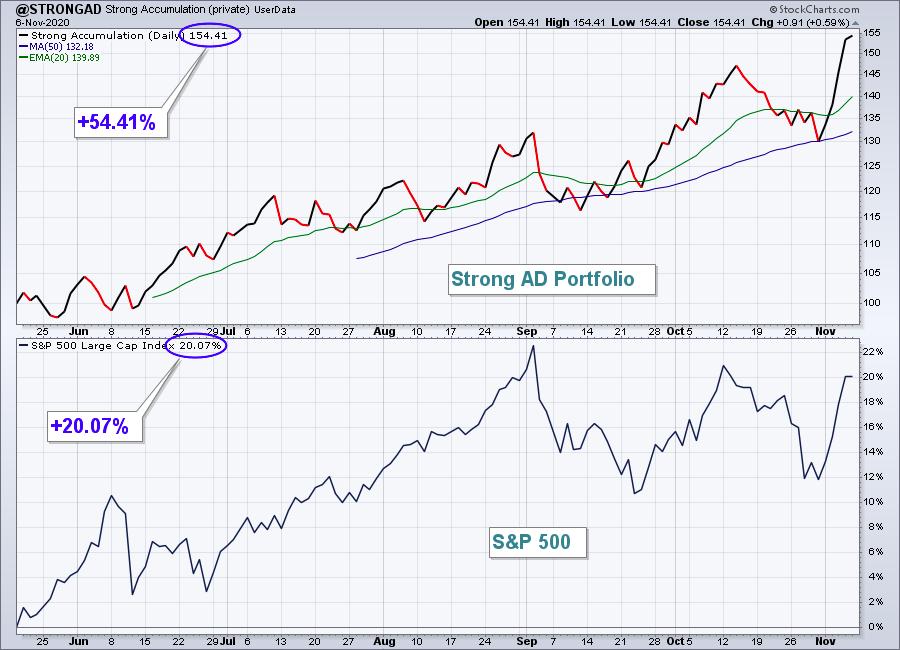
Strong AD Portfolio:
Current quarter (since 8/19/20): +29.38% (S&P 500: +3.99%)
Since inception on 5/19/20: +54.41% (S&P 500: +20.07%)
The S&P 500 has not broken out above its September high, yet the above 3 EarningsBeats.com portfolios have done just that.
We have two other portfolios at EarningsBeats.com as follows:
Income Portfolio:
Current quarter (since 8/19/20): +4.89% (S&P 500: +3.99%)
Since inception on 5/19/19: +15.06% (S&P 500: +22.73%)
We didn't set any records with the Income Portfolio, but it did manage to outperform the S&P 500 last week.
Model ETF Portfolio:
Since inception on 10/19/20: +2.78% (S&P 500: +2.41%)
This portfolio was just created on October 19, 2020. There are 8 different ETFs in this portfolio, each of which owns many stocks. Because of the heavier load of stocks, I don't expect this ETF portfolio to crush the S&P 500, but our goal is to beat it.
Special Event - Strategic Investing
On Monday, November 9th at 4:30pm ET, I'll be hosting a FREE webinar, "Top 10 Stocks: Sneak Preview". I will discuss my "top down" strategy of creating these portfolios, which now has a consistent track record of solidly outperforming the benchmark S&P 500 index. If you'd like to sign up for our FREE EB Digest newsletter and register for this event, CLICK HERE for more information.
Below is a sample Daily Market Report that our EarningsBeats.com subscribers receive every day that the stock market is open. Enjoy!
Executive Market Summary
- Futures were lower this morning as Wall Street looked to book some profits
- Selling has not been intense, however, as the S&P 500 was exactly FLAT just before 2pm ET; the Dow Jones is down just 60 points, while the NASDAQ clings to a minimal gain
- October nonfarm payrolls did exceed forecasts, but it wasn't enough to extend the recent rally
- There is selling in the bond market, however, as the 10-year treasury yield ($TNX) is up 4 basis points
- Most sectors are within a +0.5% to -0.5% range today, with one notable exception - energy (XLE, -2.20%)
- Crude oil prices ($WTIC) are tumbling again, this time down more than 4% to $37 per barrel
- COVID-19 cases are mounting and the U.S. presidential election seems far from over, yet the VIX has tumbled 16 points this week back to 25; the big drop in fear supports rising equity prices
- Trade Desk (TTD, +26.58%) is surging after blowing past revenue & EPS estimates
Market Outlook
I've spent a lot of time in 2020 discussing the outperformance of the NASDAQ and NASDAQ 100 vs. the benchmark S&P 500. Well, mid-caps have been gaining ground on the S&P 500 the past two months, though they still have plenty of relative work to do:

I'd continue to stay away from small- and mid-cap stocks, at least until they're able to negotiate their June relative highs. That's also the high that I'm watching on my Pandemic Index, an index of the worst performing industries during the COVID-19 pandemic. We're not close to breaking out on that Pandemic Index either. Here's the latest:
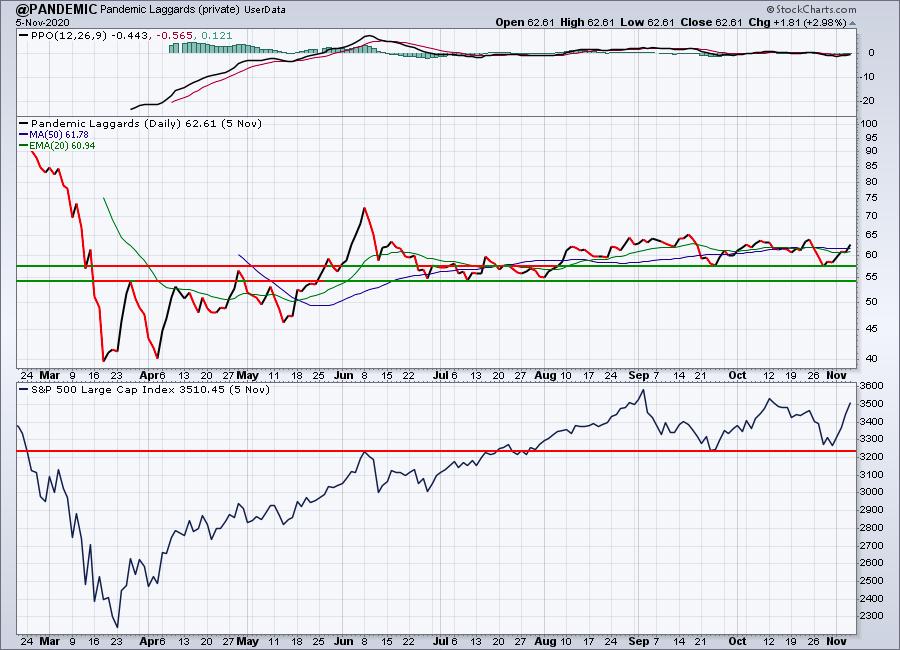
Support on the Pandemic Index is holding, but that June peak still seems like light years away. Wall Street continues to avoid many of the industries that suffered the most throughout this pandemic, so we will too. Eventually, they'll show relative strength and leadership, but until they do, let's stick with what's working.
Sector/Industry Focus
It's never a bad thing to see semiconductors ($DJUSSC, +1.33%) breaking out. That's what we're seeing today. There are plenty of solid semiconductor companies to choose from, but both Microchip (MCHP) and Applied Materials are attempting to right their relative ships with breakouts:
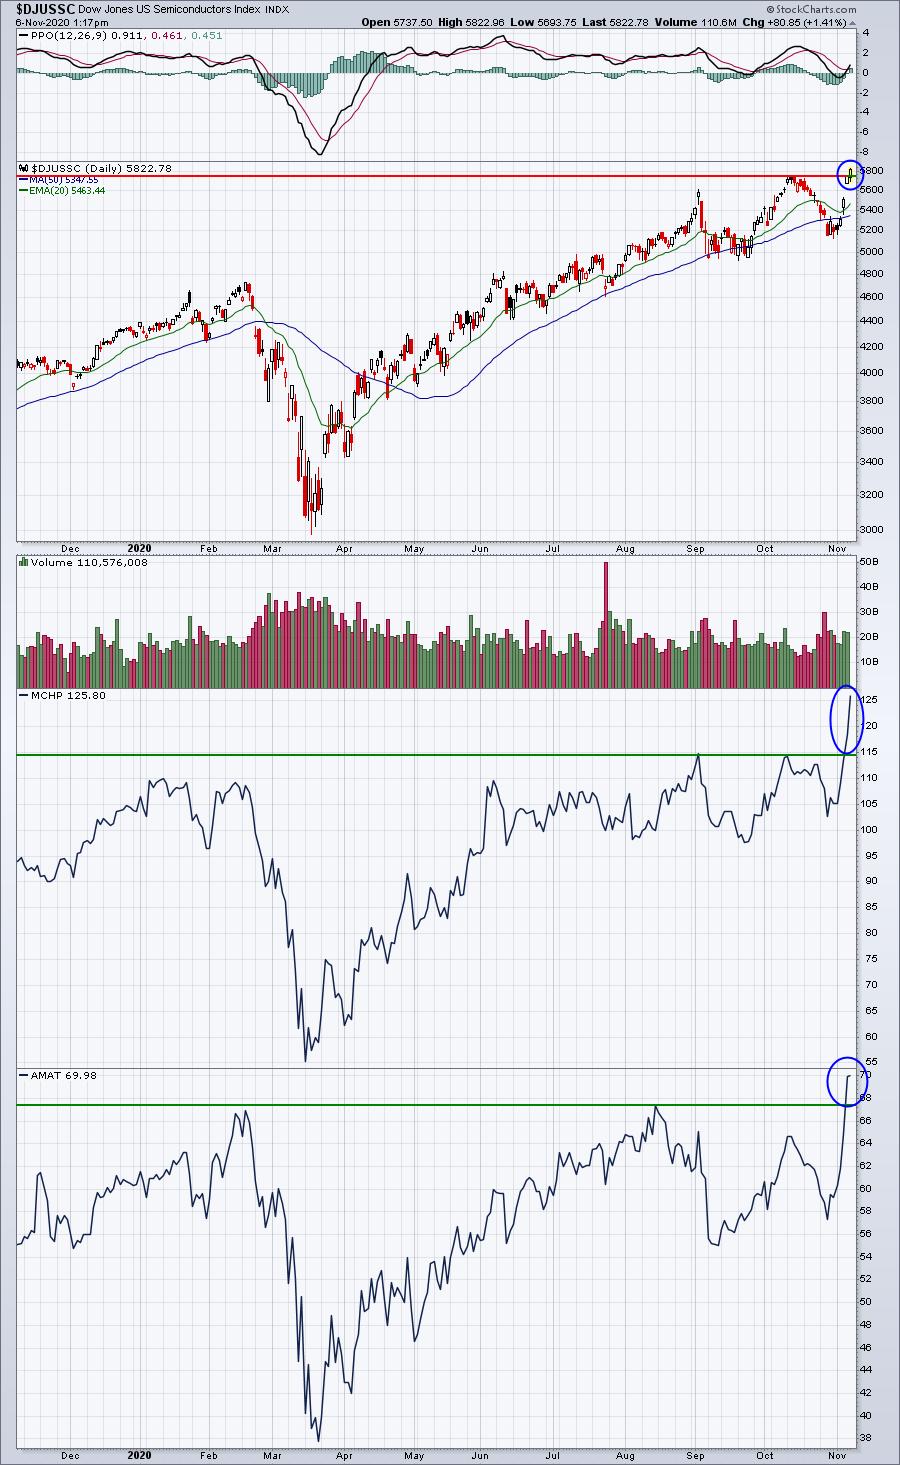
I expect the DJUSSC to continue leading, although we must be careful after November passes. The DJUSSC loves November, but December? Not so much.....
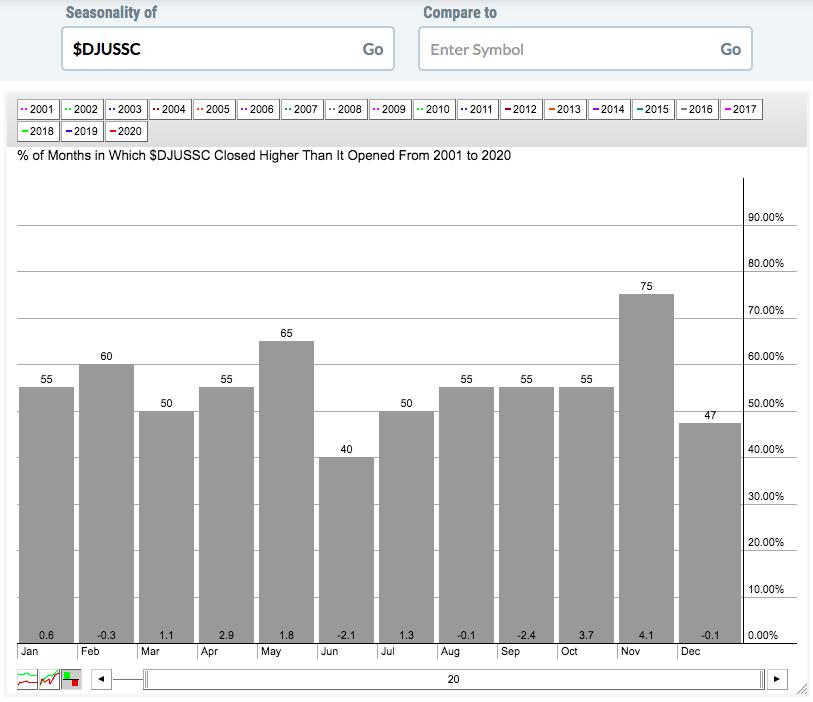
The average November return over 20 years has been 4.1%. But December has been flat over the same 20 years. And January and February don't exactly hit the ball out of the park. So let's enjoy this breakout and short-term run, but be careful about expecting too much as move toward the end of the year.
ChartLists/Strategies
Well, there's less than two weeks before we "draft" our new portfolio stocks. Most stocks in our portfolios have now reported and I've highlighted 4 below that have produced stellar results and Wall Street reactions. There's a good chance you'll see these 4 in our new portfolios when they're announced on November 19th:
PINS:
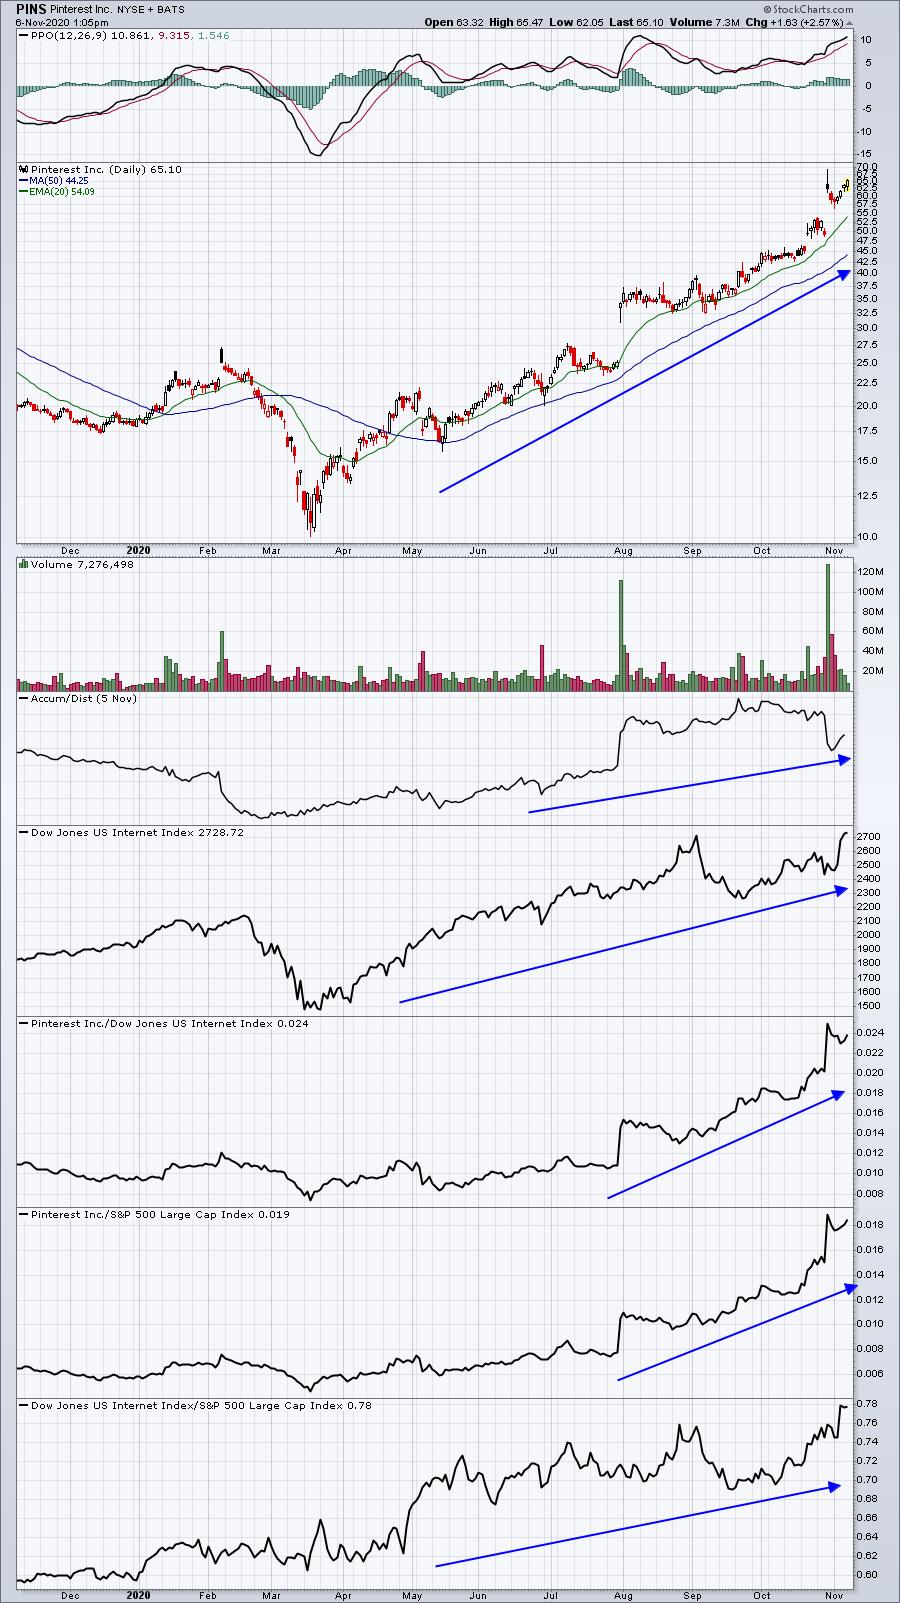
Is there a better internet stock right now? I think there's a chance that we could move back into the 50s one more time, but three months from now? I expect it'll be higher.
NET:
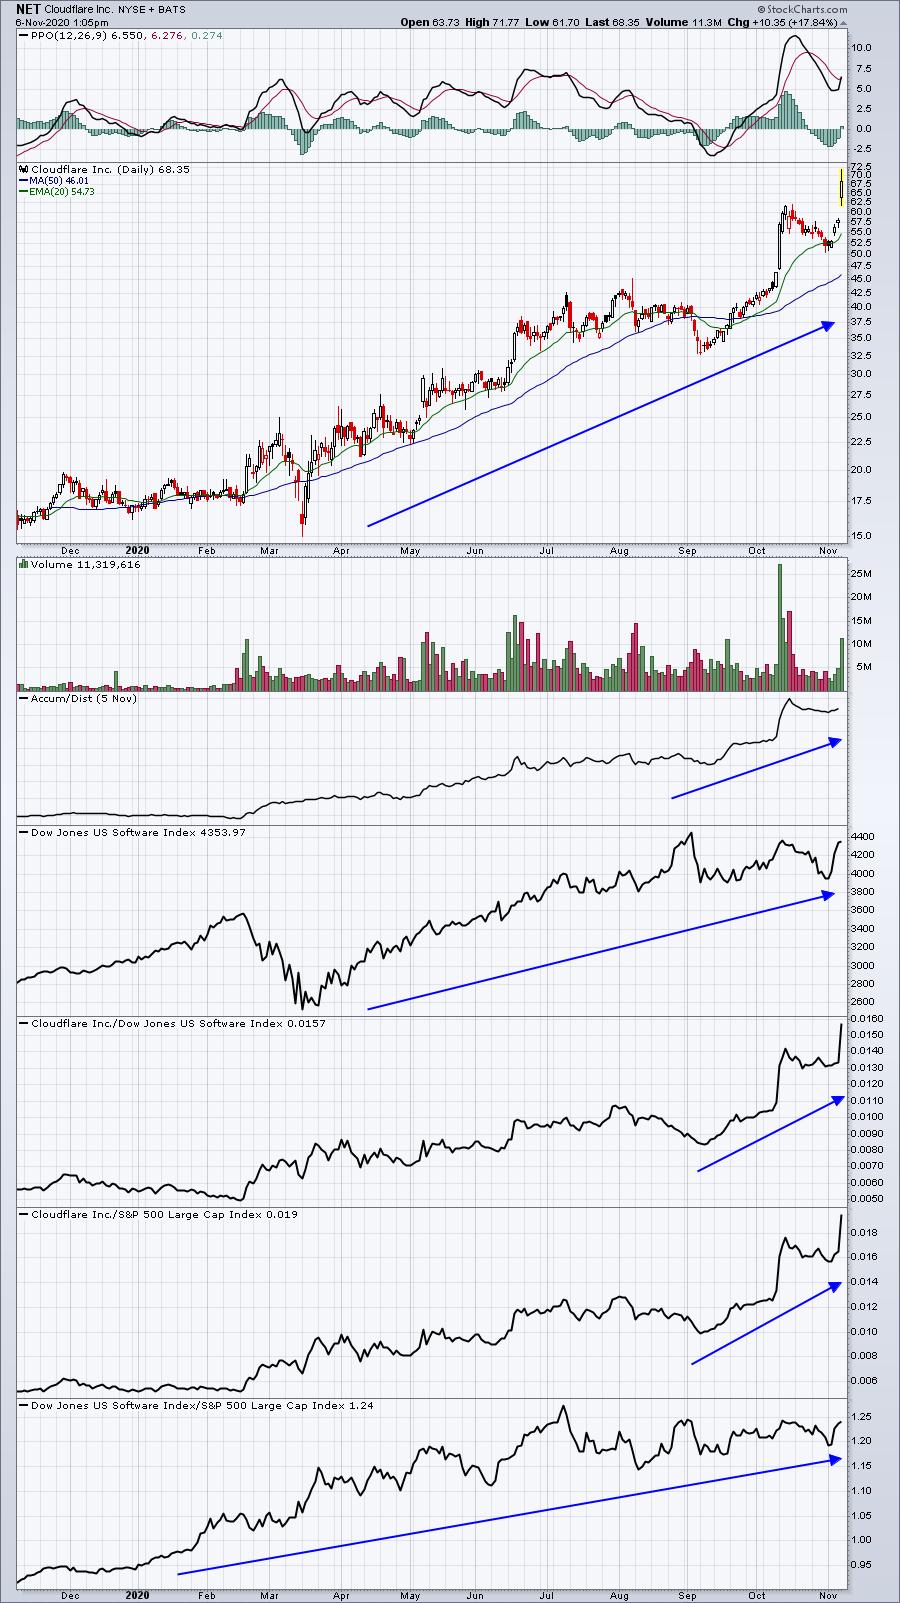
This leading cloud stock is poised for further gains. We could see a period of consolidation after such a big run, but there's likely more in the tank.
QCOM:
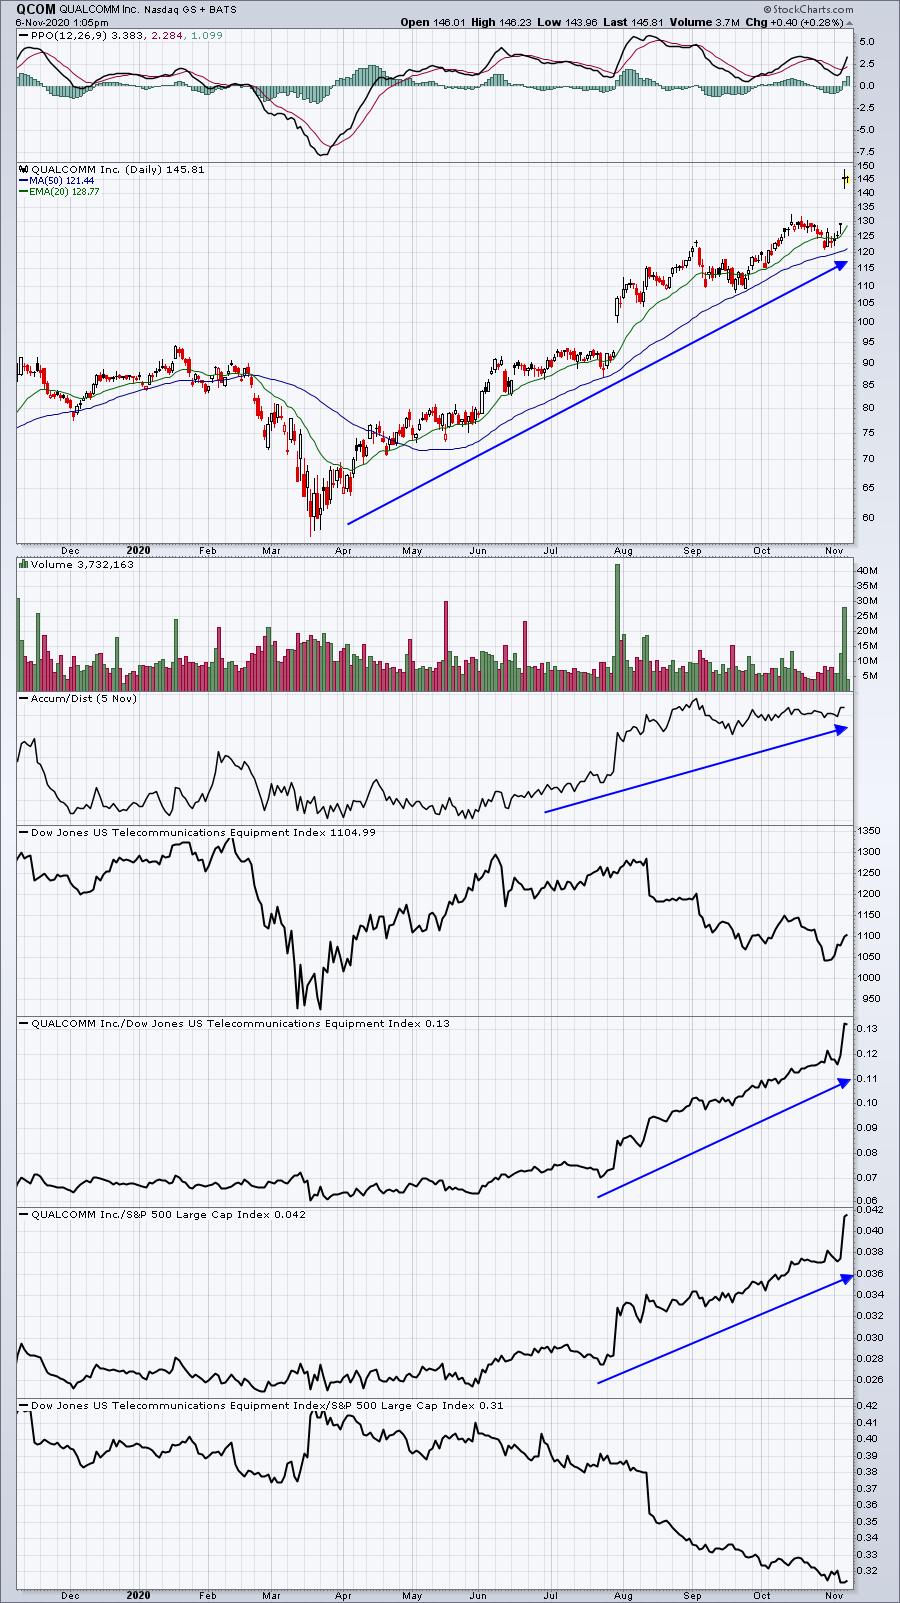
QCOM really didn't participate in much of this bull market. In April, it was trading at the same level that it was in 2014. The stock is playing catch up and I don't believe the game is over. The one downside to QCOM is the rough relative performance of the telecom equipment space in general.
YETI:
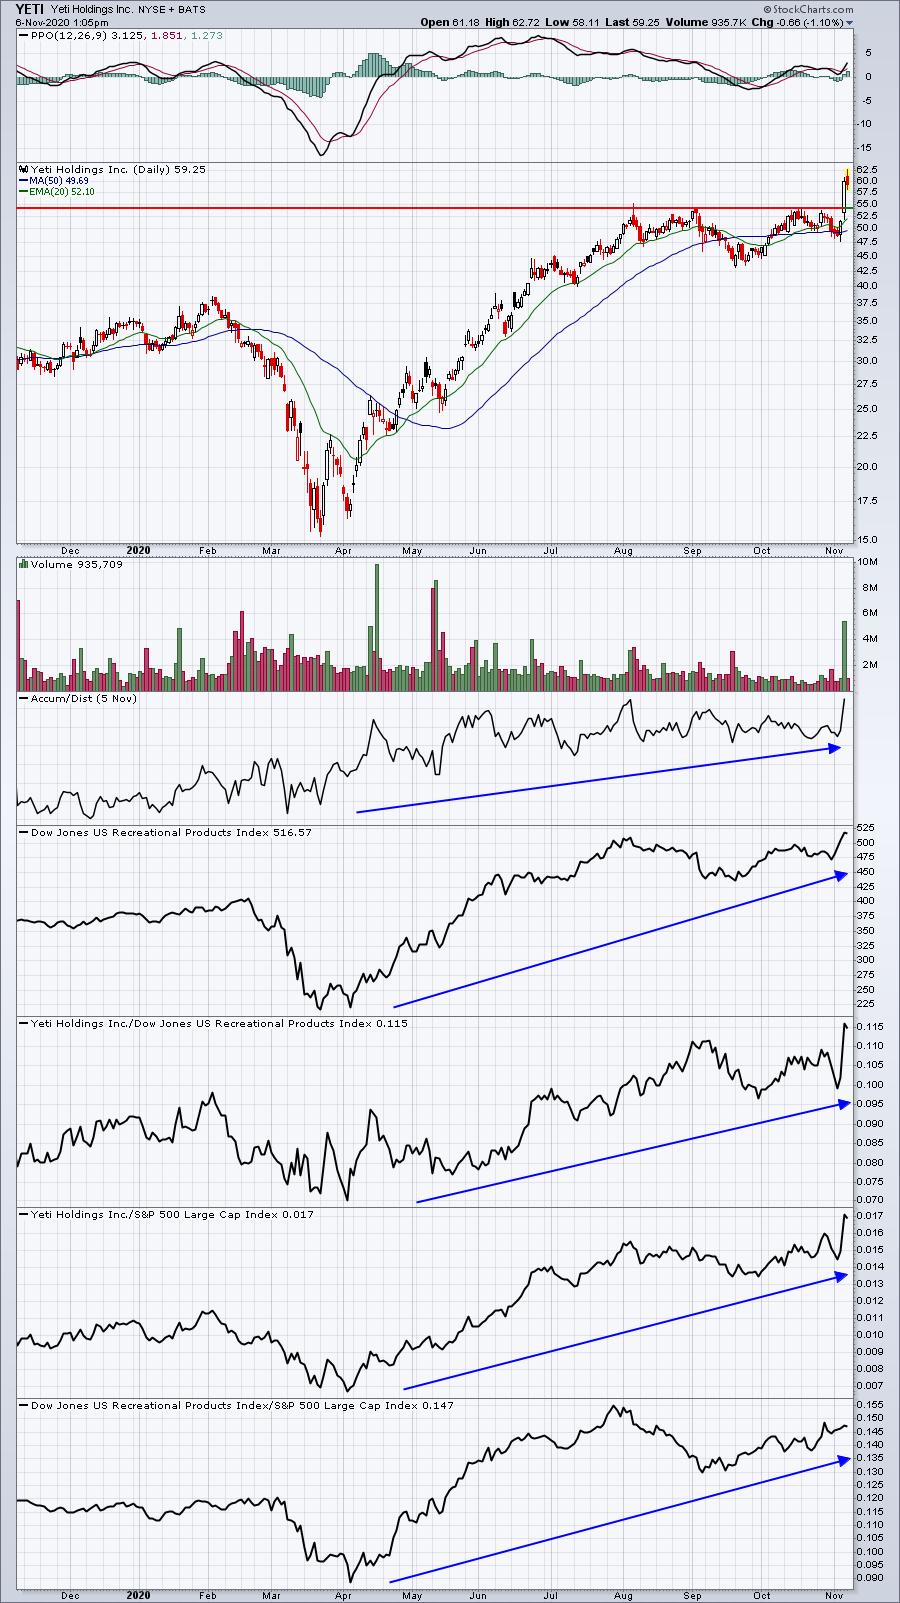
I love consumer discretionary and YETI may be one of the most impressive stocks in the space right now. Their numbers and earnings growth justify a higher multiple and higher valuation. In time, I think we'll get it.
Earnings Reports
Here are the key earnings reports for the next two days, featuring stocks with market caps of more than $10 billion. I also include a few select companies with market caps below $10 billion. Finally, any portfolio stocks that will be reporting results are highlighted in BOLD. If you decide to hold a stock into earnings, please understand the significant short-term risk that you are taking. Please be sure to check for earnings dates for any companies you own or are considering owning.
Friday, November 6:
CVS, ENB, MAR, HSY, ZBH, TU, VIAC, VTR, MGA, DISH, AES, ELAN, LNG, IEP, MYL, HRC
Monday, November 9:
MCD, RNG, XP, WPM, SPG, BKI, BIP, OSH, IFF, NBIX, BYND, OXY, NKLA, PLUG, NVAX, RAMP, NCLH, AL, DIOD, TGNA, SPT, WKHS, INO, ELY, NSTG, TLRY, NLS, GOGO, CARS, ACB
Economic Reports
October nonfarm payrolls: 638,000 (actual) vs. 575,000 (estimate)
October private payrolls: 906,000 (actual) vs. 650,000 (estimate)
October unemployment rate: 6.9% (actual) vs. 7.7% (estimate)
October average hourly earnings: +0.1% (actual) vs. +0.2% (estimate)
Happy trading!
Tom


