Special Note
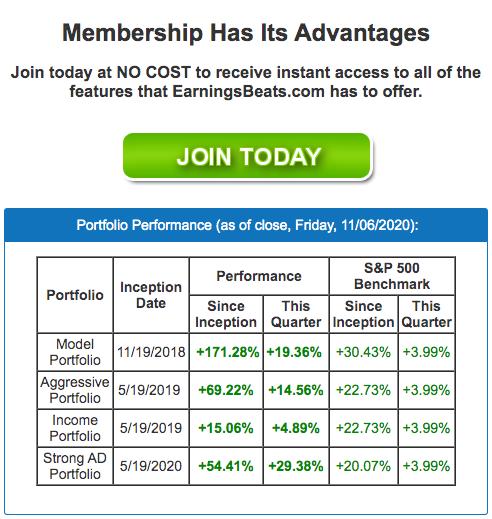
This is a weekly portfolio report that I send to our EarningsBeats.com members every Sunday. It's designed to provide a summary of our portfolio performance over the past week, highlighting the stocks that have led our portfolios higher (or lower). From our website, here's a quick performance snapshot of our four portfolios:
On Monday, November 9th, at 4:30pm, I'm hosting a "Sneak Preview: Top 10 Stocks" webinar to provide everyone a look at our unique strategy that has consistently been crushing the benchmark S&P 500. To register for this event, which is completely free, you simply need to join our EB Digest newsletter and become a part of our community, which numbers in the tens of thousands. The newsletter is also completely free, there's no credit card required, and you may unsubscribe at any time. To learn more information about the event and to register, CLICK HERE.
Below is a complimentary sample of this week's, "EB Weekly Portfolio Report". I hope you enjoy it!
Upcoming Earnings Reports
According to Zacks.com, the following companies will be reporting earnings this week and each is a component of one of our portfolios:
Monday, November 9: None
Tuesday, November 10: None
Wednesday, November 11: None
Thursday, November 12: None
Friday, November 13: None
PLEASE NOTE: The above companies were provided after scanning the Zacks Earnings Calendar. My research is limited to what Zacks provides and I also can make a mistake from time to time, so please check for earnings dates for all companies that you own. We do hold our portfolio stocks through one earnings report, but every EarningsBeats.com member must make their own investing/trading decisions about holding stocks into earnings reports as it's the most volatile (risky) time to own a stock.
Portfolio Rules and Objectives
Here are the common traits and objectives of our portfolios:
- There are 10 leading stocks from up to 10 leading industries in each portfolio (at the time of selection). Generally, there will only be one stock per industry group, but there could be exceptions.
- They are held for an entire 90 day period, with no stops in place. We strive for consistency, transparency, and simplicity in our portfolios. EB.com members may hold these stocks for the entire 90 days, trade them, use stops, etc., but for purposes of our calculation, we will make no exceptions to our "buy and hold for three months" strategy.
- Every stock will generally be held through ONE earnings report
- The expectation is that relative winners will carry the portfolio to outperformance
- They were all entered into as of the close on Wednesday, August 19th; members may choose to try to time better entries, but EB.com will "purchase" as of August 19th's closing price
- Primary objective is to outperform the benchmark S&P 500
Here are several considerations for EB members:
- I would expect the Strong AD and Aggressive portfolios to be the riskiest, followed by the Model portfolio, and then the Income portfolio
- The Strong AD portfolio will be selected from a combination of rising accumulation/distribution lines and SCTRs above 80 at the time of selection. It is the only portfolio that does NOT require a revenue and EPS beat in its most recent quarterly earnings report
- The Income portfolio stocks will all pay dividends, with the expected average dividend yield to be at least 1.5%
- Drawdowns (losses) should be much milder on the Income portfolio, with more volatility expected on the other three; please review inception-to-date charts below to gain an idea of the volatility associated with each
- I believe the larger drawdown on the Income portfolio at the beginning of the pandemic was an anomaly, occurring as many defensive, higher-yielding companies uncharacteristically underperformed during a market decline.
- You should own or trade these stocks in whatever manner is most comfortable for you; while we will buy all 10 stocks in the manner identified above, feel free to trade certain stocks or wait for pullbacks if the stocks are overbought
- We have no idea what risk each member is willing or able to take. We are not registered investment advisors so be sure you understand the risk you take. Please consult your financial advisor.
- EarningsBeats.com shareholders/employees may own all or some of the portfolio stocks from time to time.
Weekly Snapshot
Here's a weekly recap:
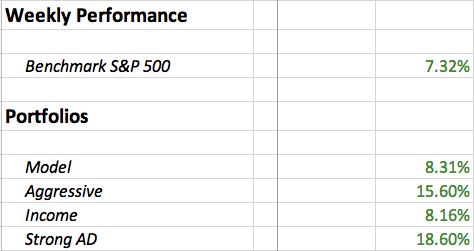
Our portfolios bounced back very nicely, with each outperforming the S&P 500 during last week's rebound. As discussed last week, the Volatility Index ($VIX) topped, which in turn coincided with the S&P 500 bottoming. VIX readings in the 40s have resulted in MAJOR stock market bottoms since the early-1990s, with only two exceptions - the 2008 financial crisis and the 100-year pandemic in 2020. Other than those two times, a topping VIX in the 40s marks bottoms in U.S. equities. Here's the chart to illustrate this point:
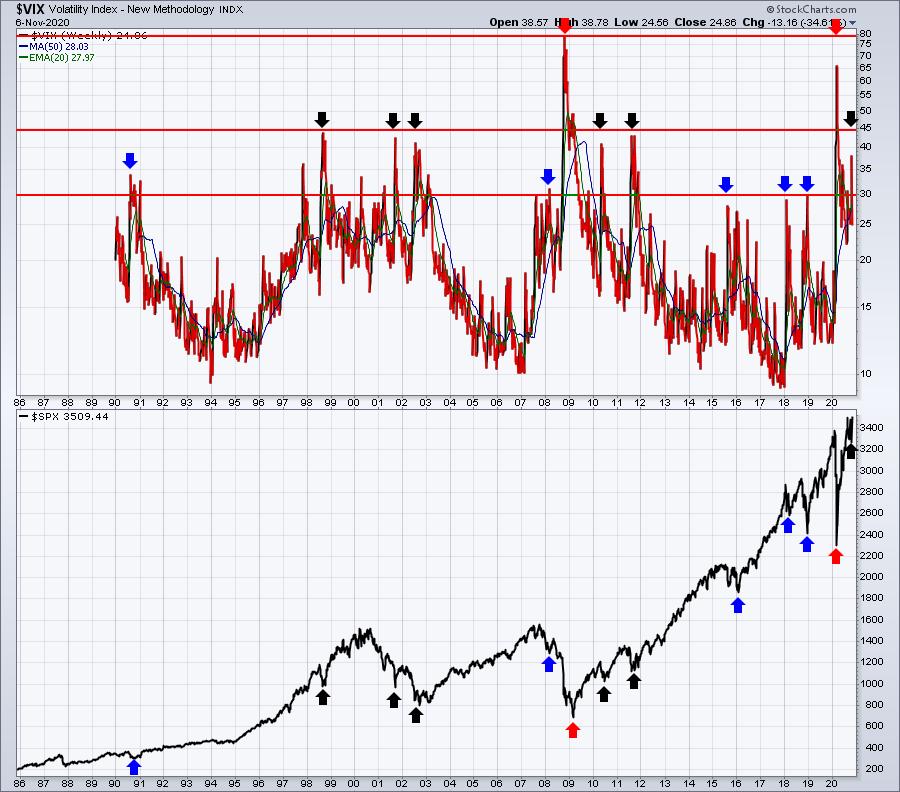
The above chart is a weekly chart, so it only shows the Friday close. We did, however, see a VIX top of 41.16 on October 29th. The black arrows highlight the VIX tops and S&P 500 bottoms.
Weekly Summary
Benchmark S&P 500:
The S&P 500 hit an intraweek low that neared the 3200-3225 key price support that I had discussed recently. Fortunately, the VIX topped, the S&P 500 bottomed, and we saw an explosive rally during the most bullish historical period of the year (October 27th close to November 6th close). The S&P 500's rally of 7.32% was fairly close to what I'd call a good year. The average annual return on the S&P 500 since 1950 is approximately 9%.
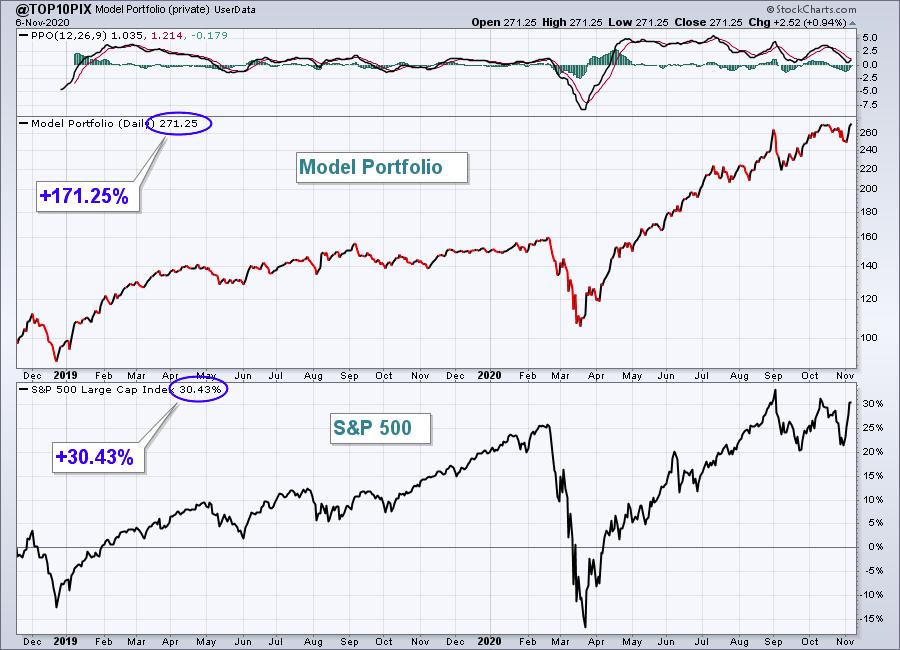
Model Portfolio:
The Model portfolio gained an impressive 8.31%, breaking to an all-time high and stretching its quarterly and since-inception lead over the benchmark S&P 500. Here's the updated inception-to-date chart of the portfolio:
Here are how the Model portfolio component stocks performed last week:
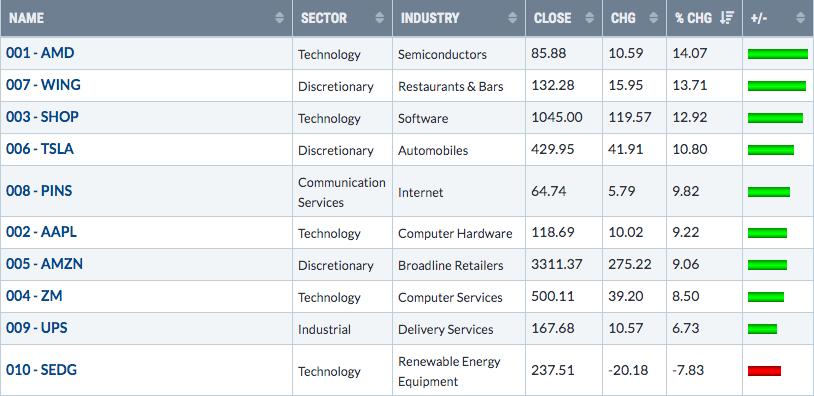
It was a strong week for our Model Portfolio component stocks - with one exception (SEDG). While SEDG reported EPS well ahead of estimates (1.21 vs .81), they came up short on revenues (338.1 million vs 341.9 million) and it spooked investors:
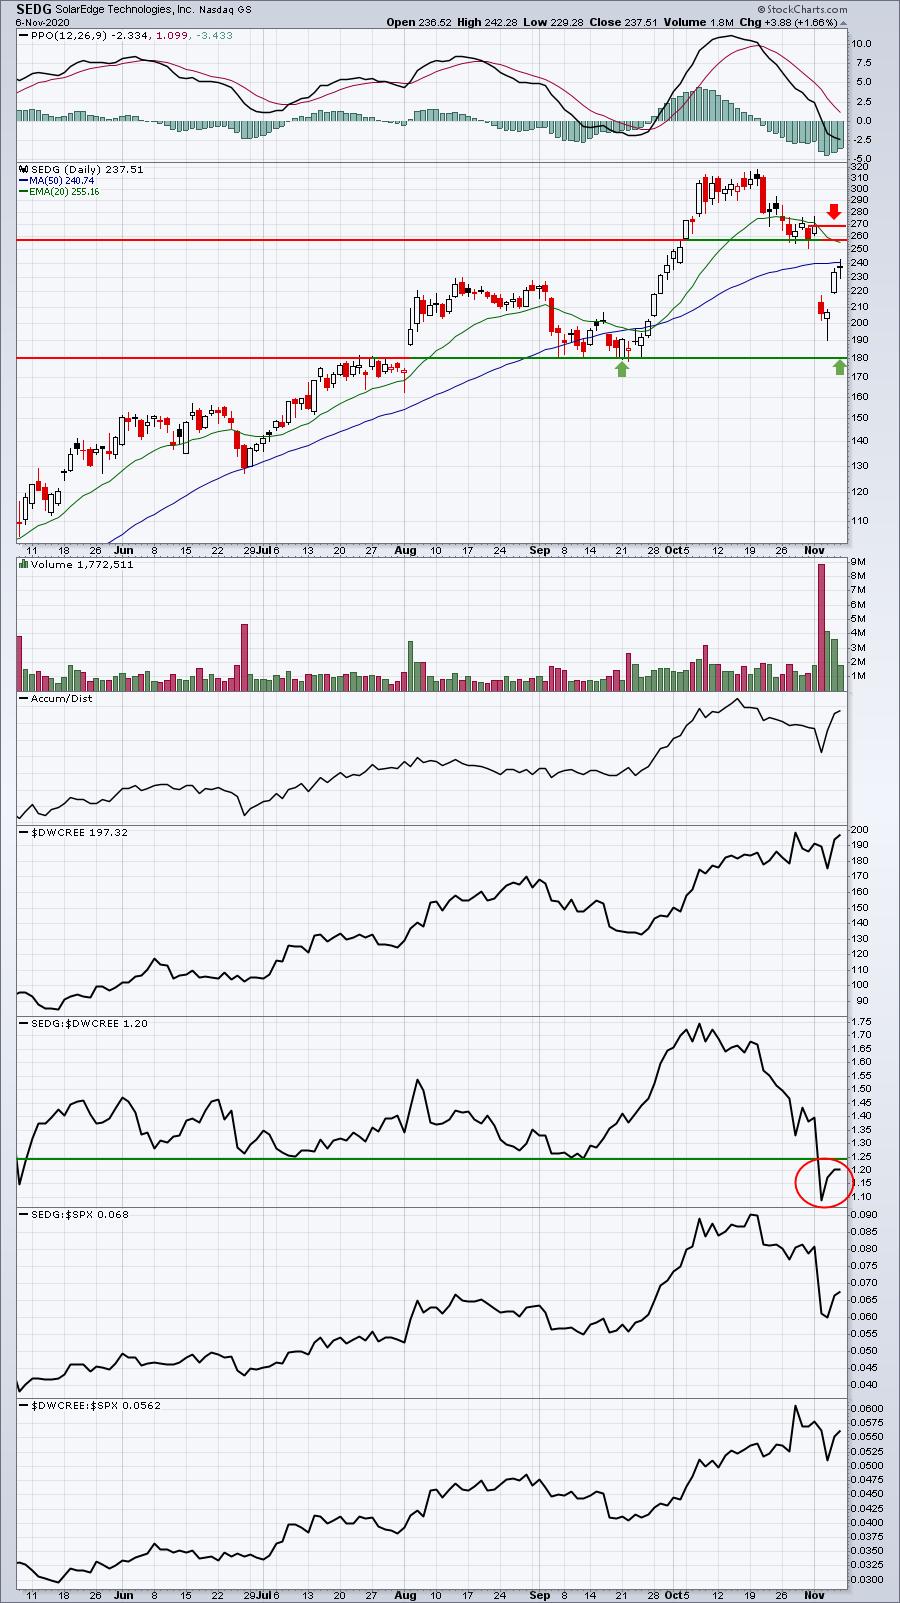
I've annotated the key support and resistance levels. We'll continue to hold SEDG until November 19th, as we do every stock, but it's likely to feel selling pressure if it can make it back to the 250-270 resistance. If I'm being perfectly honest, I never like to see a stock move to a 52-week relative low vs. its industry peers and SEDG has done that. There are exceptions to every rule, however, and QDEL moved to a fresh relative low before soaring back to the upside. ENPH did that in a recent portfolio as well.
Aggressive Portfolio:
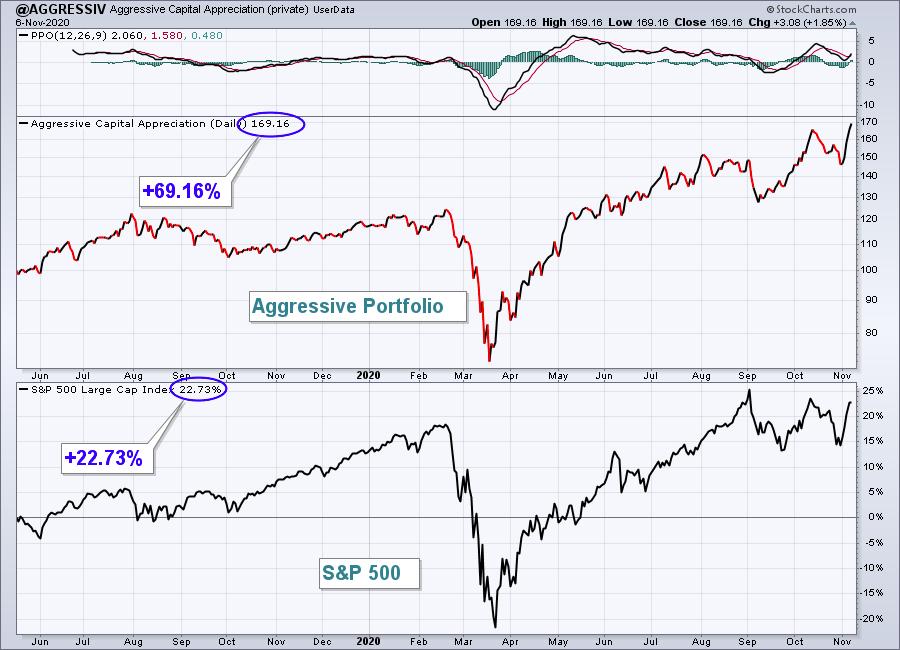
The Aggressive portfolio soared 15.60% to close at an all-time high, crushing the S&P 500 last week.
Here's the Aggressive portfolio chart since its inception on May 19, 2019:
Here are how the Aggressive portfolio component stocks performed last week:
ACMR rebounded beautifully last week and reclaimed a key price level by moving through gap resistance:
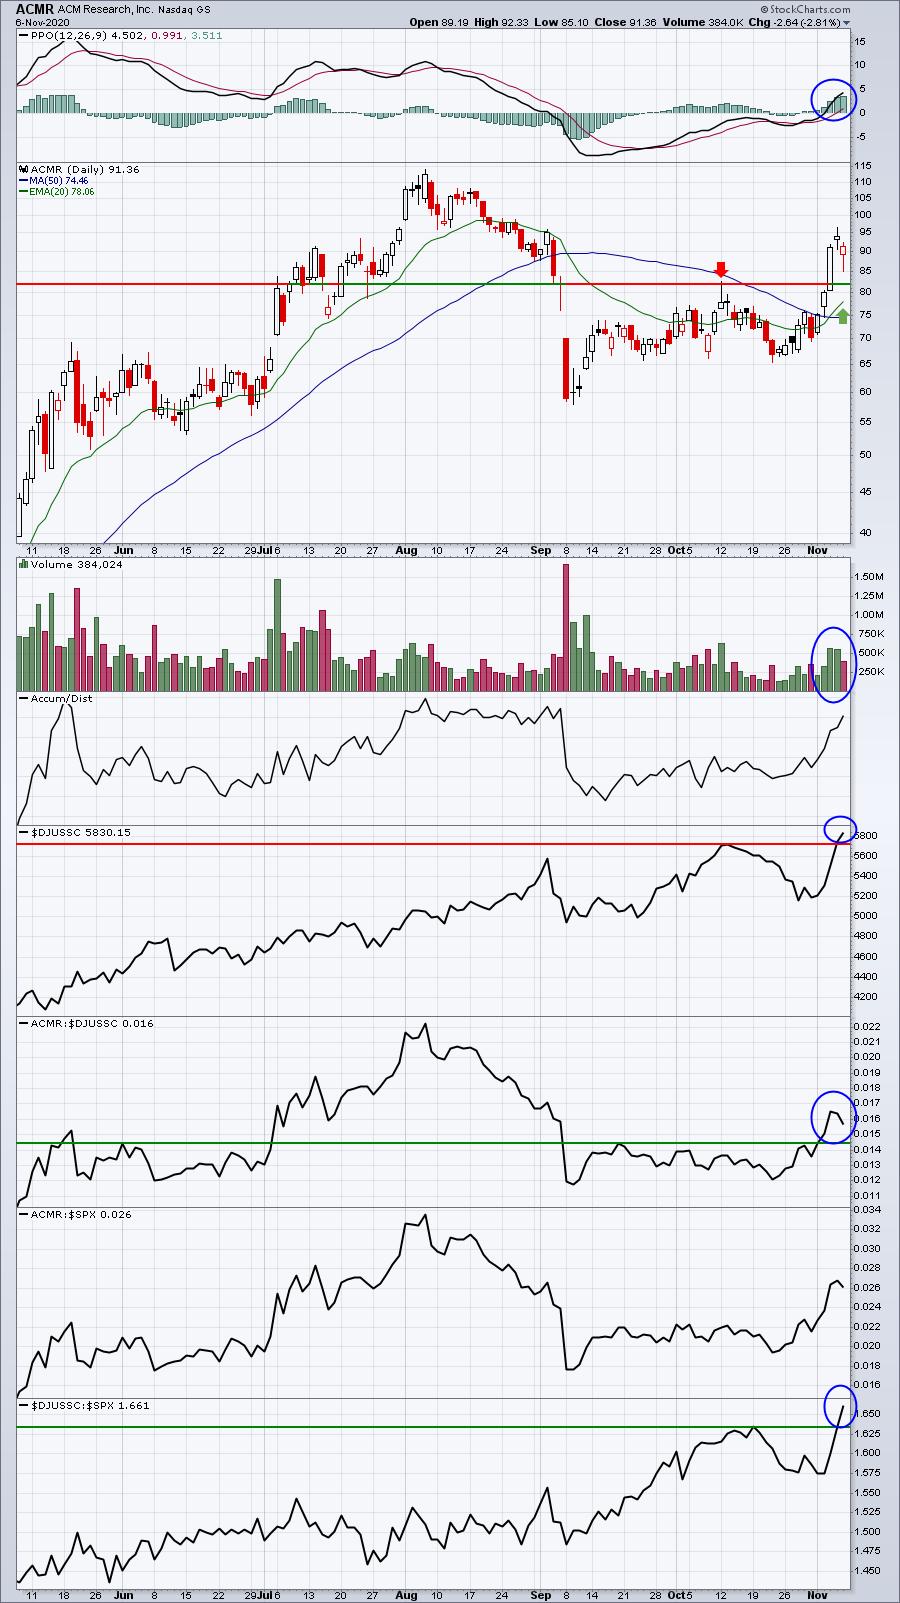
The blue circles are all bullish. ACMR is part of an exceptionally-strong semiconductor group ($DJUSSC). It's begun to show relative strength vs. its peers and the continuation of that is what I want to see. Any pullback should hold the rising 20 day EMA.
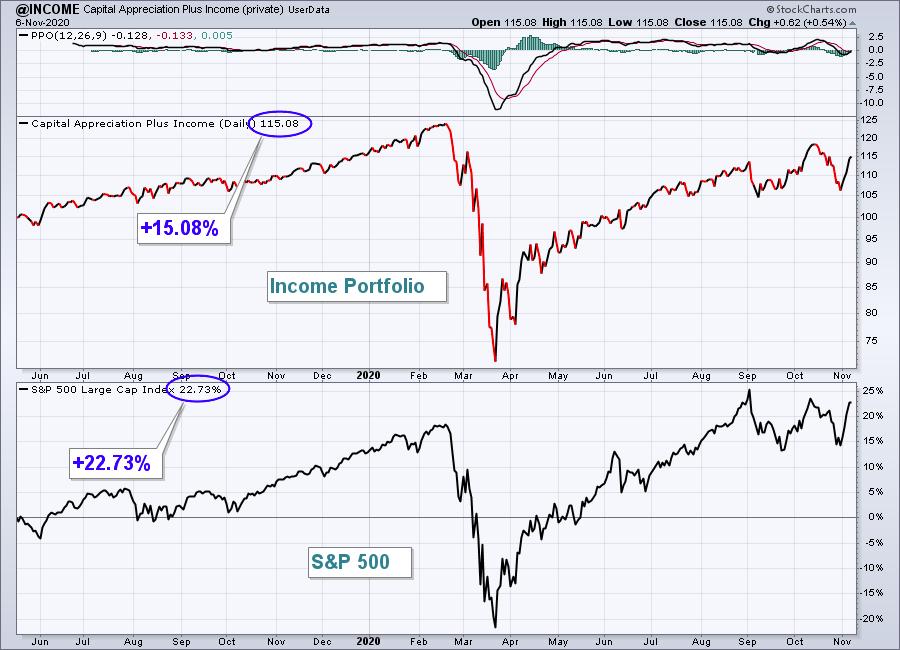
Income Portfolio:
The Income portfolio jumped 8.16% last week, closing its performance gap on the S&P 500. Here's a look at the inception-to-date chart:
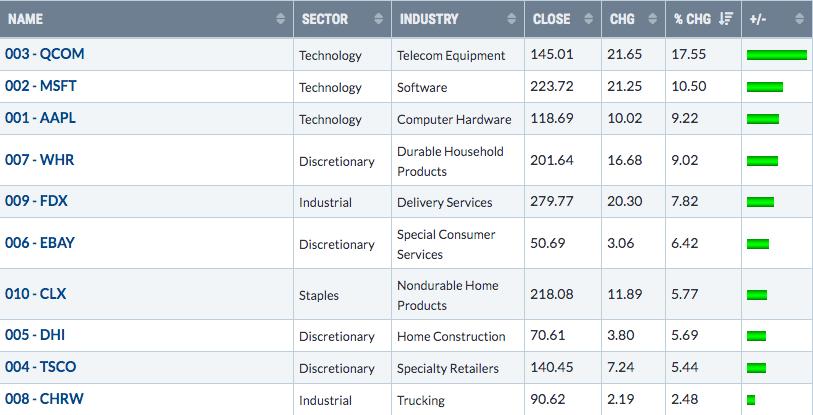
Here are how the Income portfolio component stocks performed last week:
QCOM blew away revenue and earnings estimates in one of the best earnings reports of the quarter...to date. It's also very important to realize that QCOM had consolidated for several years before breaking out in 2020. I see this one going much higher in time:
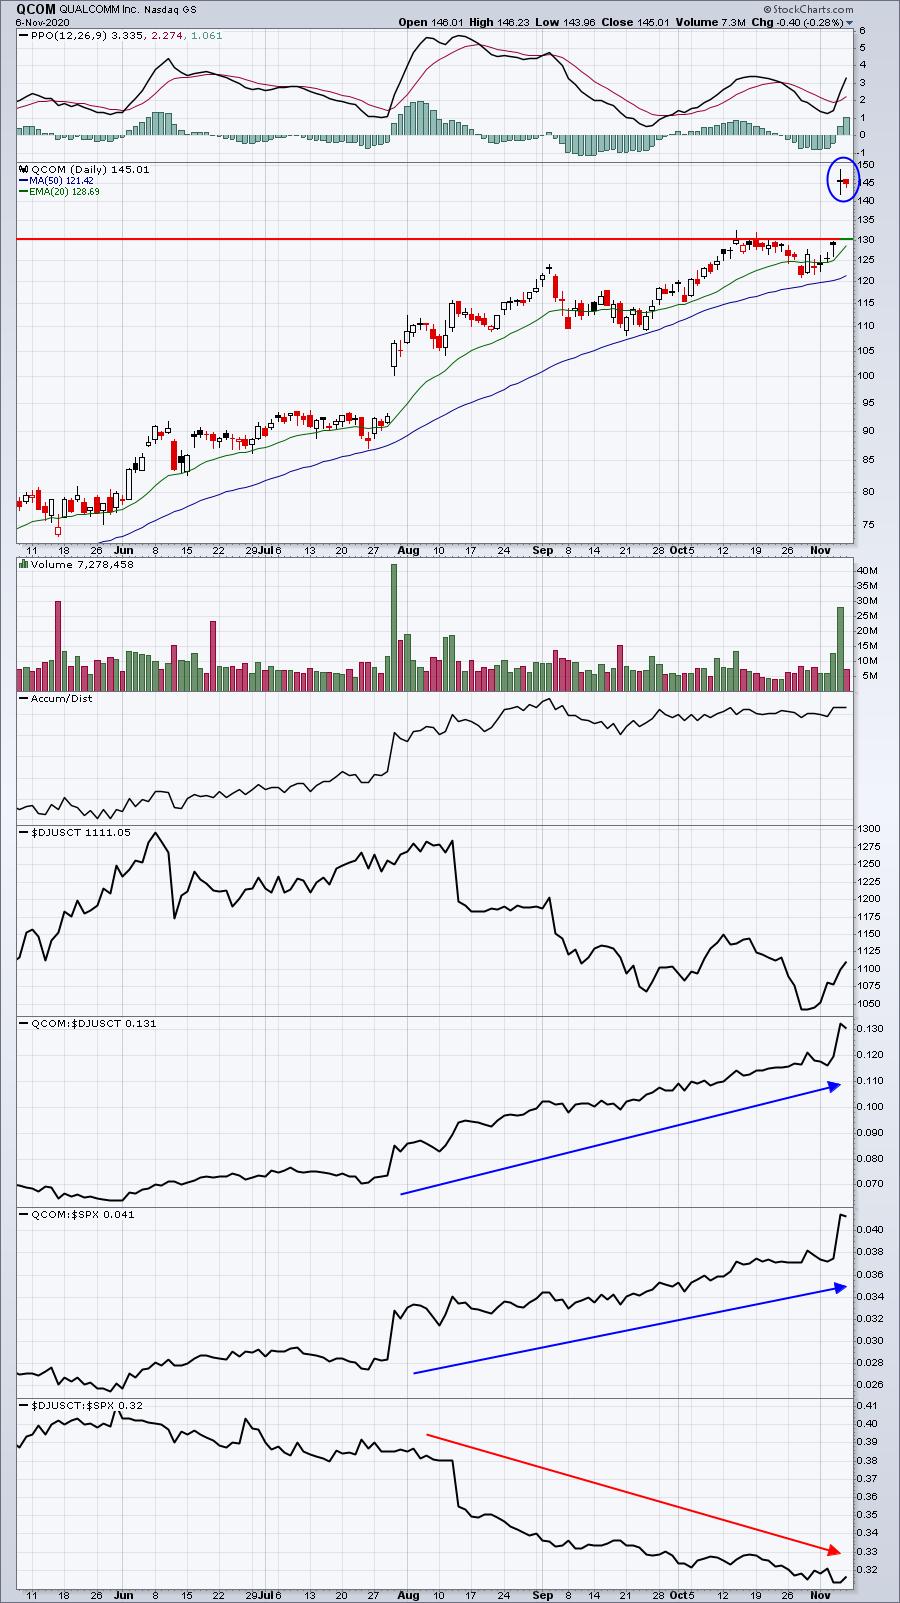
There's been some indecision (blue circle) after the huge gap higher, so I wouldn't be shocked to see some downside short-term, but ultimately I believe QCOM moves higher.
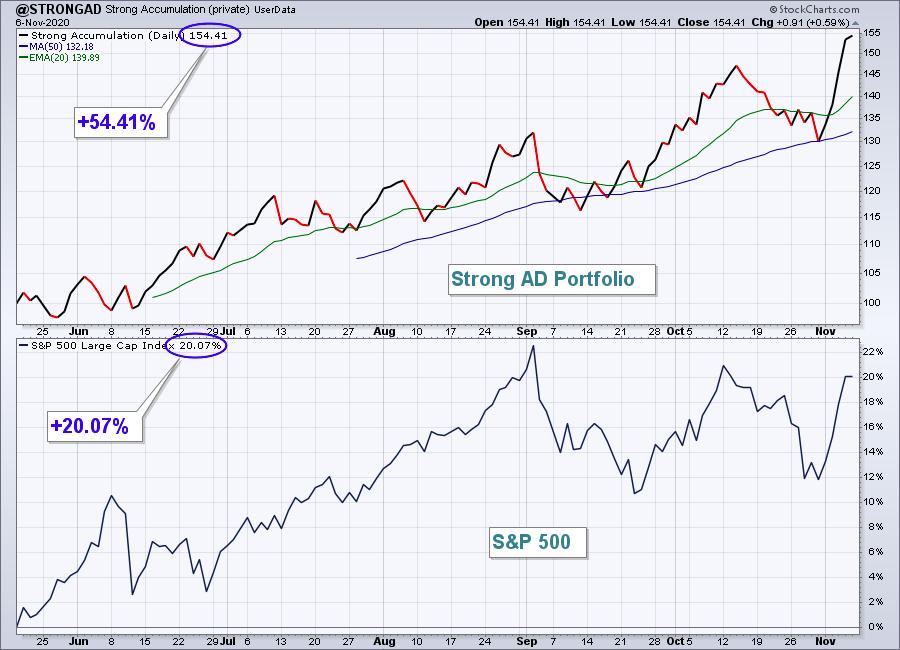
Strong AD Portfolio:
The Strong AD Portfolio rocketed higher by 18.60% and set a fresh all-time high, leaving the S&P 500 in its dust. Here's a look at the inception-to-date chart:
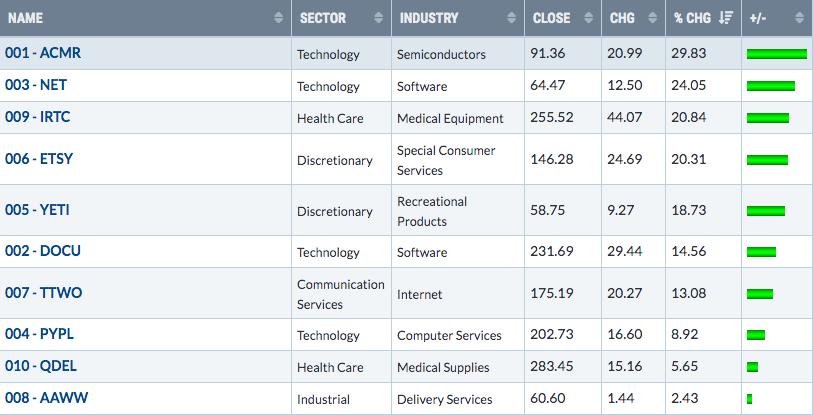
Here are how the Strong AD portfolio component stocks performed last week:
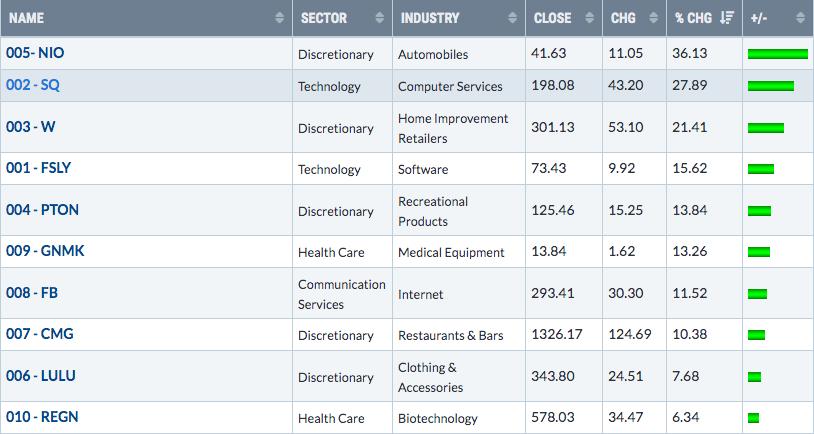
NIO surged again last week and is now up 200% in the past three months, becoming the best quarterly performer ever in any of our portfolios - assuming it holds up through November 19th. Here's the latest meteoric chart:
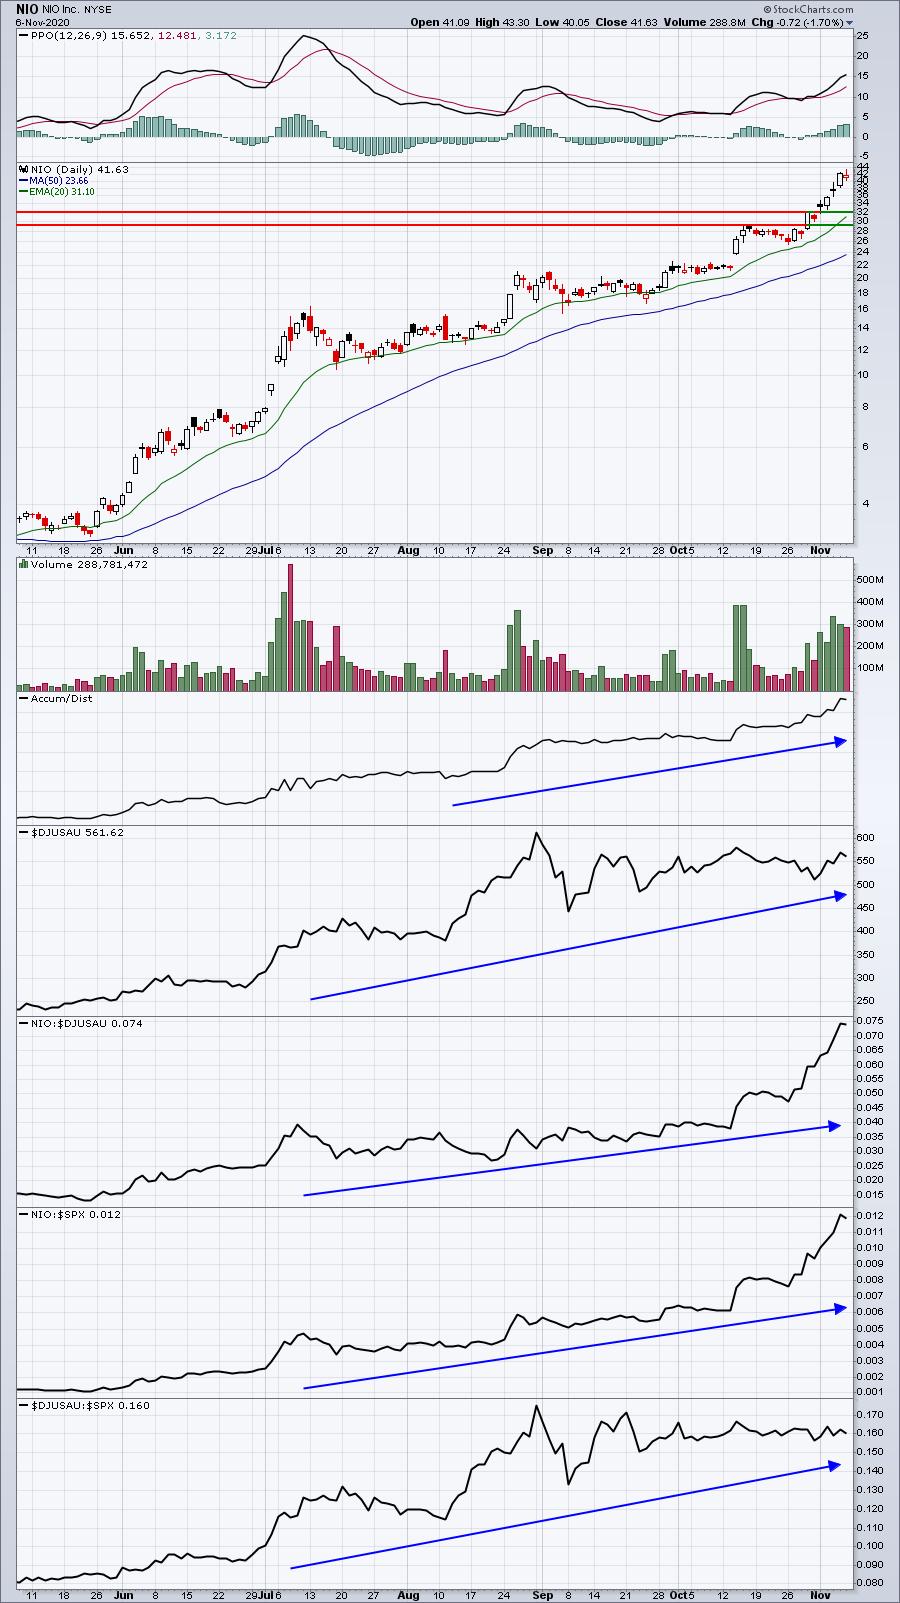
Massive volume has supported this move, combining both traders' enthusiam and institutional buying. If there's one issue here, it's the overbought nature of the chart after this parabolic-type rise. A potential selling episode back to a support zone in the 29-32 range should not be disregarded, although I believe there remains almost unquenchable thirst for the stock.
Summary
To state the obvious, U.S. equities came roaring back last week and I'd attribute much of it to the uncertainty that was lifted as a result of the election. We still don't know the winner, but I believe Wall Street was relieved that the "process" leading up to the election ended. The Volatility Index ($VIX), a measure of fear and anxiety, fell nearly 35% for the week. That encouraged buyers to return, which they did in droves and droves.
Both the S&P 500 and NASDAQ need another 2-3% gains to clear all-time highs, while the Dow Jones needs north of 4%. Those will be targets that the bulls will be looking to exceed this week and throughout November. Watch for leadership in industrials (XLI). Technology (XLK), consumer discretionary (XLY), and communication services (XLC) are already in leadership positions, with the latter breaking out above a relative triple top last week. Should industrials lead this next breakout in the S&P 500, it would represent 4 out of 5 of our aggressive sectors outperforming and leading during a bullish advance. That is typically a sign of sustainability and could help our major indices rally quite strong into year end and into 2021.
Model ETF Portfolio
We will likely issue a separate report on the Model ETF Portfolio either once or twice a month via our website, beginning later this year or to begin 2021. That's still under consideration. But we've now had this portfolio for three weeks and it had struggled a bit on a relative basis (vs. the S&P 500) as key concentration areas like online retail, transportation, home construction, and renewable energy had underperformed. As I mentioned last week, I expected that to change, and it did.
Here's how the Model ETF Portfolio component ETFs performed last week:
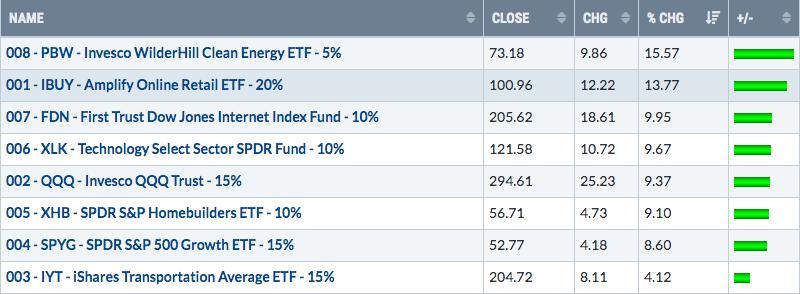
7 of our 8 Model ETF component stocks outperformed the S&P 500 last week, with only transports failing to do so.
Since our "draft" on October 19th, our Model ETF Portfolio has gained 2.78%, now outperforming the S&P 500, which has gained 2.41% over the same period.
Happy trading!
Tom Bowley, Chief Market Strategist
EarningsBeats.com
"Better timing. Better trades."


