There are a number of sentiment indicators in the stock market, but I prefer those that indicate the panic taking place "at the moment", rather than those depicting "feelings". So I've always used the Volatility Index ($VIX) and equity only put call ratio ($CPCE) and these two have had tremendous success in doing just that. Today, I'm going to focus on just the VIX.
Volatility Index ($VIX)
Investopedia defines the CBOE Volatility Index as "a real-time market index that represents the market's expectation of 30-day forward-looking volatility. Many call it the "Fear Index". In the most simplistic way, you should consider the VIX as a way to measure risk. High VIX readings suggest significant risk, while low VIX readings suggest minimal risk. The other correlation is that as the VIX rises, losses grow exponentially. A 10% jump in the VIX while at 15 might result in a 1% of less drop in the S&P 500. But a 10% jump in the VIX at 40 is more likely to coincide with a much steeper S&P 500 loss. The good news is that when the VIX finally peaks, the S&P 500 prints a significant bottom. The level of the VIX, however, indicates the significance of a market bottom. Let me illustrate first with a weekly chart from the past few years:
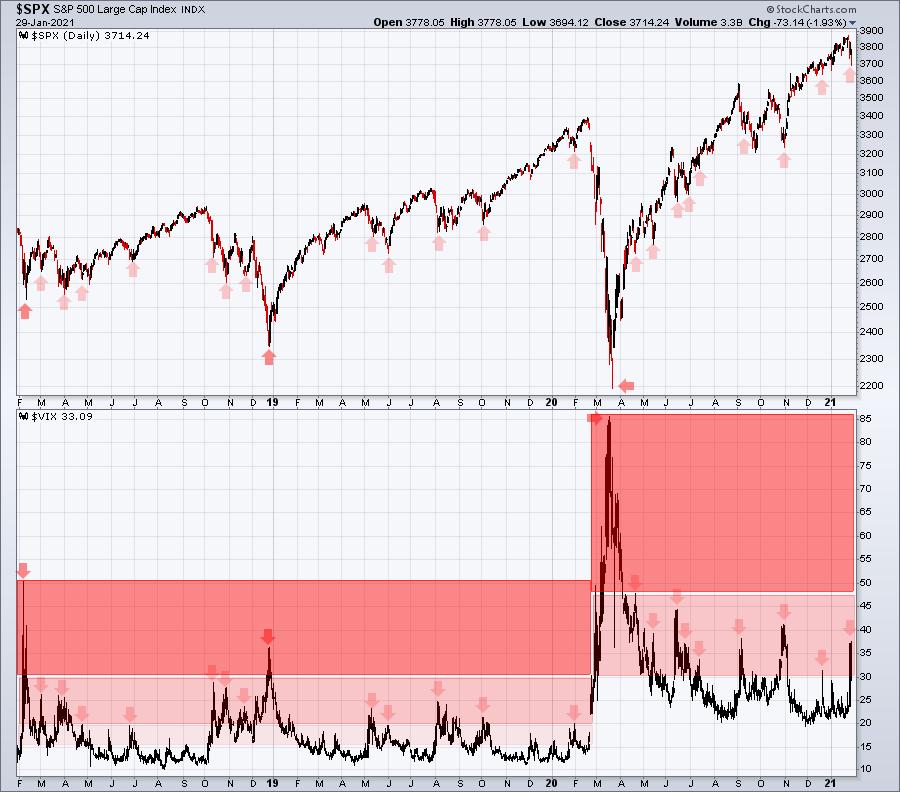
We moved from a very complacent market throughout 2018 and 2019 to an extremely volatile market in 2020. As a result the ranges of moderate (lighter shade of red) to extreme volatility (dark shade of red) changed. Traders have remained on edge into 2021, despite the significant recovery in the S&P 500 and the eventual move back to all-time highs just last week. We had some fearful times during 2018 and 2019 relating to the trade war, but at the highest level of fear and panic in December 2018, the VIX "only" rose to 37. We hit that yesterday, just three days after setting an all-time high. The best way to describe it is that the market is "cranky". It doesn't take much to rile it up, because fear remains high. The normal VIX low during 2018-2019 was 10 to 15. During the pandemic, the normal VIX low has been 20 to 25. We're a bit cranky. I believe the VIX will top somewhere in the 30-45 range that's highlighted. That suggests to me that we're very near a selling climax. The reason I believe that the VIX will stop in this range is because nearly every panicked low since the inception of the VIX has been contained below 45-50. Check out this longer-term monthly VIX chart:
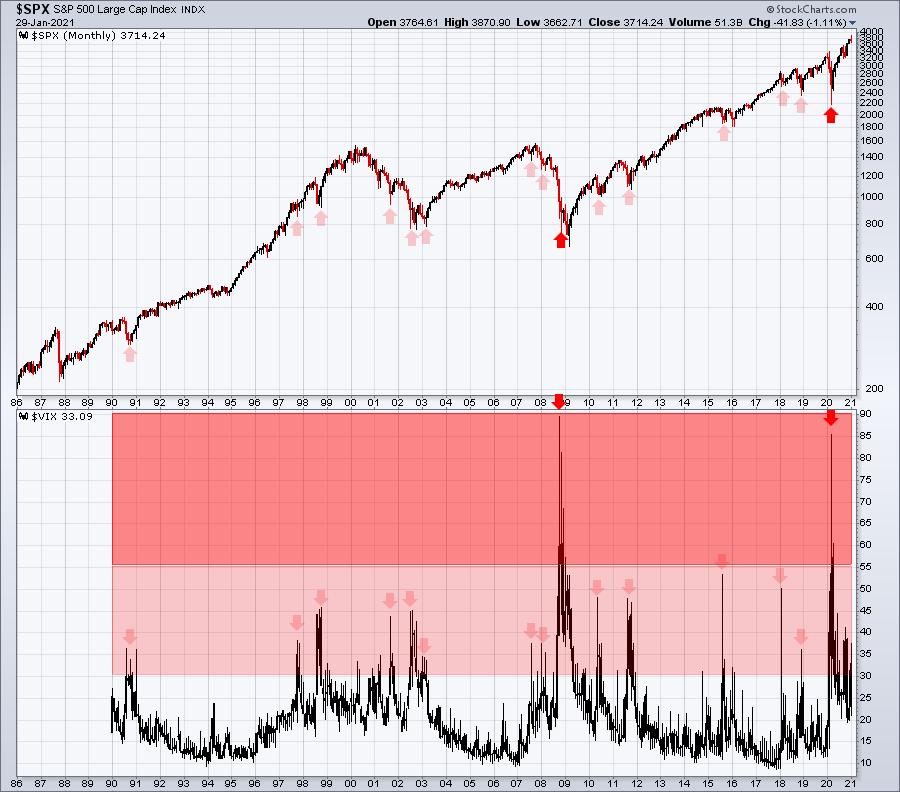
It's not easy to pinpoint EXACTLY where the VIX (and the S&P 500) will turn. However, the above long-term chart does give us a pretty good sense of where they're likely to turn. Historically, with only two exceptions, the 30-50 range is where the fear goes before it reaches a climax. In 35 years, there's only been a dozen or so instances when the VIX moves above 40. We hit 37 on Friday. We're getting close to rarified air. The only VIX trips above 50 occurred during the worst financial crisis of my lifetime (2008) and the worst health care crisis of my lifetime (2020). While we don't have a VIX reading for 1987, I suspect we would have seen a VIX top somewhere north of 50. The 1970s secular bear market likely would have produced a VIX above 50, probably in 1974.
The biggest risk of being fully invested today is being off one or two days, or maybe even a week, from a significant bottom. If we do see the VIX move into the 40s, or possibly even a test of 50, the S&P 500 could be another 10% lower. Personally, I don't believe that will happen, but it's a possibility. Snapback rallies are powerful, however, so you don't want to miss those.
Bottom line, if you're a long-term investor, I'd snore during this volatility and short-term selling. If you're a very short-term trader, though, you'll need to be nimble. 20 week EMA tests don't happen often during bull market rallies, but they tend to provide excellent support when they do occur. Here's what that S&P 500 weekly chart looks like now.
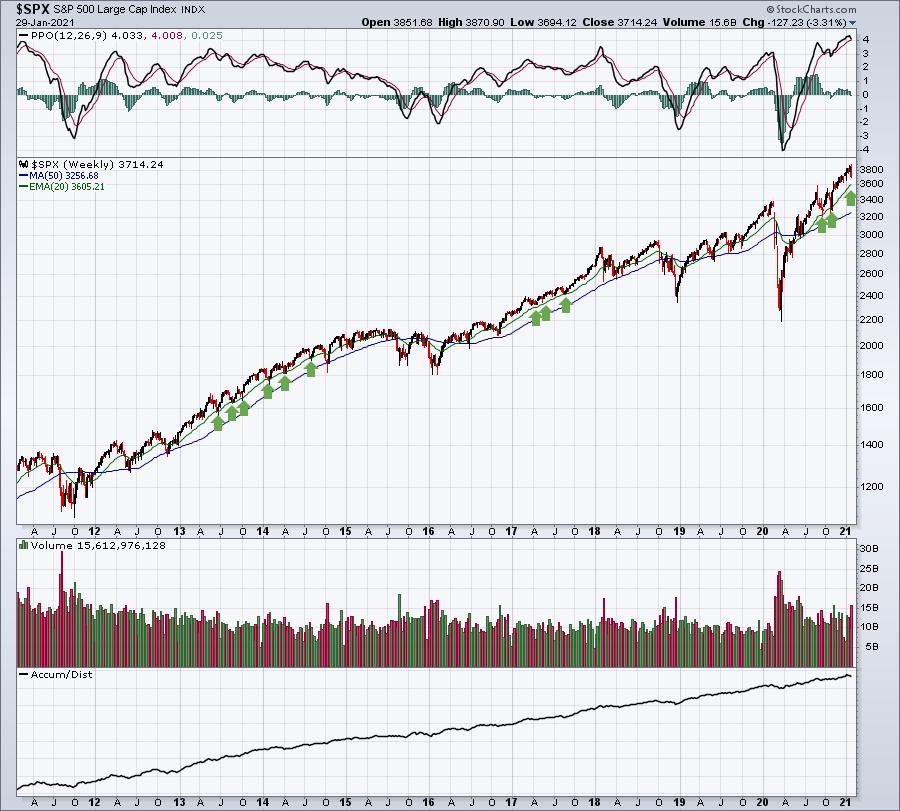
Generally speaking, 20 week EMA tests (green arrows) provide excellent support during uptrending prices. While it's possible the selling intensifies because high VIX markets can be unpredictable, I think it's more likely that we're in the midst of printing the C in an A-B-C correction:
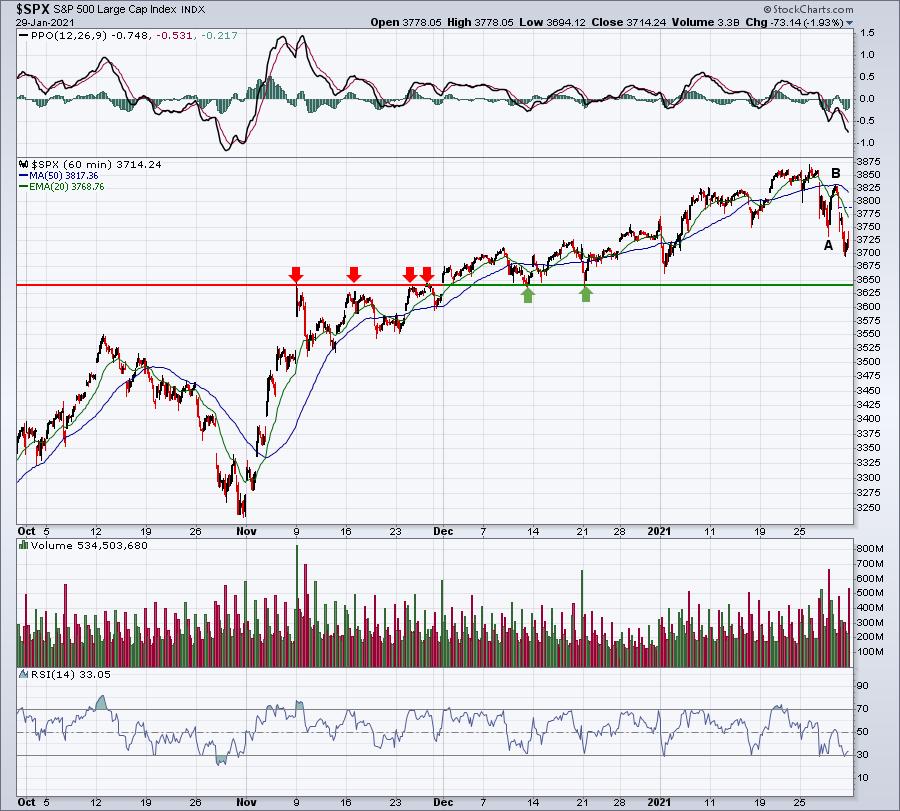
Could the "C" print at or near the key price support level around 3640? Maybe an intraday move to 3605 to test that 20 week EMA and a reversal to hold 3640 support? I'm just speculating and considering the possibilities before they unfold. I will say this. I'd grow much more cautious near-term on a daily close beneath 3600. It would not change my long-term secular bull market thesis at all, but I've been around the stock market long enough to know that when a market breaks down with a high VIX, cash is a great place to be. High VIX markets are not rational and market makers have a tendency to "go on vacation", leaving prices to fall very quickly. When market makers do begin buying again in such a scenario, you'll know it.
Today's Event
I'm hosting a FREE webinar this morning at 11:00am ET, "A Day in the Life of EarningsBeats.com", which will walk through our EarningsBeats.com research and education platform. I'll discuss my approach to the stock market, our vast number of products and services, and how to easily combine them with all the great tools here at StockCharts.com. In addition to being a solid refresher for all of our members, it'll also serve as a great introduction for those of you that would like to see how we approach the stock market.
This webinar is available to our entire EB.com community, including our free EB Digest newsletter subscribers. If you're already an EB member or free EB Digest subscriber, a link to today's webinar is being sent out this morning. If you're neither, you can attend today's event directly via the room link below. We'll add you to our free EB Digest newsletter (no credit card required and you may unsubscribe at any time) if you join the webinar without already being a part of our community. Here's the link:
https://us02web.zoom.us/j/88224156362
The room should be open by 10:30am ET at the latest.
Happy trading!
Tom


