I want you to look at a 5-year relative chart without titles and, before you look below the chart, see if you can name the industry group that's been responsible for this amazing long-term relative strength:
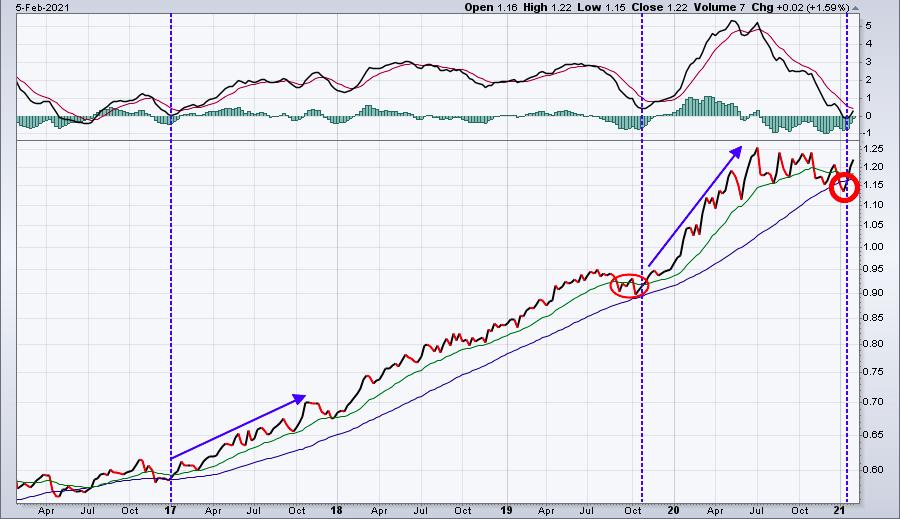
The relative price action (vs. the S&P 500) has remained almost exclusively above the relative 20 week EMA - for over 4 years! We saw a dip below that 20 week EMA during the second half of 2019. Then after a huge spike that led to its all-time relative high in July, that relative strength could go no further. That is, until the last few weeks. We've also seen a breakout on an absolute basis:
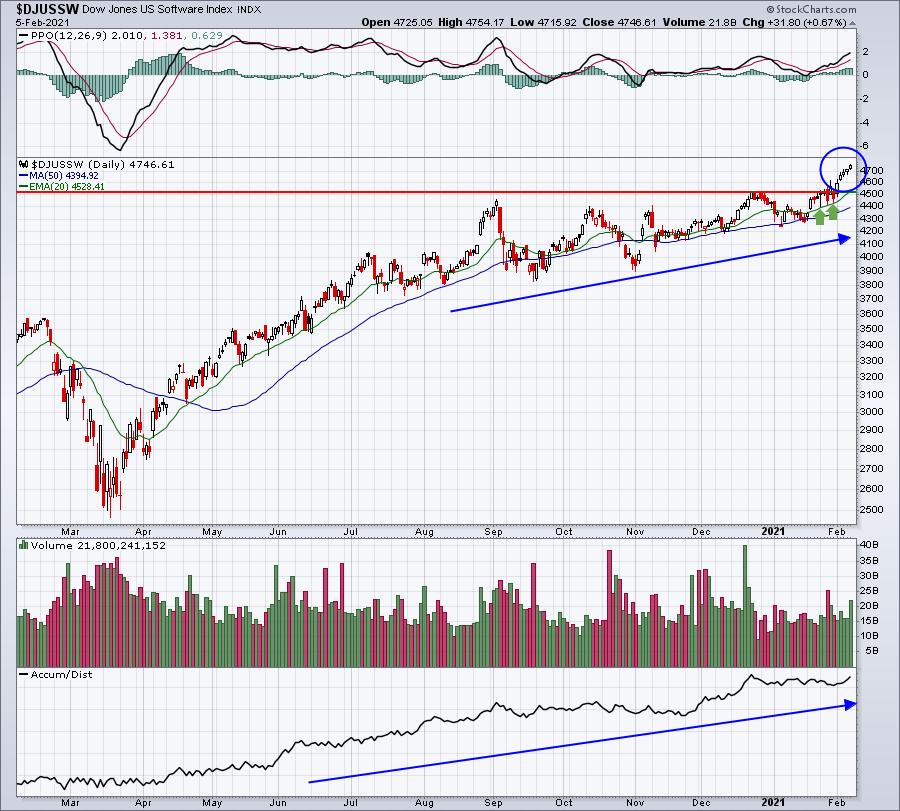
Welcome back software ($DJUSSW), we've missed you! There's a reason for this renewed absolute and relative strength. It's earnings, folks.
Our flagship ChartList is our Strong Earnings ChartList. Companies that (1) beat Wall Street consensus estimates as to both revenues and earnings (EPS), (2) are liquid (average trading at least 200,000 shares daily), and (3) show solid technical attributes are added to this ChartList and remain there until their next quarterly earnings report approaches. Over the past month, I pulled up the top 10 performers from this ChartList and 4 of them are software stocks:
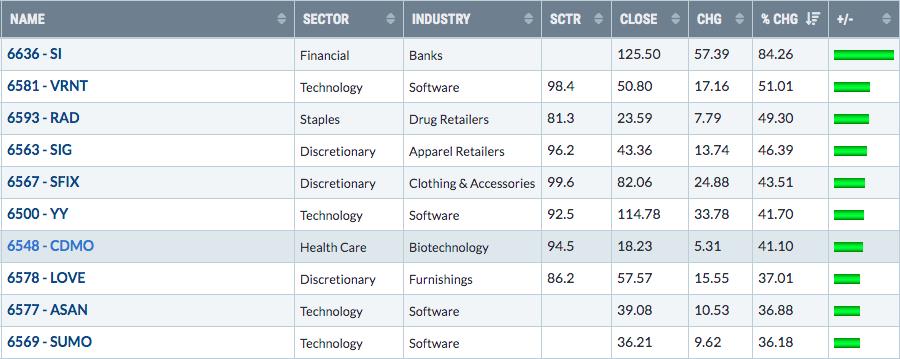
Let's review the quarterly earnings information from the 4 software stocks listed above:
Verint Systems (VRNT)
- Revenues: $328.2 million (actual) vs. $317.0 million (estimate)
- Earnings (EPS): $1.02 (actual) vs. $.79 (estimate)
YY, Inc. (YY)
- Revenues: $925.9 million (actual) vs. $876.3 million (estimate)
- Earnings (EPS): $1.31 (actual) vs. $1.02 (estimate)
Asana, Inc. (ASAN)
- Revenues: $58.9 million (actual) vs. $54.7 million (estimate)
- Earnings (EPS): ($.34) (actual) vs. ($.36) (estimate)
Sumo Logic, Inc. (SUMO)
- Revenues: $51.9 million (actual) vs. $49.3 million (estimate)
- Earnings (EPS): ($.06) (actual) vs. ($.24) (estimate)
Only ASAN's actual earnings (loss in their case) were even close to the estimate. The others beat by a mile. When companies beat earnings estimates like this, their growth rates expand. When you increase your growth rates, future earnings accelerate rapidly. Then those future, rapidly-accelerating earnings are discounted back using historically-low interest rates, which makes those earnings even more valuable. In the meantime, what's an investor's alternative? To earn a little over 1% on a 10-year treasury? This is the concept and rationale that makes investing in stocks RIGHT NOW so compelling. And I love all the naysayers. The Volatility Index ($VIX) remains above 20, so Wall Street truly is climbing the wall of worry. Or at least the wall of volatility. Non-believers are necessary to help fuel a rally and we still have plenty of those. I don't know the financial situation of everyone across the StockCharts.com platform, so everyone must make their own investing decisions. I can only give you my opinion. And here it is. The S&P 500 will move from below 4000 right now to over 10000 by the end of this decade - at a minimum. I won't be surprised at all if we see 15000. Will we see short-term selloffs along the way? Of course. Might we even see a cyclical bear market (drop of 20%) at some point? Yes, there'll probably be a couple of those. If you decide to get out of this market, just be prepared to buy back in at higher prices.
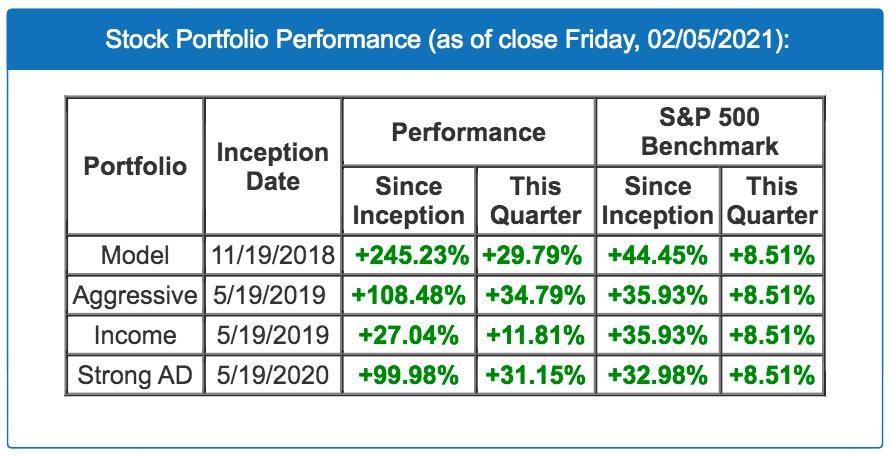
The key to long-term outperformance, however, is sticking with leading stocks in leading industry groups. Find those companies whose earnings are scorching past estimates and showing relative strength vs. their peers and the benchmark S&P 500. That's how we select our portfolio stocks, which have dominated the S&P 500. In just two weeks, we'll be unveiling the stocks that we'll be including in our 4 portfolios for the subsequent 90 days. Our portfolio results are updated on our website every day and are currently as follows:
I have a stock that I'll be including in our free EB Digest on Monday morning that has a very good chance of being included in one of our portfolios in two weeks. It absolutely blew away earnings estimates recently, raised guidance, and is clearly a HUGE relative leader in its space. If you'd like to receive this stock and view the chart, simply CLICK HERE and enter your name and email address.
Happy trading!
Tom


