It's hard to believe, but our 9th quarter of Model Portfolio performance is nearing an end. Barring a last minute collapse, we will outperform the S&P 500 for the 8th time in those 9 quarters. I'm proud of the performance of all of our portfolios. Below is a performance summary by quarter:
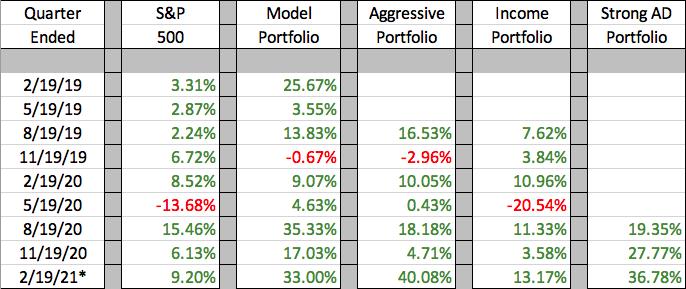
The asterisk identifies the current quarter that has not yet been completed. Numbers will be final next Friday, February 19th.
Every Sunday morning, I publish an EB Weekly Portfolio Report (for members), which summarizes key information relating to our portfolios. The following is the report that was published and emailed to EarningsBeats.com members this past Sunday, February 7th. Our "DRAFT" to select the 10 equal-weighted stocks in 10 leading industry groups that will comprise each portfolio will take place on Sunday, February 21st. The following report provides the stocks that are currently included in each of our 4 portfolios. If you'd like to be part of our upcoming "DRAFT" to see which stocks will be included in each portfolio, you can CLICK HERE to sign up for your no cost 30-day trial. Enjoy!
Upcoming Earnings Reports
According to Zacks.com, the following companies will be reporting earnings this week and each is a component of one of our portfolios:
Monday, February 8: None
Tuesday, February 9: CARR, ENPH
Wednesday, February 10: AMAT
Thursday, February 11: NET, ZBRA, GNRC, YETI
Friday, February 12: None
PLEASE NOTE: The above companies were provided after scanning the Zacks Earnings Calendar. My research is limited to what Zacks provides and I also can make a mistake from time to time, so please check for earnings dates for all companies that you own. We do hold our portfolio stocks through one earnings report, but every EarningsBeats.com member must make their own investing/trading decisions about holding stocks into earnings reports as it's the most volatile (risky) time to own a stock.
Portfolio Rules and Objectives
Here are the common traits and objectives of our portfolios:
- There are 10 leading stocks from up to 10 leading industries in each portfolio (at the time of selection). Generally, there will only be one stock per industry group, but there could be exceptions.
- They are held for an entire 90 day period, with no stops in place. We strive for consistency, transparency, and simplicity in our portfolios. EB.com members may hold these stocks for the entire 90 days, trade them, use stops, etc., but for purposes of our calculation, we will make no exceptions to our "buy and hold for three months" strategy.
- Every stock will generally be held through ONE earnings report
- The expectation is that relative winners will carry the portfolio to outperformance
- They were all entered into as of the close on Thursday, November 19th; members may choose to try to time better entries, but EB.com "purchased" as of November 19th's closing price
- Primary objective is to outperform the benchmark S&P 500
Here are several considerations for EB members:
- I would expect the Strong AD and Aggressive portfolios to be the riskiest, followed by the Model portfolio, and then the Income portfolio
- The Strong AD portfolio will be selected from a combination of rising accumulation/distribution lines and SCTRs above 80 at the time of selection. It is the only portfolio that does NOT require a revenue and EPS beat in its most recent quarterly earnings report
- The Income portfolio stocks will all pay dividends, with the expected average dividend yield to be at least 1.0%
- Drawdowns (losses) should be much milder on the Income portfolio, with more volatility expected on the other three; please review inception-to-date charts below to gain an idea of the volatility associated with each
- I believe the larger drawdown on the Income portfolio at the beginning of the pandemic was an anomaly, occurring as many defensive, higher-yielding companies uncharacteristically underperformed during a market decline.
- You should own or trade these stocks in whatever manner is most comfortable for you; while we will buy all 10 stocks in the manner identified above, feel free to trade certain stocks or wait for pullbacks if the stocks are overbought
- We have no idea what risk each member is willing or able to take. We are not registered investment advisors so be sure you understand the risk you take. Please consult your financial advisor.
- EarningsBeats.com shareholders/employees may own all or some of the portfolio stocks from time to time.
Weekly Snapshot
Here's a weekly recap:
The S&P 500 rebounded strongly and, for the most part, so did we. We want to make sure we stick with what's working in this secular bull market. "Leading stocks in leading industries" is what's gotten us to this point and what we continue to like moving forward.
Weekly Summary
Benchmark S&P 500:
Last week was very encouraging for a few reasons. First and foremost, the S&P 500 moved higher and our 5 aggressive sectors were in the top 6 to provide the impetus for the breakout:
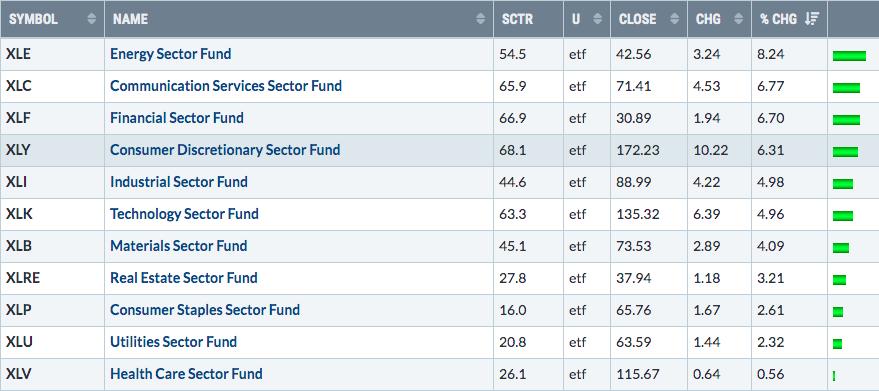
Last week, when viewing this same weekly sector summary, I mentioned that the XLC, XLK, and XLY all were at or near all-time relative weeks, which I suggested was bullish. Then we bounced back this past week and the aggressive sectors moved immediately back to leadership positions. All 5 aggressive sectors beat the S&P 500 during another breakout. I find that to be extremely bullish absolute and relative price action.
Model Portfolio:
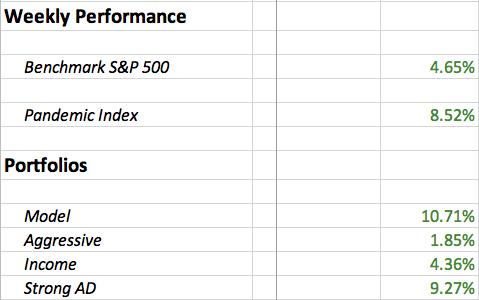
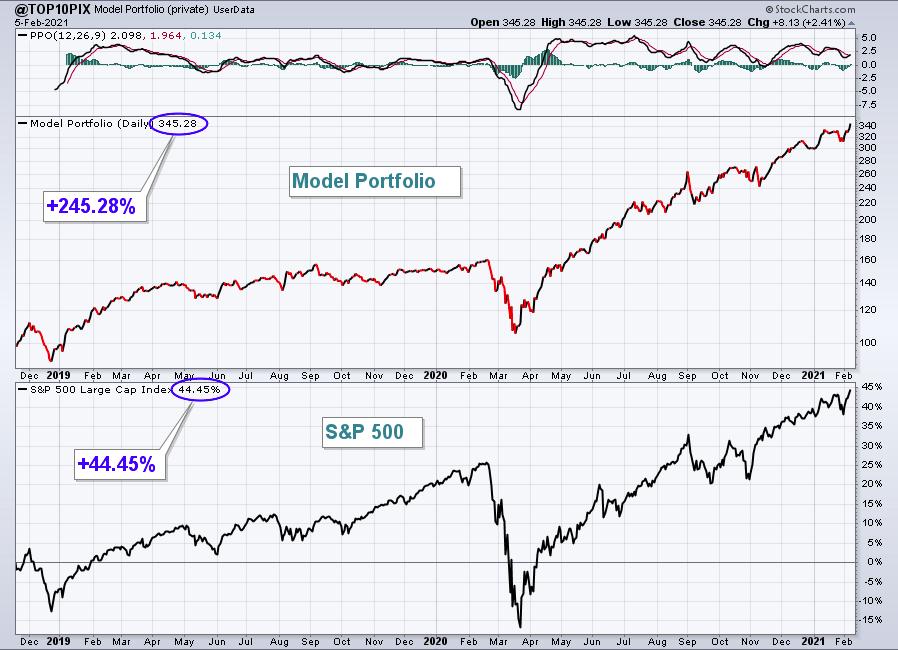
The Model Portfolio exploded 10.71% last week, crushing the solid S&P 500 gain. Here's the updated inception-to-date chart of the portfolio:
Here are how the Model portfolio component stocks performed last week:
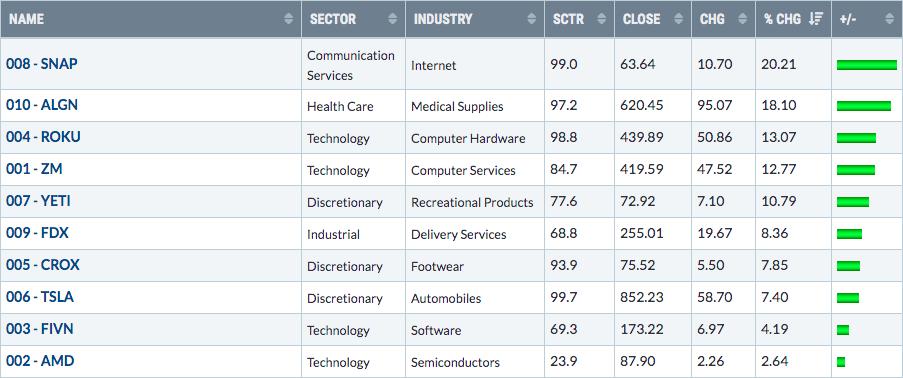
There are a number of story lines here. AMD, the primary underperformer last week, now sits at about a 6 month relative low to its semiconductor peers ($DJUSSC), which isn't good. Companies like SNAP and ALGN produced excellent quarterly reports and broke out to new highs, continuing to show great leadership. And then there's ZM, which is what I want to focus on. I love this chart. I know it's been a laggard for awhile, but I've believed all along that its fundamentals were simply playing "catch up" to that huge price rise during the pandemic. With its earnings a few weeks away, it could be poised for a significant rally into that earnings report. Friday's breakout was significant:
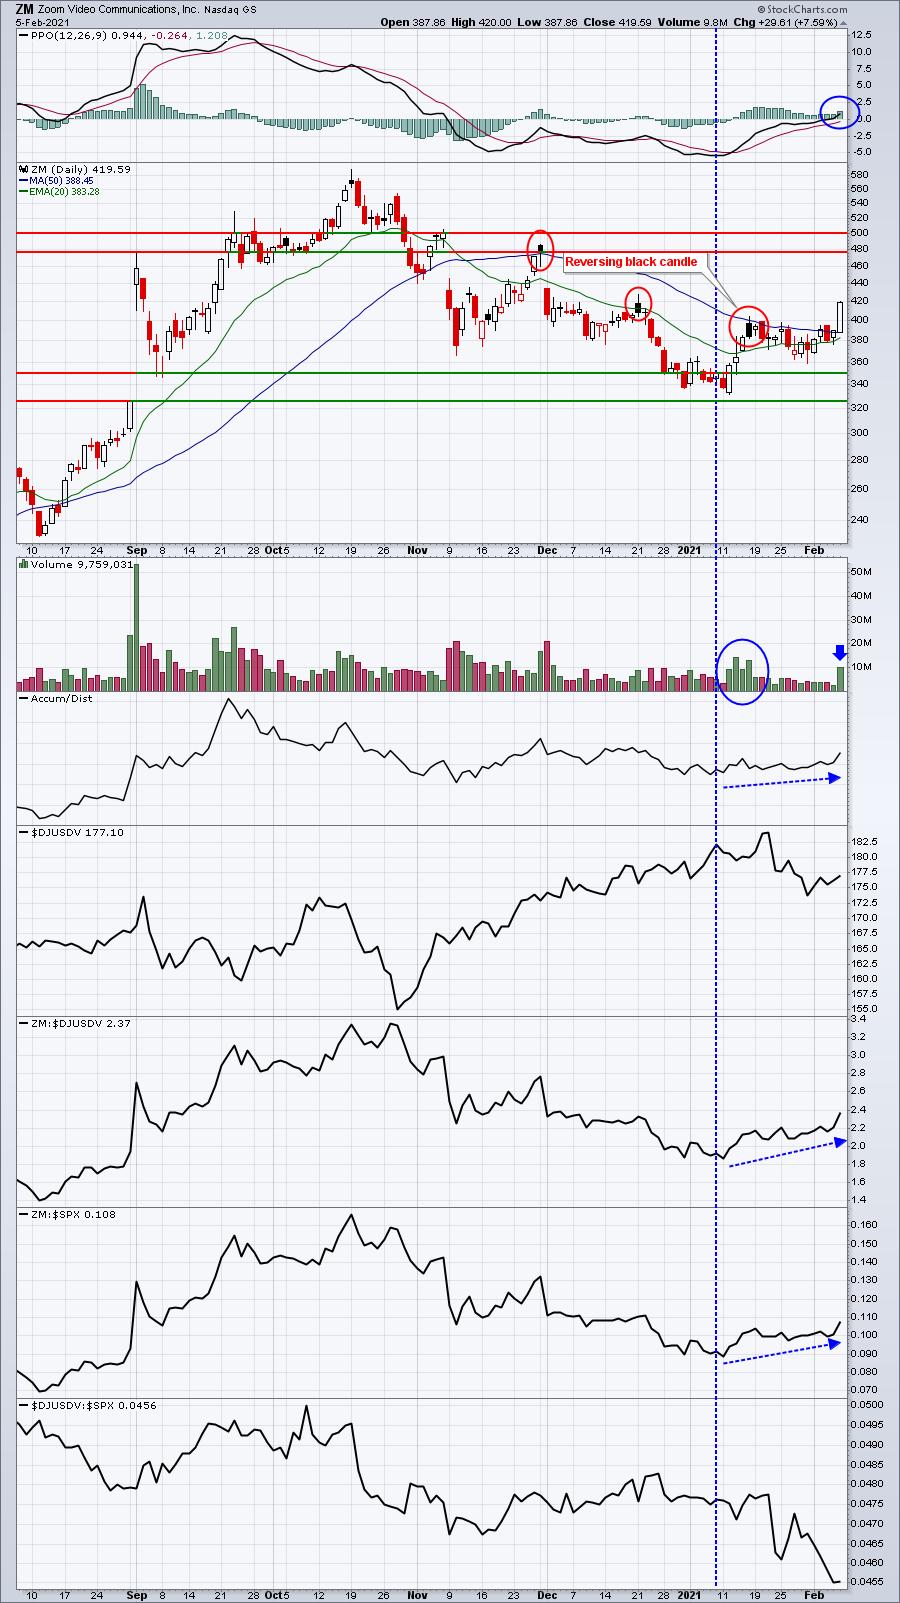
That blue-dotted vertical line seems to be when everything changed for ZM. The downward price action ended as ZM fell into a key gap support zone. The PPO turned higher. Relative strength turned higher. The AD line turned higher. And, on Friday, we finally saw a breakout above one of those reversing black candles. While I don't expect a straight line higher from here, I do expect uptrend rules to now apply. So I'd consider the rising 20 day EMA to be excellent support over the coming weeks.
Aggressive Portfolio:
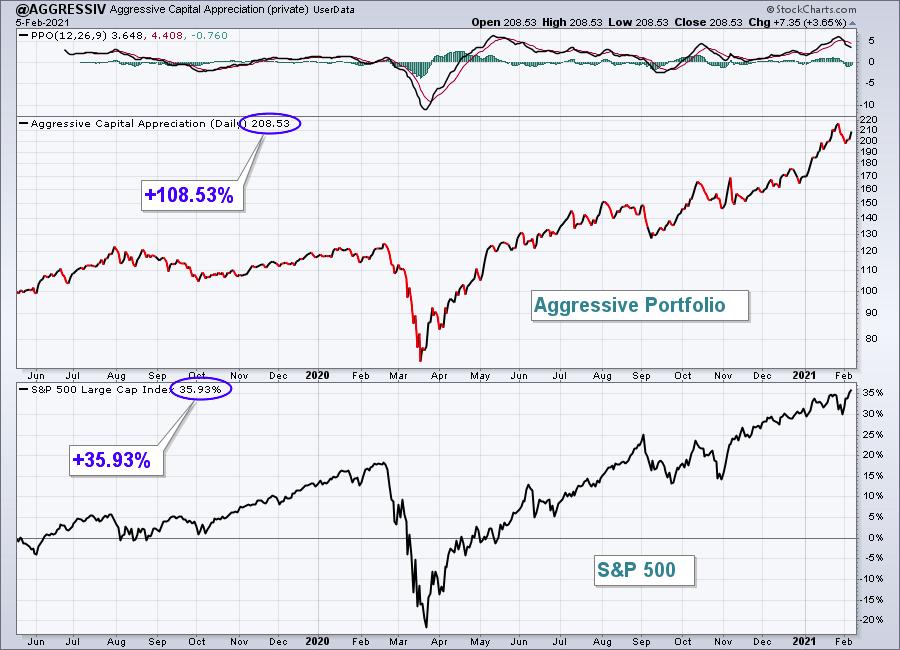
The Aggressive Portfolio tacked on 1.85%, though it was considerably less than the S&P 500's gain. Here's the updated inception-to-date chart of the portfolio:
Here are how the Aggressive portfolio component stocks performed last week:
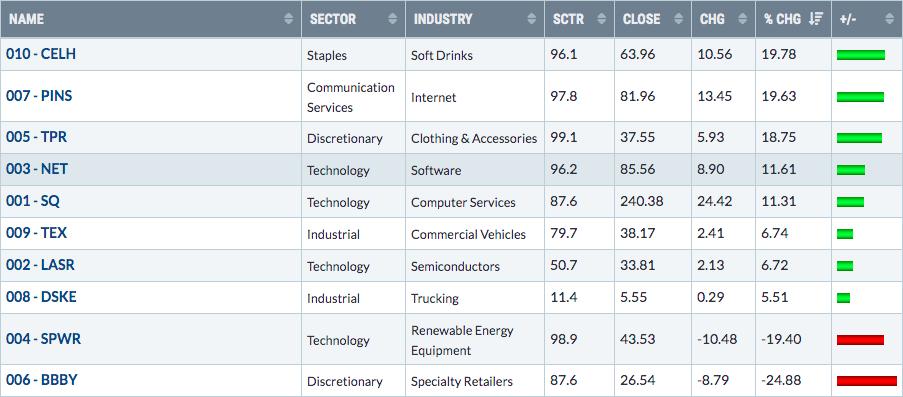
"You live by the sword and you die by the sword." SPWR and BBBY were single-handedly carrying this portfolio on their broad shoulders to the upside as traders couldn't get enough of high short interest stocks. SPWR and BBBY remain two of those. But the selling has been indiscriminate as well and both stocks were hammered last week. Still, the overall portfolio was able to advance as half its component stocks gained 10% or more. NET reports this week and I like the way the chart is shaping up:
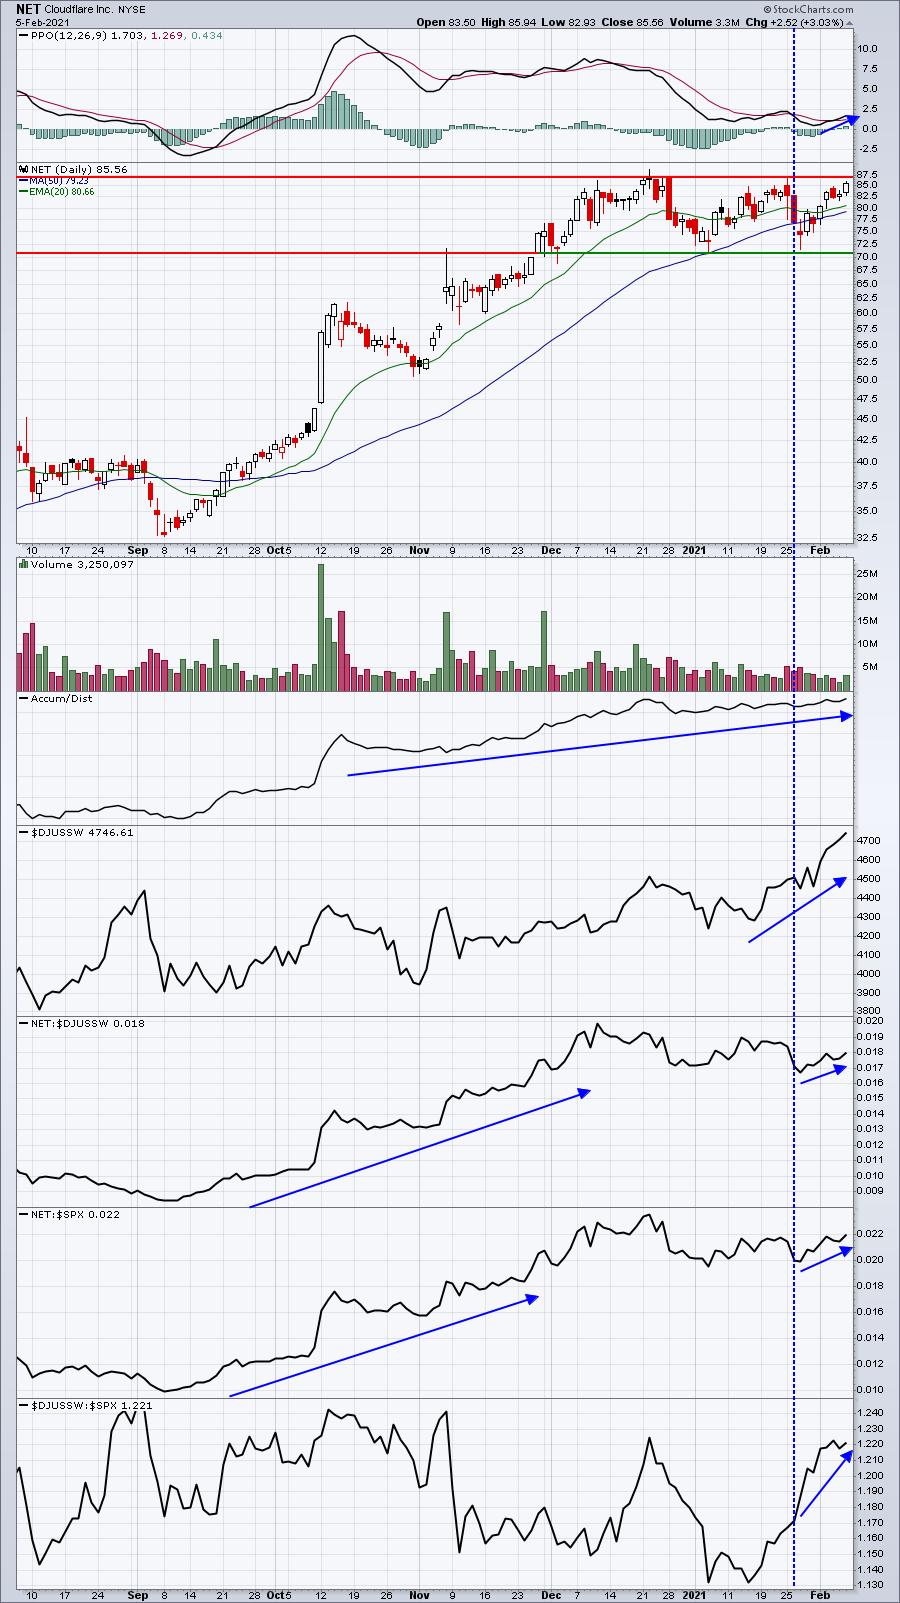
Software ($DJUSSW) has begun bouncing back in a big way and NET has been one of its best performers over the past year. I'm expecting a very big report here and the recent consolidation could result in another breakout. NET reports on Thursday after the close. The reaction here will be very interesting, to say the least.
Income Portfolio:
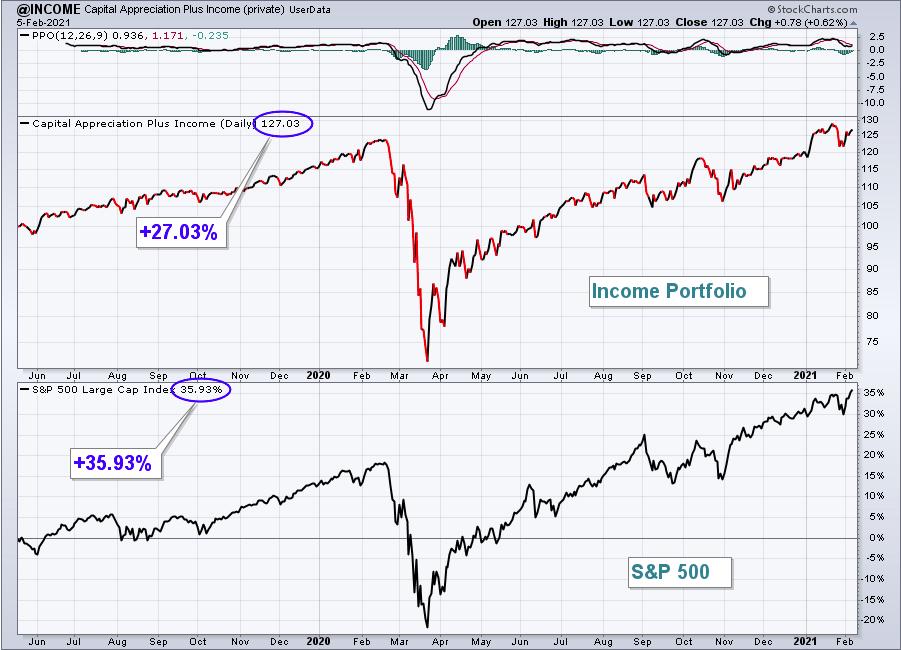
The Income Portfolio gained 4.36%, falling just shy of the benchmark S&P 500. Here's the updated inception-to-date chart of the portfolio:
Here are how the Income portfolio component stocks performed last week:
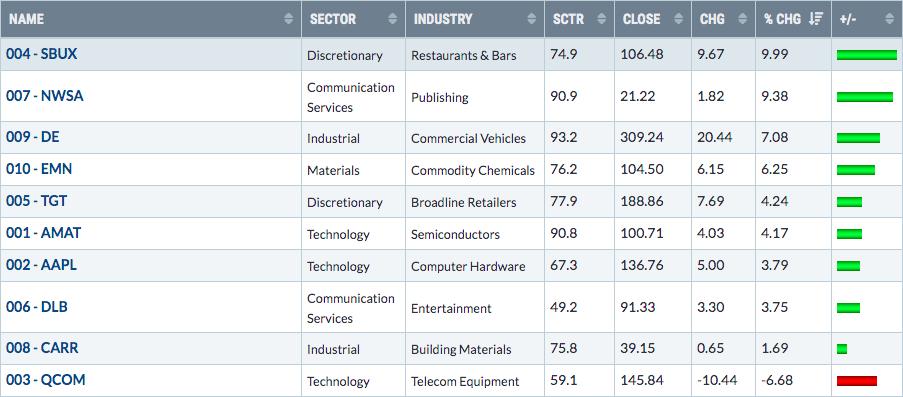
NWSA rebounded strongly after its better-than-expected quarterly results, but QCOM went the other way after missing on quarterly revenues. The latter needs to hang onto gap support:
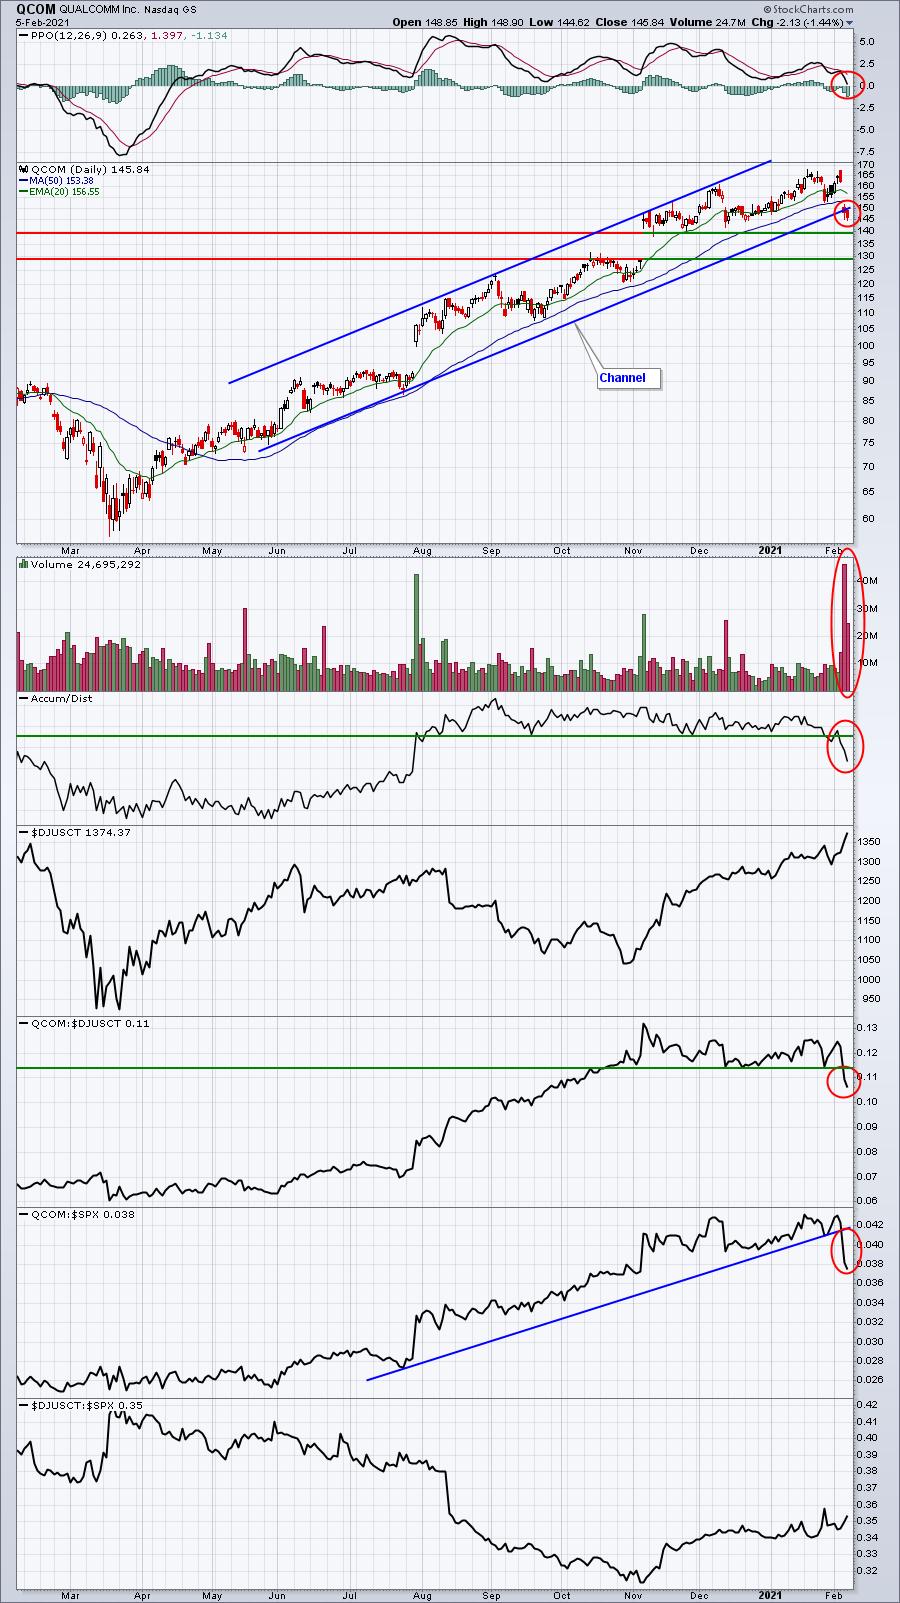
As many of you likely know, I tend to keep a fairly positive attitude. There's not much to like here with QCOM. I see several red flags and I'll be surprised if we avoid a test of the approaching gap support zone. I'm hopeful that we'll hold the top of gap support near the 140 level.
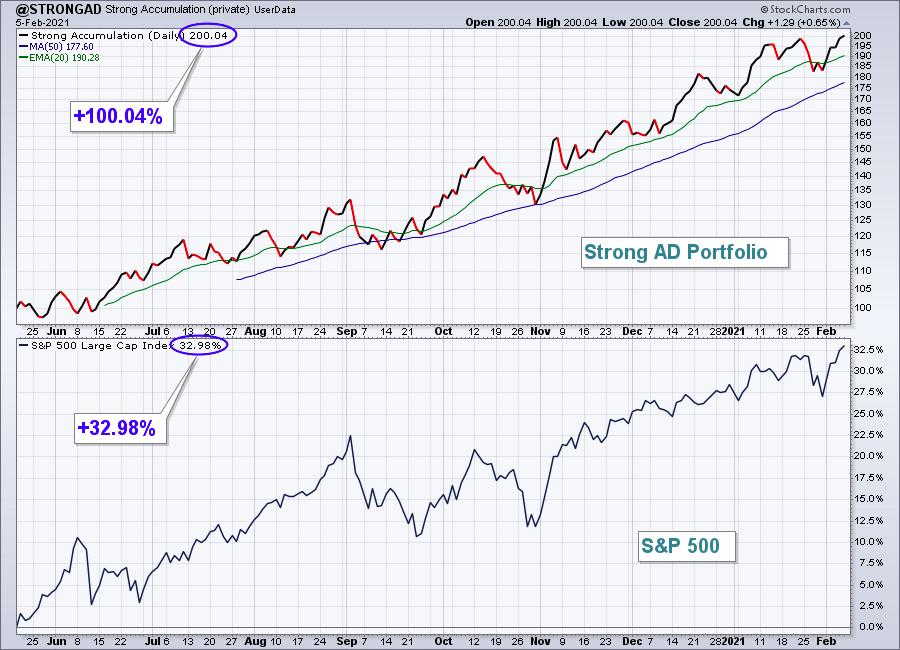
Strong AD Portfolio:
The Strong AD Portfolio surged 9.27%. Here's the updated inception-to-date chart of the portfolio:
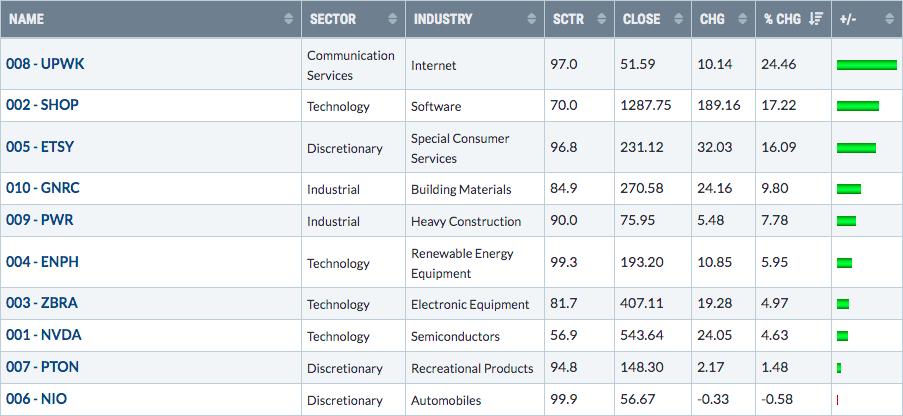
Here are how the Strong AD portfolio component stocks performed last week:
SHOP was a big beneficiary of the resurgence in software stocks:
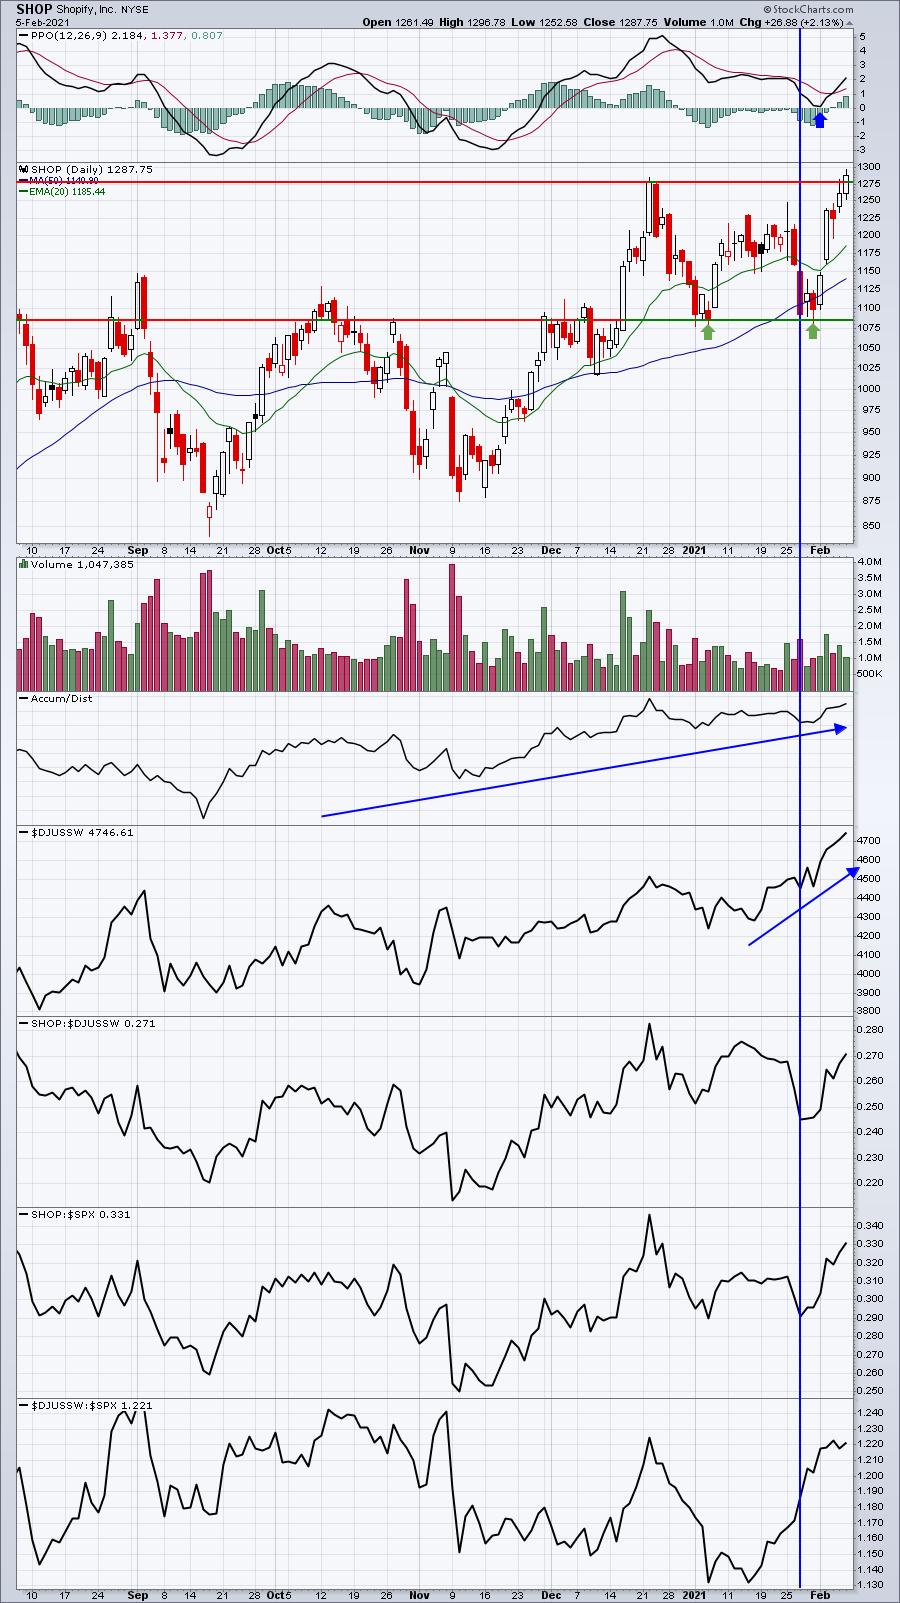
The blue vertical line shows how SHOP improved dramatically off its recent double bottom (green arrows) and PPO centerline test (blue arrow). I'll be watching early this week to see if SHOP sees an increase in volume to support its late-week Friday breakout.
Summary
Earnings season continues in full force and leaders are doing what leaders do. They lead. After a pause in recent weeks, we got another surge from our Model Portfolio stocks, mostly due to spectacular earnings growth and solid, if not raised, guidance. While pullbacks literally can occur at any time, the market is reminding us that it's worse to be out of the market and miss a surge than to be in the market and risk a short-term period of selling and consolidation. Secular bull market advances are POWERFUL and they drive your portfolio higher. I'd tend to grow more cautious as we approach options expiration Friday, but that's still two weeks away and way too early to be concerned with market maker shenanigans.
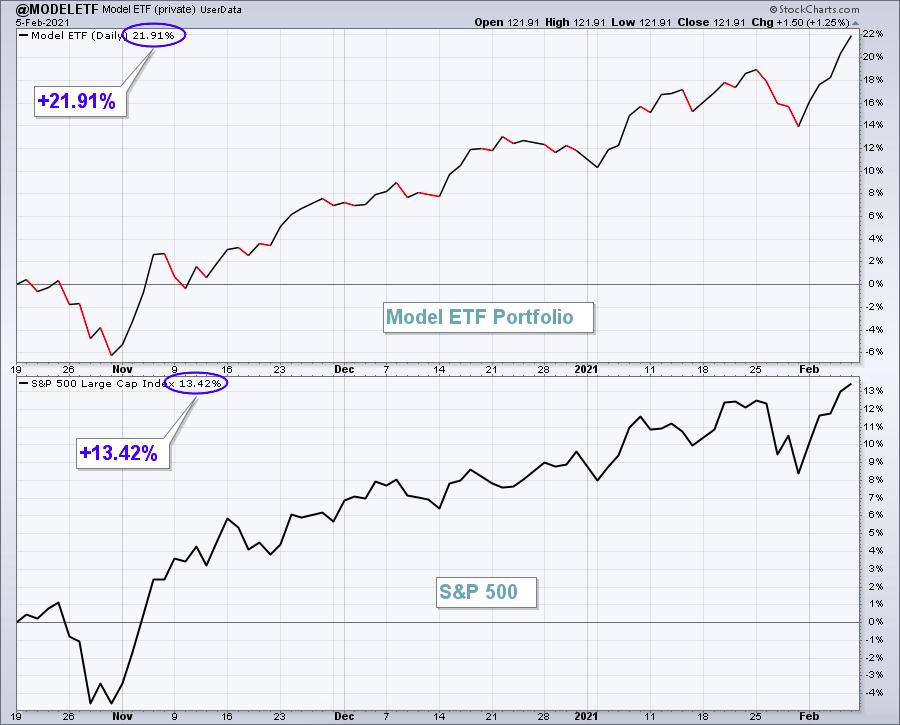
Model ETF Portfolio
It was a strong week for our Model ETF Portfolio. After lagging slightly in the week prior, our Model ETF Portfolio snapped back to gain 7.02%, easily outdistancing the benchmark S&P 500, which gained 4.65%.
Here's the updated inception-to-date chart of the Model ETF Portfolio:
Here are how the Model ETF Portfolio component ETFs performed last week:
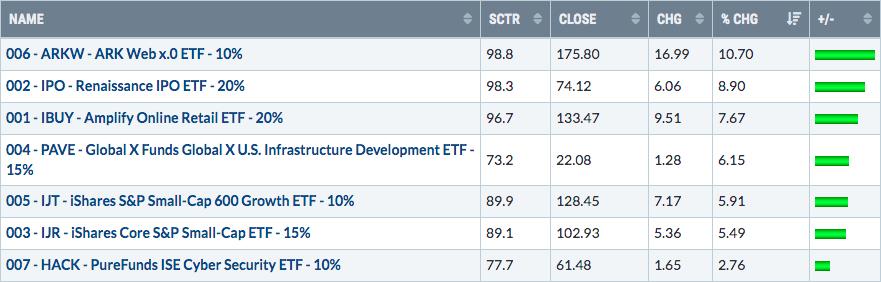
6 of our 7 ETFs beat the S&P 500, but HACK underperformed. Still, it was a very solid week for this portfolio, which is now 8 1/2 percentage points above the benchmark in just 3 1/2 months. Great action indeed!
Happy trading!
Tom Bowley, Chief Market Strategist
EarningsBeats.com
"Better timing. Better trades."


