I'm not a big fan of catching a falling knife. And right now, Plug Power (PLUG) is more like a machete. But there are both short-term and long-term reasons why we could see a major bottom print on its chart. Let's start with the technical long-term reason:
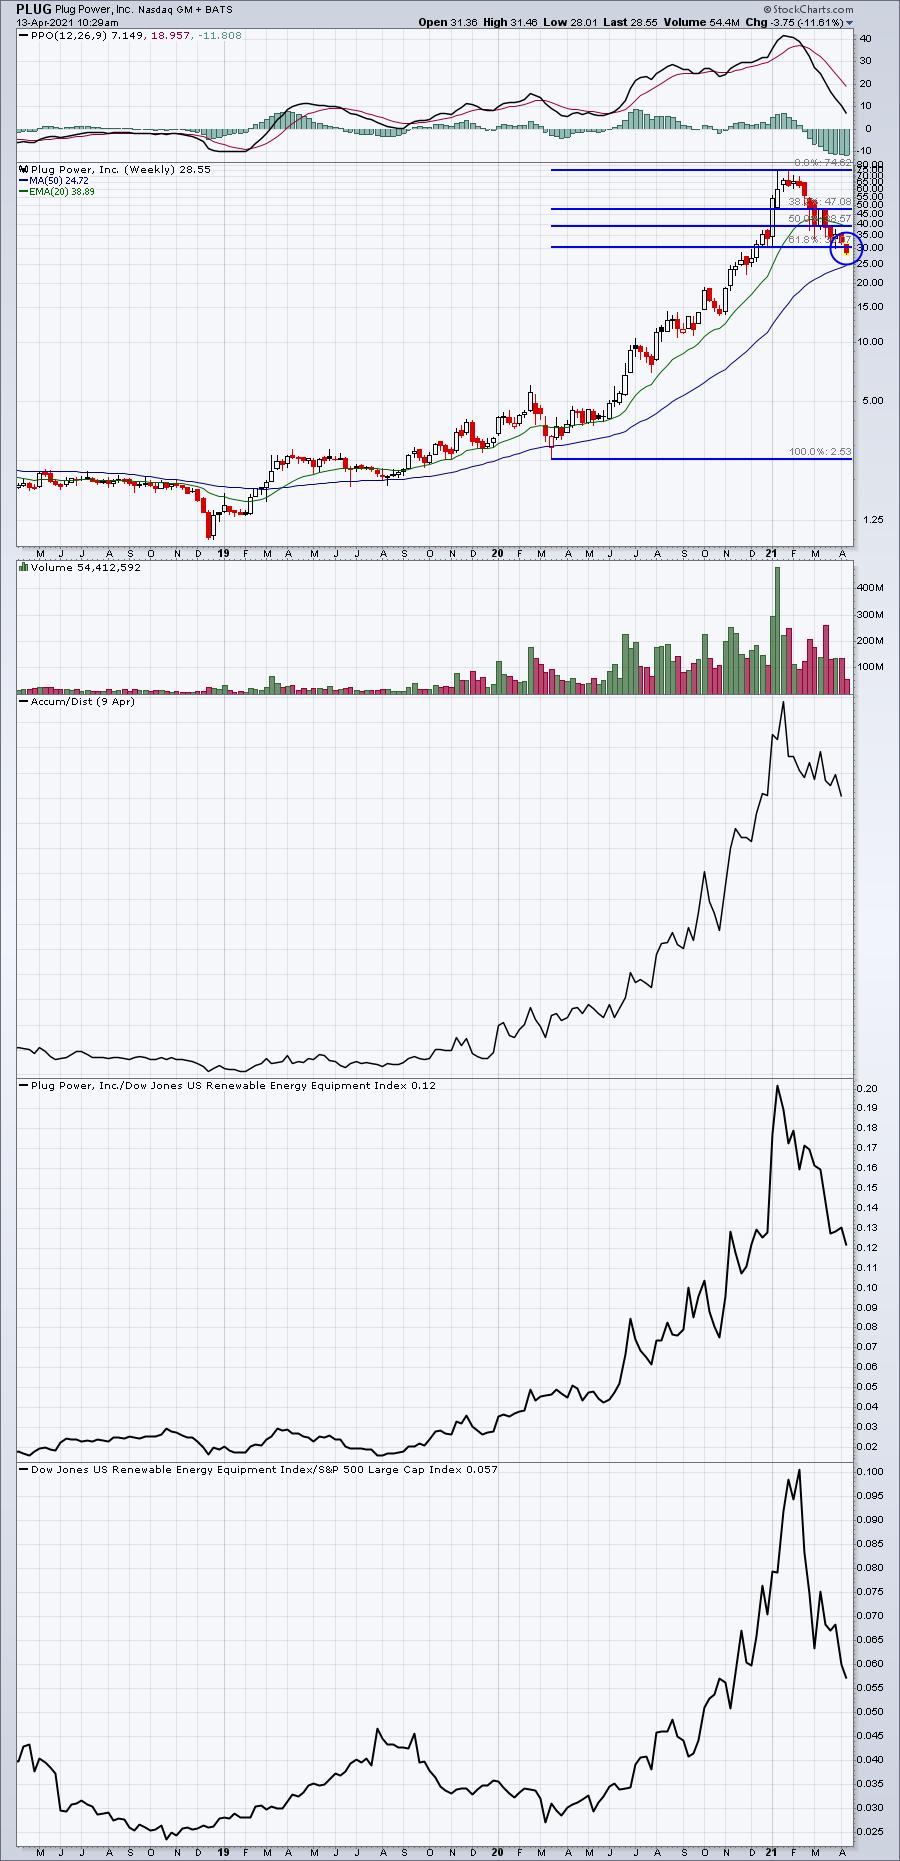
The Fibonacci retracement level of 61.8% is being tested and a reversal here would suggest an excellent entry point. Furthermore, 28.80 is a key level of support on the daily chart as illustrated below:
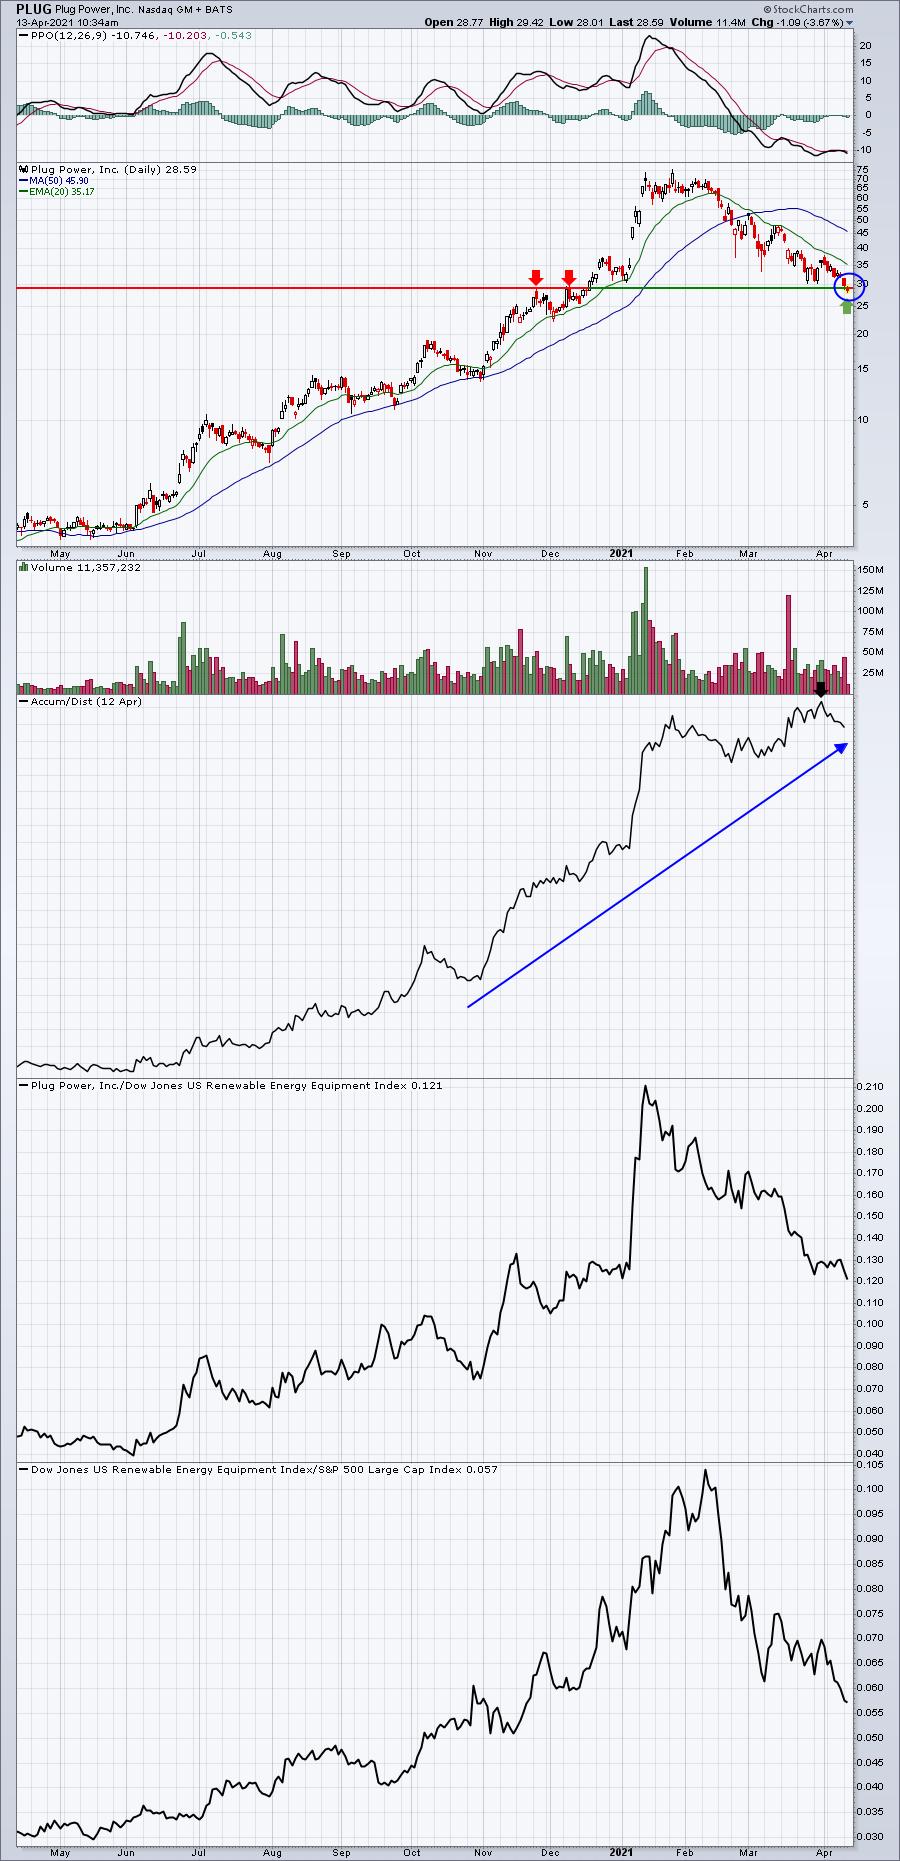
Perhaps the most interesting part of PLUG's technical picture right now is its accumulation/distribution line (AD line). While it's price action has been tumbling in 2021, there's been plenty of late-day buying to help keep that AD line near its high. In fact, just a couple weeks ago, PLUG set a new high on its AD line (black arrow). This doesn't appear to be a stock that's being heavily distributed by institutions. Instead, I believe the fear is at the retail level.
And then there's this little bit of information that suggests market makers are about to drive the price higher. It's options expiration week. On Friday, tons of options will expire and PLUG currently has MILLIONS - lots of MILLIONS - of dollars of net in-the-money put premium. The stock currently trades at 28.59 and here are a few fun facts about its April options activity:
- I count less than 1000 in-the-money calls
- There are 1300 open puts at the 55 strike price alone, representing put value of more than $3 million
- There are 5400 open puts at the 45 strike price
- There are another 4100 open puts at the 40 strike price
- How about another 6400 open puts at the 35 strike price?
My point here is that EVERYONE is betting against PLUG right now. Everyone, except the market makers, that is. They can make A TON of money if PLUG reverses later this week. How? Well, who do you think is on the other side of all those put option trades? Don't feel bad for them, they don't lose money if the stock keeps dropping. Because to hedge against selling puts, they can simply short the stock. So they make money shorting, then pay the options holders, netting the premium as profit.
But what happens if they cover their shorts to net a profit, go long driving the price of PLUG higher (again making a profit), and, in the process, reduce the ridiculous amount of net in-the-money put premium? They make money again by having to pay out less on the options come Friday. It's a WIN-WIN-WIN for market makers. And whenever a lot of money is on the table, don't bet against the market makers.
Let me wrap this up by providing you information on Alibaba (BABA) just before March options expired last month. Here's the spreadsheet I provided EarningsBeats.com members on "max pain", which I define as the point in which in-the-money call premium EXACTLY equals in-the-money put premium. It's the point at which market makers pay out a net zero - or paradise for those thieves. Check this out:
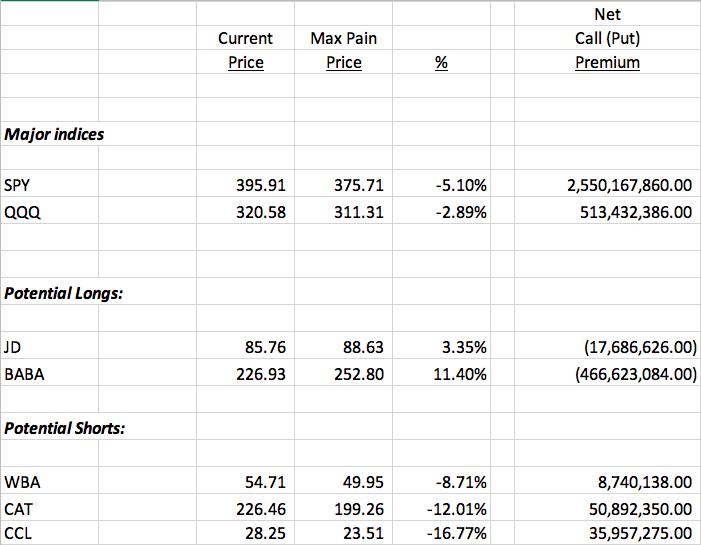
All of these trades last month worked to varying degrees. The above information was provided to our members in our Max Pain webinar on Tuesday, March 16th after the close. BABA had $466 million of net in-the-money put premium, so there's was A TON of financial incentive for BABA to begin to move higher. Look at what happened on the chart:
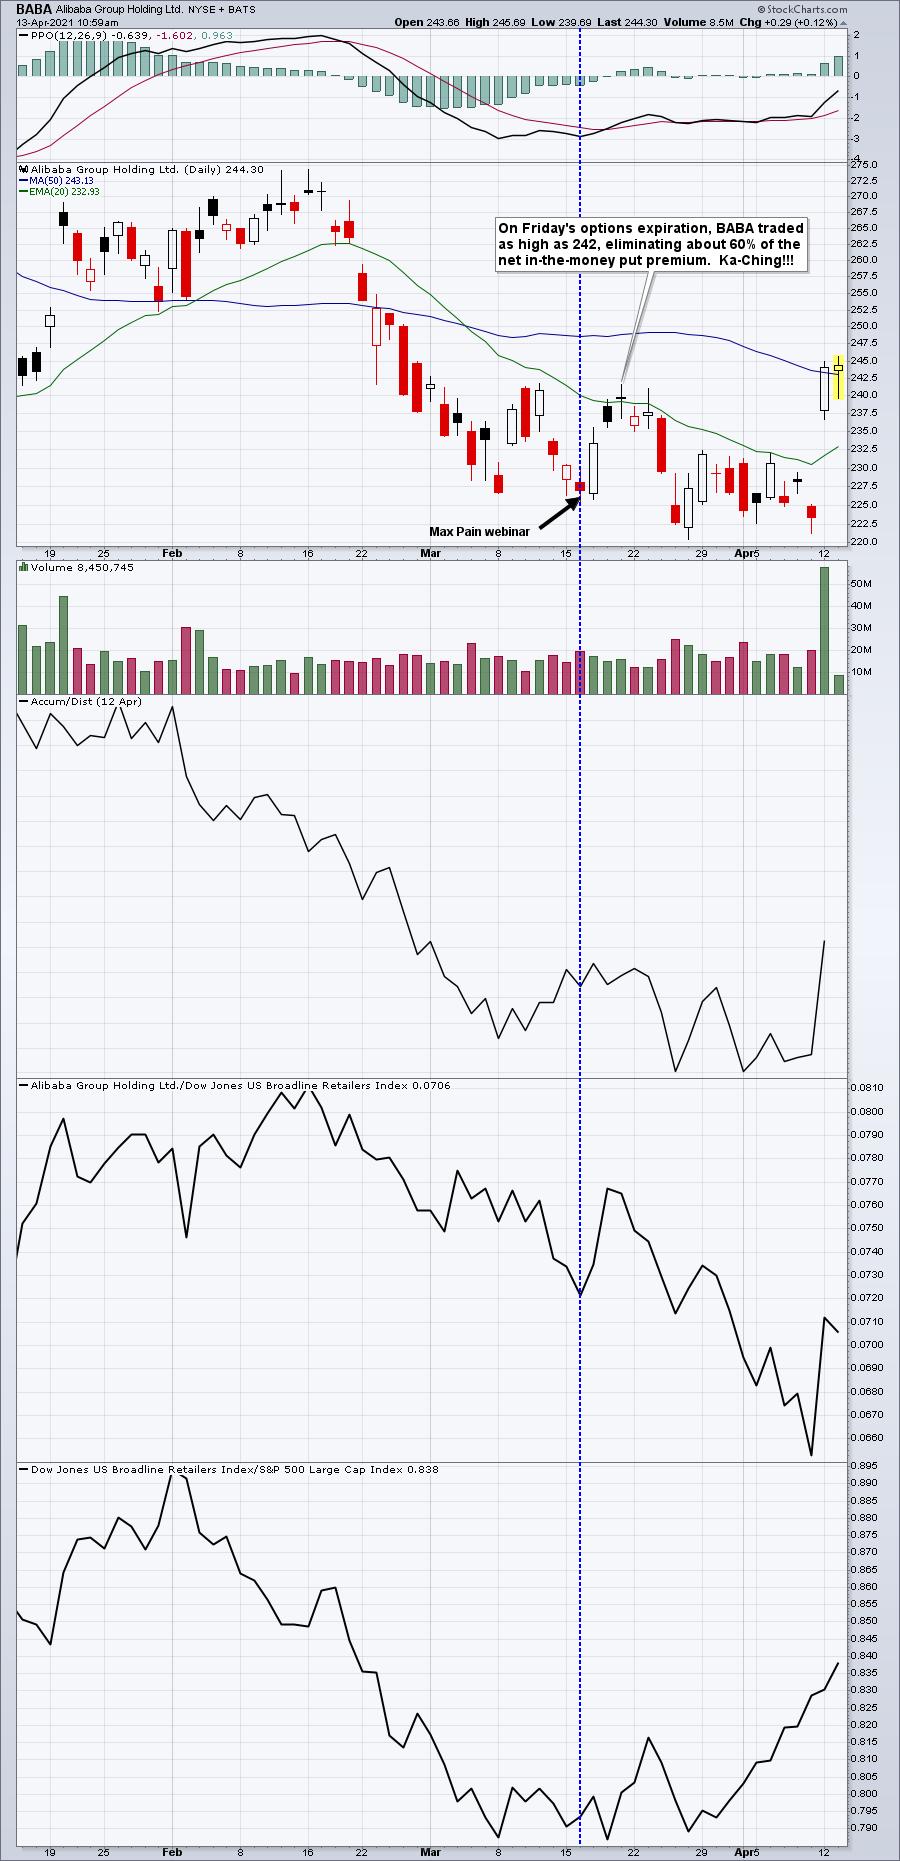
It's like magic! I want you to note one other thing. Once options expiration passed, BABA went right back down. Max Pain is a short-term market inefficiency that traders can take tremendous advantage of.
I don't know for sure that PLUG will move higher. It's never a guarantee, but I use my max pain work as a directional indicator. Based on my April analysis, I believe the most likely direction for PLUG over the next week is higher. Will it work? We'll know if a few days.
If you'd like to join EarningsBeats.com for our fully-refundable, 30-day trial and attend this afternoon's April Max Pain webinar to find out other potential trading candidates like PLUG, CLICK HERE! I'd love to have you!
Happy trading!
Tom


