From a long-term perspective, it's hard to imagine that it's a bad thing for your stock to be setting a fresh 52-week or all-time high. But from a short-term trader's perspective, there could be a world of difference. Two keys are the candlestick and the divergence.
Why Does the Candlestick Matter?
I've been using candlestick charts for many, many years. You can definitely call me a fan. Visually, candlesticks really help me to determine what the market makers might be up to. Remember, they're trading on their own behalf and also on behalf of institutional clients. Earnings, or lack thereof, will ultimately move prices to where they need to go, but short-term it's not that easy. If a market maker is trying to accumulate or distribute a large chunk of shares, crazy things can happen in the near-term and candlesticks help me follow the volatile action in a much clearer way.
I'm not a market maker nor have I ever worked for one, so please don't construe anything I discuss as fact. However, if I was assigned the task to buy at the best price possible for my institutional clients, I'd want a short-term technical breakdown on a stock in order to accumulate a large number of shares at lower prices. Similarly, if I wanted to unload a large number of shares for a client, a false breakout would be one way to do it. These false moves can trigger a very large number of technical traders to buy or sell, aiding market makers in their ability to buy or sell at that best price possible.
Candlesticks, combined with volume, can help us understand what might be taking place and provide us better avenues to trade profitably.
Why Does the Divergence Matter?
It's all about momentum. Divergences between price and momentum oscillators provide us a warning. The chart is the coffin. The divergence is the nail. And the candlestick is the hammer, sometimes quite literally. In my humble opinion, there is no better short-term signal to sell than seeing a negative divergence on a chart, followed by a reversing candle (false breakout). Sometimes, it's a long-term signal. As an example, let's look at Starbucks (SBUX) as of December 31, 2020:
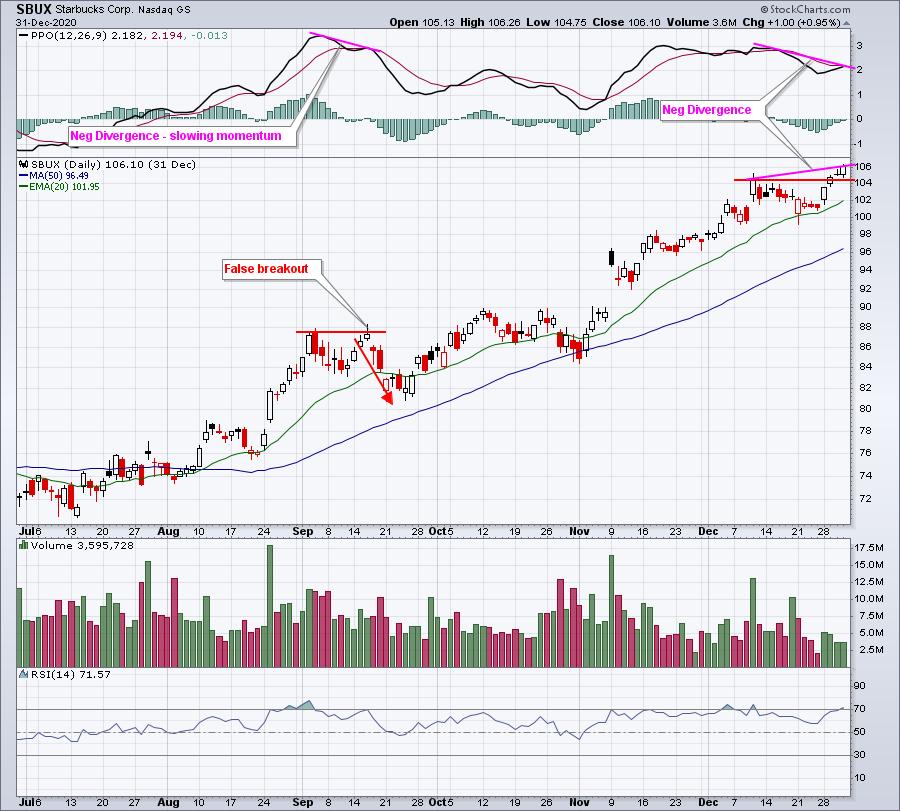
Do you see the attempted breakout in mid-September? Intraday, we had the breakout. By the close, however, it had evaporated. This occurred with a weakening PPO. Not good.
Now, fast forward to the end of 2020. SBUX breaks out on light volume (granted, it was late-December during the holiday season), but that negative divergence is a warning - a warning to watch for any reversing candlesticks, particularly those on expanding volume. Look what happened subsequently:

A bearish engulfing candle printed the first day of the new year and that marked a significant top. It didn't mark a long-term top, but it was VERY important to a short-term trader. Personally, I don't like tying up my capital for weeks while I wait (and hope) for a stock to recover. At the time of the reversal, we don't know for sure that the uptrend will remain intact. Therefore, it's imperative to recognize these signals and act accordingly.
High Quality Breakout
Let me first point out that NOTHING is guaranteed. A breakout may look perfect and still fail. Technical analysis helps us determine the odds of a solid trade, and certainly helps us manage risk, but it NEVER provides a guarantee. Those who don't use technical analysis, or even believe in it, most likely have set the bar too high in the past, expecting technical analysis to be right every time. Don't fall into that trap.
On Wednesday morning, I'll feature a breakout that I believe can be trusted. Breakouts after already extended price charts can be dangerous for a trader. However, the proper setup mitigates this risk somewhat. Be sure to check out our EB Digest newsletter article tomorrow morning and then follow along for the next several days/weeks to see if this stock continues its ascent. I believe it will. If you're not already an EB Digest newsletter subscriber, it's FREE and you may unsubscribe at any time. Also, there's no credit card required. CLICK HERE and enter your name and email address to get started and receive tomorrow's featured breakout!
Happy trading!
Tom


