Rotation is always a part of a secular bull market. It's honestly the glue that holds everything together. During bear markets, when money rotates away from an area of the market, it usually just moves to the sidelines. Bull markets are different, however, as money typically finds its new home in another area. The pandemic has been a perfect example of how this rotation works, but to a much greater degree. We've all heard the "rising tide lifts all boats" adage, but the bull market rotation that we've seen over the past year has been more like a tsunami than a rising tide.
The following two chart illustrates how rotation works:
XLK:
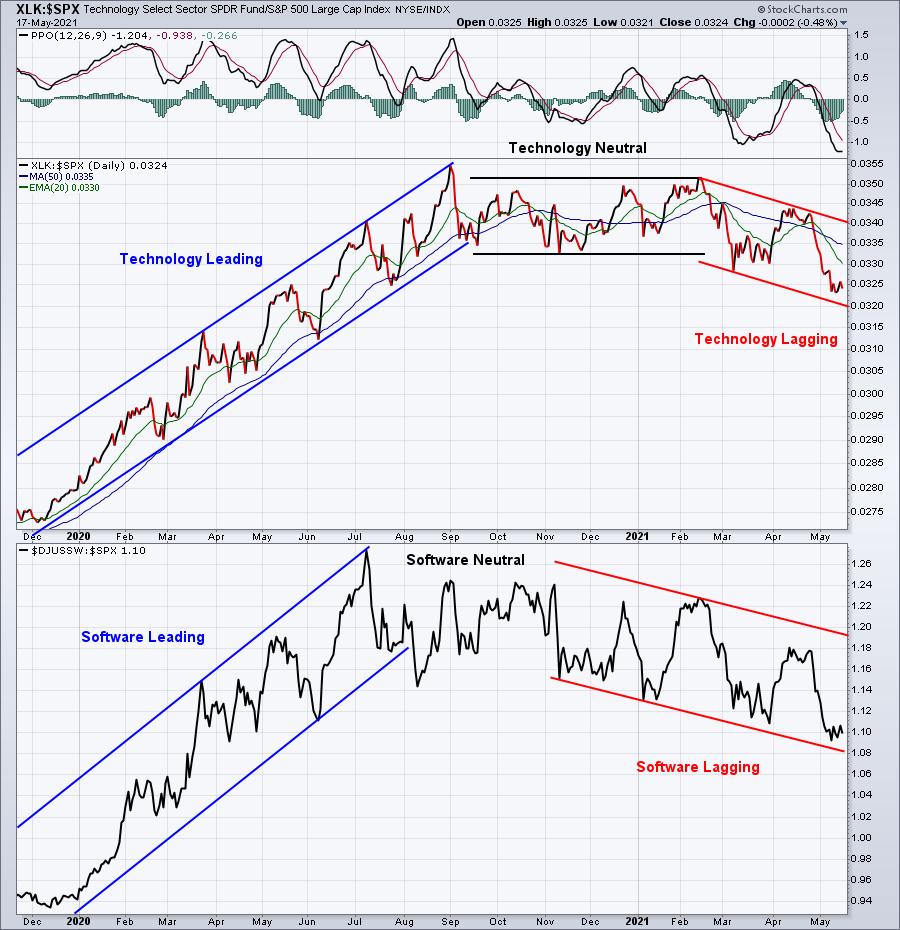
Technology, and its software component, have gone through the good, the bad, and the ugly. It's currently in the ugly phase. It doesn't matter whether you're a long-term investor or a short-term trader, you need to be aware of the rotation taking place. Long-term investors may not care in terms of buy/sell decisions as they tend to hold through everything, but they should at least be aware of the reasons why their portfolios are strengthening or weakening. In a bull market, it's typically due to rotation. For traders, it's much more important to recognize market shifts as soon as possible. Traders will want to deploy capital in different areas as the market winds change. If you're trading technology stocks, the opportunities to make money on the long side will vary greatly depending on whether it's 2020 or 2021. If you've been following technology these past few months, then you know quite well how impacted individual technology names have been in 2021.
But with every thorn, there's a rose (sounds kinda like a song I remember). Enter financials (XLF).
As the re-opening of our economy has occurred, bond traders have been exiting the treasury market. That's sent interest rates surging (ok, "surging" might be a bit dramatic considering how low they were) and one sector that almost always benefits on a relative basis during a period of rising interest rates is financials. Banks ($DJUSBK) and life insurance companies ($DJUSIL) typically benefit directly from higher rates. Let's look to see how the financial sector (and banks) have evolved over the past 18 months, while adding the 10-year treasury yield ($TNX) to the mix:
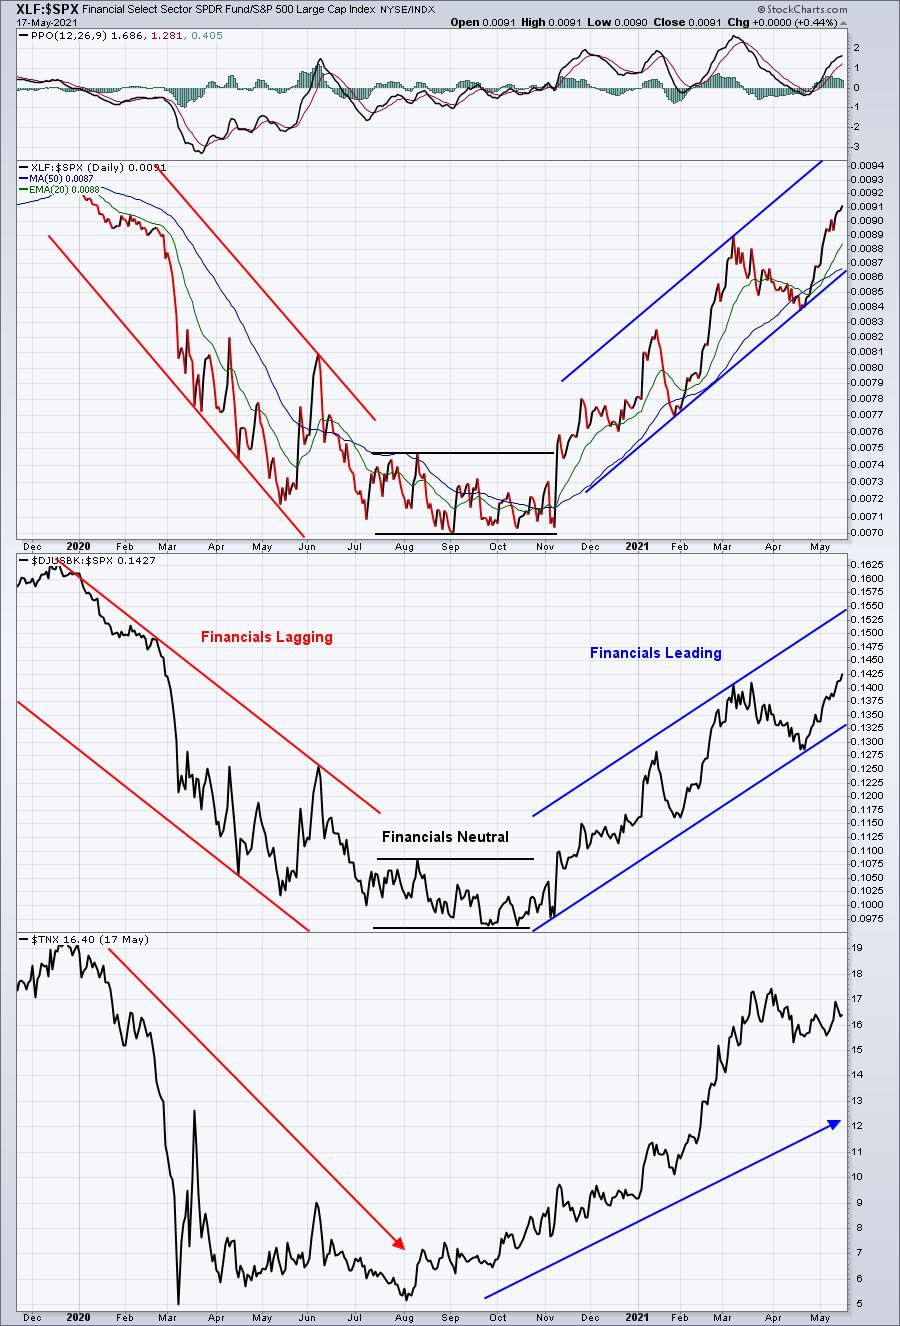
If you look at the two charts above and think "mirror image", well that's what I think when I look at it.
For more than a year, we designed our portfolios to take advantage of the leading technology sector and that's exactly what they did. Our Model Portfolio had quarterly returns as follows (S&P 500 quarterly return in parenthesis):
- February 19, 2020 - May 19, 2020: +4.63% (S&P 500: -13.68%)
- May 19, 2020 - August 19, 2020: +35.33% (S&P 500: +15.46%)
- August 19, 2020 - November 19, 2020: +17.03% (S&P 500: +6.13%)
- November 19, 2020 - February 19, 2021: +32.26% (S&P 500: +9.07%)
That's serious outperformance over the course of just one year. BUT, we felt the negative effects of being overweight technology in this latest quarter (February 19, 2021 - May 19, 2021) as the market rotated much more strongly towards other sectors (like financials, industrials, materials, and energy). Our strategy with these portfolios is truly a combination of "buy and hold" and "active trading". The buy and hold mentality comes from us holding our 10 equal-weighted stocks for the entire 90-day period. But at the end of each 90-day period, we re-select 10 equal-weighted stocks to hold for the next 90 days. That's the active trading side of the strategy. The overall idea is to attempt to always be on the side of momentum. In our latest quarter than ends tomorrow, the Model Portfolio is down 13.56%, while the S&P 500 is up 6.57%. Visually, it's easy to see why we've underperformed. We continued riding growth stocks as they literally maintained their support during that "neutral phase" I identified on the earlier charts. The growth strategy broke down the day after our portfolios were announced - on Monday, February 22nd. check out this chart:
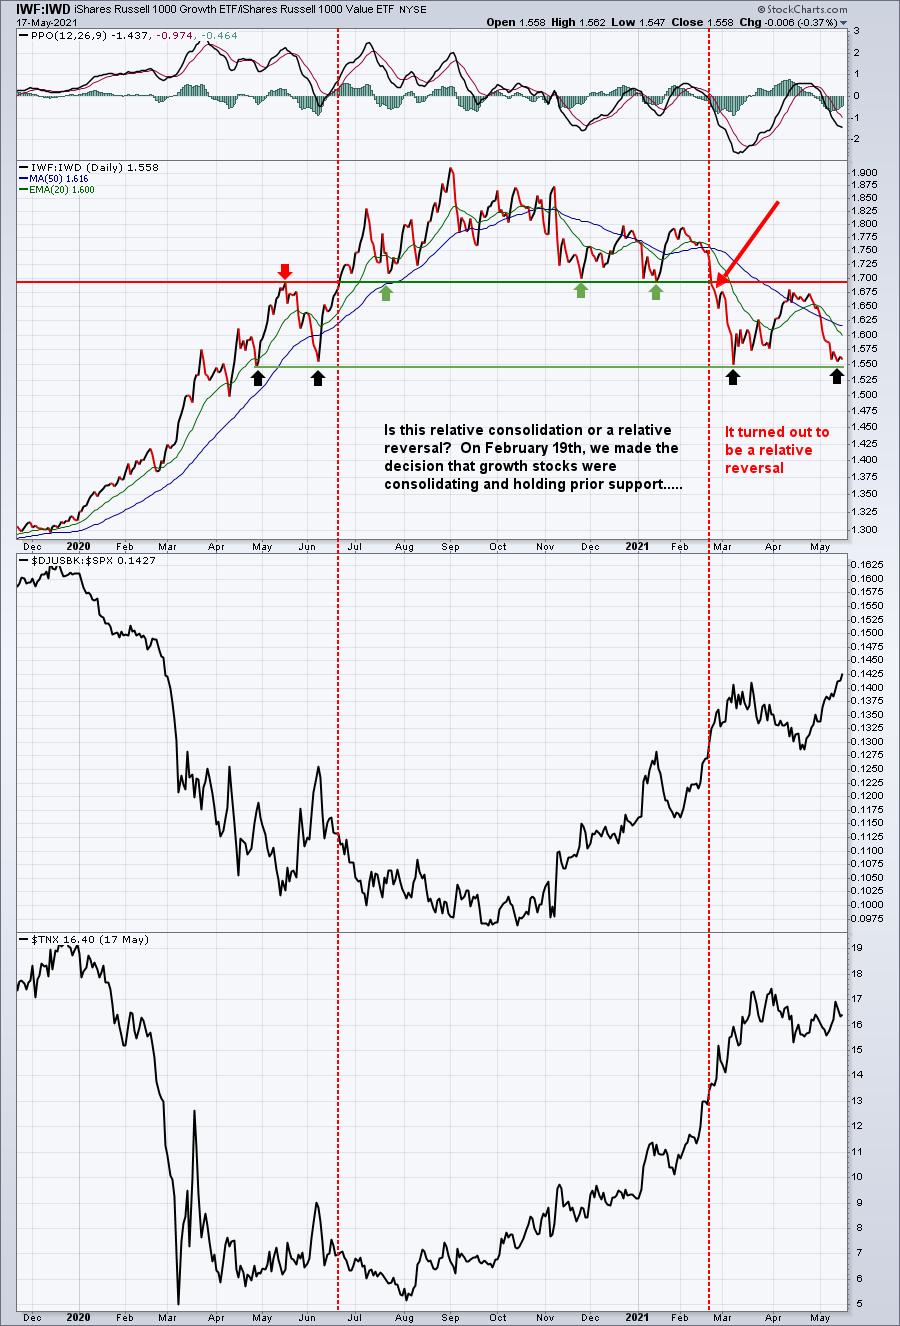
No system is perfect or guaranteed. And our poor performance last quarter isn't washed away by the 4 preceding excellent quarters. Investing is a humbling experience and as I've said for years, you better be trying to learn every day. You NEVER know it all.
So that's why we're back at it again. On Wednesday, May 19th, at 5:30pm ET, we'll announce to our EarningsBeats.com members the 10 equal-weighted stocks to fill out our 4 portfolios. If you'd like to see our "performance since inception" on each of our 4 portfolios and learn more information about the event, CLICK HERE.
Happy trading!
Tom


