I'm a momentum trader, so I look for consistent uptrending patterns before I commit capital. As I've said many times before, I'm most comfortable trading leading stocks in leading industry groups. These are the stocks that Wall Street favors and, in my opinion, offer up the best odds in terms of winning trades. Getting caught in a suddenly consolidating stock, though, is very frustrating. I'm not interested in following a stock through all of its ups and downs. It does work to trade off key support levels, just be sure to take profits if resistance is tested.
On daily charts, there are a few key developments that help to trigger a longer period of consolidation. The first is a negative divergence and the second is deteriorating relative strength. It's very normal for a leading stock to go through a period where its price stabilizes while many of its peers climb. That results in short-term relative weakness. It's not a bearish signal long-term, but is a signal that short-term traders should recognize. Two other technical indications of a potentially consolidating stock would be a false price breakout and the daily PPO turning negative.
Let's use NXP Semiconductor (NXPI) as a case study:
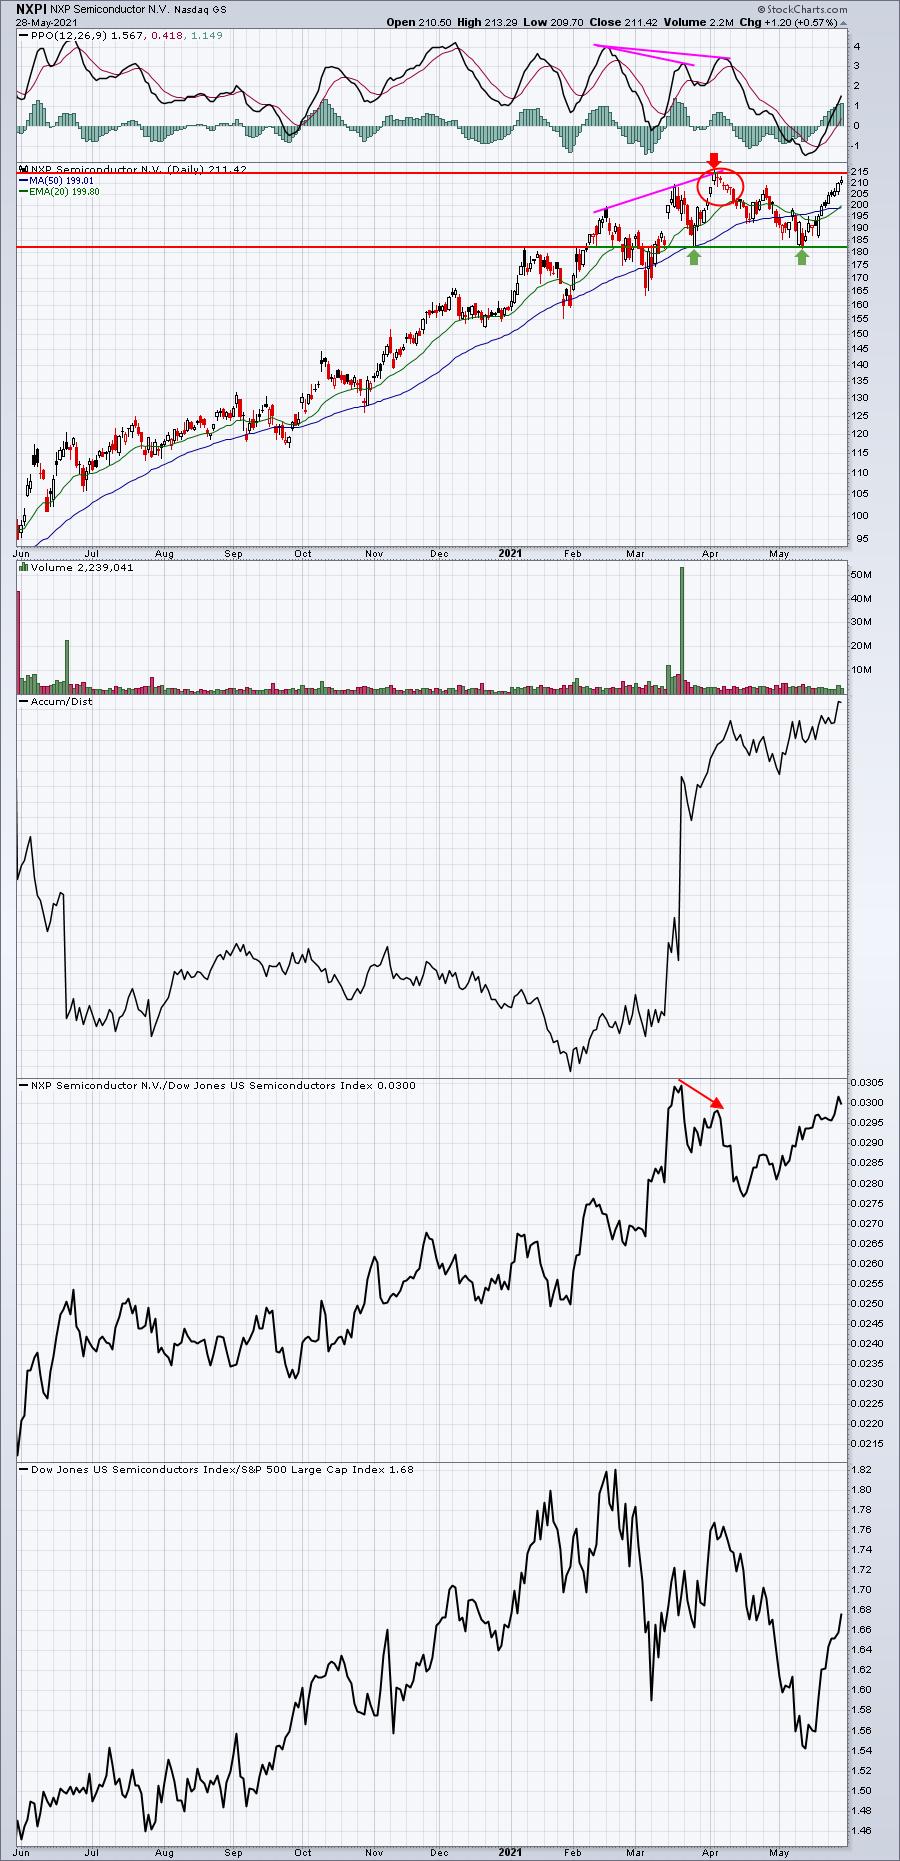
The red circle highlights the false breakout. This occurred after the negative divergence printed and that April high coincided with a failed relative breakout. In late-April, the daily PPO turned negative. None of this means the overall uptrend has ended, which is very important to understand. It's simply a signal to me as a short-term trader to pay much closer attention to the support and resistance lines. So, until further notice, I'd trade the range from 182-215. If NXPI were to pull back and test its rising 20-day EMA, I'd consider trading it, but would make sure I kept a tight closing stop beneath that 20-day EMA, recognizing the possibility of another trip to support.
A perfect example of how this works is Amazon.com (AMZN):

AMZN topped in September and it's still in a trading range! Holding through all the ups and downs is a killer if you're a short-term trader. Buying and holding AMZN is fine as I believe this lengthy base will ultimately bode quite well for the stock. But a short-term trader is looking for more immediate results.
Memorial Day, Monday, May 31st, marks the beginning of our two-week annual special, our best deal of the year at EarningsBeats.com. Our normal monthly rate is $147 ($1764, or $147 times 12). Until June 15th, we're offering an annual special of $997, which includes 2 free bonus months, or 14 months for $997 (plus a no-cost 30-day trial for new members, so actually 15 months). Essentially, it's a 50% off sale. You can sign up now for your 30-day trial and you'll have two weeks to decide if you'd like to take advantage of our special - all at no cost. CLICK HERE to get your no cost trial started TODAY!
Happy trading!
Tom


