In The News
It was a light week for headlines as there wasn't much in the way of either economic or earnings news. Thursday did provide us our next glimpse into the inflation story as May CPI jumped 0.6%, ahead of the 0.4% expectation. That left headline CPI at 5.0% year over year, the highest we've seen since 2008. The stock market, however, didn't bat an eye. For me, it's much more about market reaction and rotation, and less about the news itself. It's a big mistake to interpret the news and then try to tell the market how it should react. Instead, be aware of the news and the possible ramifications, but don't tell the market anything. LISTEN to the market.
While the April inflation reports, both CPI and PPI, did short-term technical damage to U.S. equities, the reaction to May's CPI report was quite the opposite. This time, we saw the S&P 500 close the week at its all-time high weekly close and the NASDAQ, which struggled on a relative basis during the April inflation-related selling, led the action this time. The message I'm receiving from Mr. Market is that the worst of the inflation news is priced in. Here's a chart of the S&P 500 with panels below it that illustrates the positive relative response in the tech-laden NASDAQ 100 (QQQ:SPY) and in the growth vs. value theme (IWF:IWD):
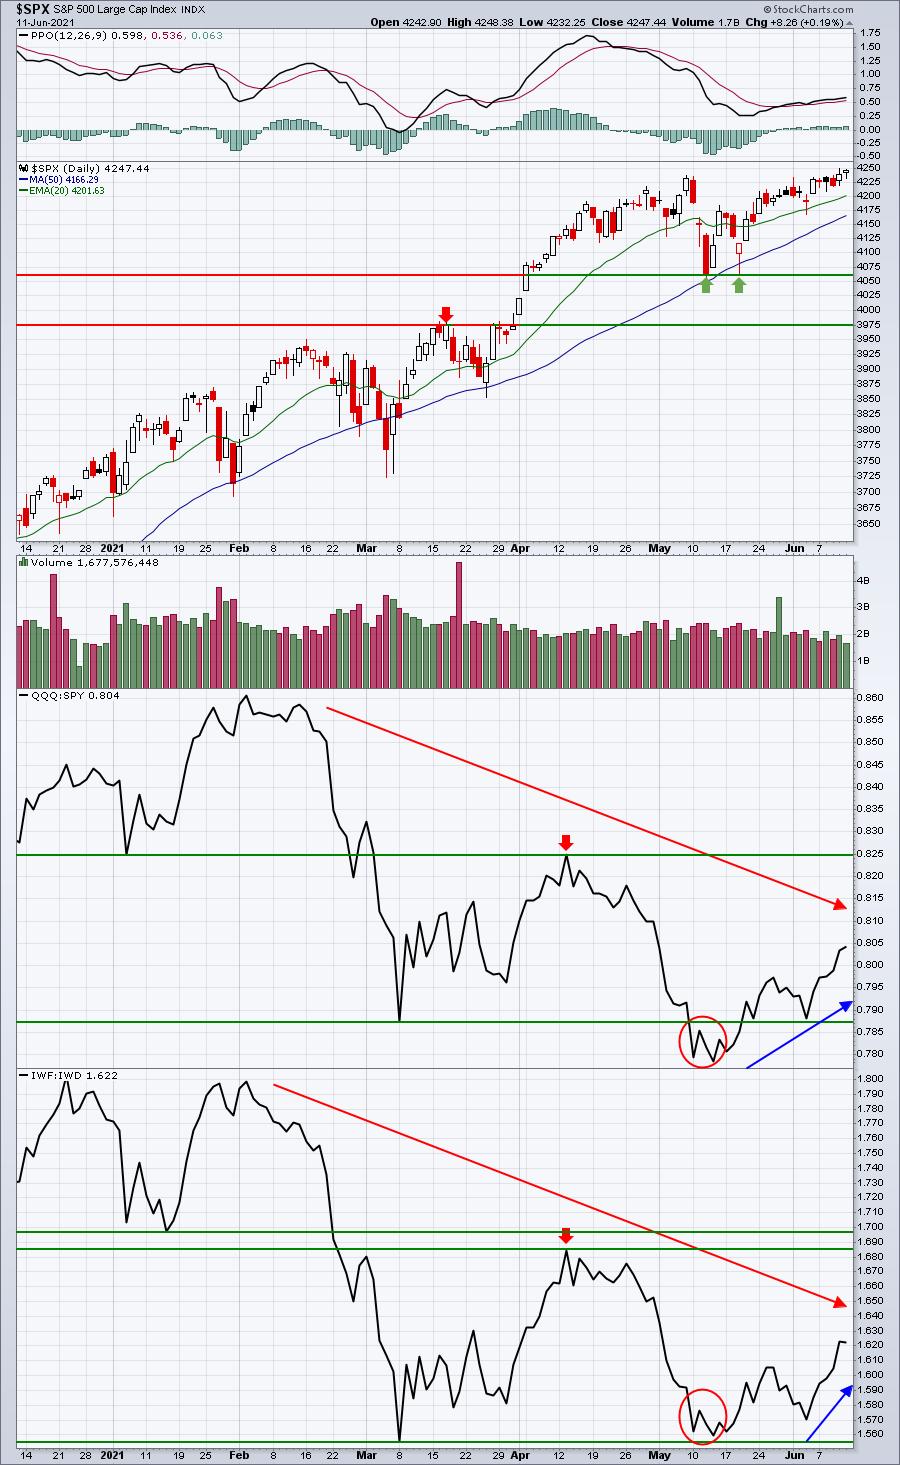
I want to point out that, while there are clear positives on this chart, we're most definitely not out of the woods just yet. I love the fact that the stock market traded as if there were no inflation issues these first couple weeks of June. But the longer-term relative picture in those two bottom panels is ambiguous at best. The QQQ:SPY relative downtrend remains intact with lower relative highs and lower relative lows in place. The IWF:IWD relative downtrend shows a potential relative double bottom, but must clear that relative high in between to start a relative uptrend. Nonetheless, June's action beats the heck out of the alternative. Personally, I believe - feel free to disagree - inflation is not a problem at all. Base effects and a severe supply chain disruption that will be remedied over time are to blame for the spiking inflation numbers. The April numbers caught the market more by surprise, in my opinion, which resulted in the poor performance during the first half of May (see red circles above). Market participants took the latest inflationary report completely in stride, which, at a bare minimum, is great news for stocks in the short-term. I believe it will be good news for the long-term as well.
It's not just stock market investors that cheered the poor inflation news. Higher inflation eats away at treasury returns, so holding onto treasuries during an inflationary period is not generally what we'd expect. So as the May CPI report was anticipated, then released, check out how the 10-year treasury yield responded:

Both April and May surprised to the upside with inflation numbers, but we've seen two completely different reactions in the bond market. You must understand first that the direction of treasury yields moves 100% inverse to the direction of prices. In April, bonds sold off hard - as I would expect - and yields surged as inflation came in much hotter than expected. But check out the response thus far this month. Investors were buying treasuries! No one in their right mind would buy treasuries at the beginning of an inflationary surge. It makes no sense.
My conclusion is that both the stock market and bond market are sending us a unified message loud and clear. Inflation is not a long-term problem.
Sector and Industry Group Highlights
If someone had told me last week that the May CPI would come in much hotter than expected and that 6 of our 11 sectors would be higher last week, I'd have guessed that technology (XLK), consumer discretionary (XLY), and communication services (XLC) - the three most aggressive and growth-oriented sectors - would have been among the 5 sector casualties. But that was not the case:

They were among the sector winners instead - very impressive indeed. Either we saw a great big head fake last week or the stock market is looking ahead and past the temporary surge in inflation. I'm betting on the latter, though, based on history, I'm not expecting the stock market to soar during the summer months. We still have September ahead and that's easily been the worst calendar month of the year for decades. The financial media can still have significant short-term effects that are counter to the actual longer-term direction (See 2020 Pandemic). The big money investment firms play the financial media like a fiddle, so trust the charts, not the headlines.
At EarningsBeats.com, we keep an industry group relative strength ChartList (downloadable by our members that are also StockCharts.com Extra or Pro members). If I pull this ChartList up in Summary form for a one week period, we can quickly see which industry groups outperformed last week:

Wait a second! Renewable energy leading? And software - a high growth area of technology - in the 6th spot? Clothing & accessories in 10th? How can that be? And where are the materials industry groups with all this inflation? Oh wait, I found 2 of them. Here are the worst performing industry groups last week:

Aluminum and commodity chemicals were the 4th and 9th worst performing industry groups. Once again, that's not what I would have expected with the hot inflation number out on Thursday.
Stocks
I scanned for the Top 5% of weekly performers within the following major indices:
- Dow Jones Industrial Average
- S&P 500 (Large Cap)
- NASDAQ 100
- S&P 400 (Mid Cap)
- S&P 600 (Small Cap)
I downloaded these top performers into one ChartList and annotated key technical breakouts/patterns. There are 82 charts in all. To give you a sense of the type of research that we do and highlight our platform at EarningsBeats.com, you can download the following ChartList into your StockCharts.com account (provided that you're an Extra or Pro member):
When you're prompted for a password, use PERFORM12 and this will allow you to complete the download. If you're a Basic member of StockCharts.com or a non-member, you'll be able to view the charts one-by-one, but won't be able to download. Once downloaded, if you view the ChartList in "Edit" form, you'll see notes under the "Comments" column. Those are the charts where I annotated key technical developments.
Thanks for your support, I hope you enjoy the ChartList! Do me a favor. If you're not already a FREE EB Digest subscriber at EarningsBeats.com, CLICK HERE to enter your name and email address. You'll have to scroll down below our Spring Special announcement. It is completely free newsletter published 3x per week, there is no credit card required, and you may unsubscribe at any time.
We have a free event on Tuesday at 4:30pm ET, "June Max Pain", which will discuss the potential options-related impact on the stock market this week. I'll provide potential trading candidates to take advantage of market maker "thievery" as we move into options expiration on Friday. All EB Digest community members will be invited as this will be open to everyone in our community, not just our paid subscribers.
Happy trading!
Tom


