One key element of our service at EarningsBeats.com is to address monthly max pain, which I define as the point at which in-the-money call premium completely offsets in-the-money put premium. As of Tuesday's close, there was a TON of net in-the-money call premium. On the SPY alone, I calculated the total to be roughly $925 million. That's just one ETF. Think market makers might have a little incentive to drive prices lower?
The SPY (ETF that tracks S&P 500) was at 444.06 at Tuesday's close when we discussed max pain issues. The max pain level was 431.31. Since Tuesday's close, check out the SPY chart:
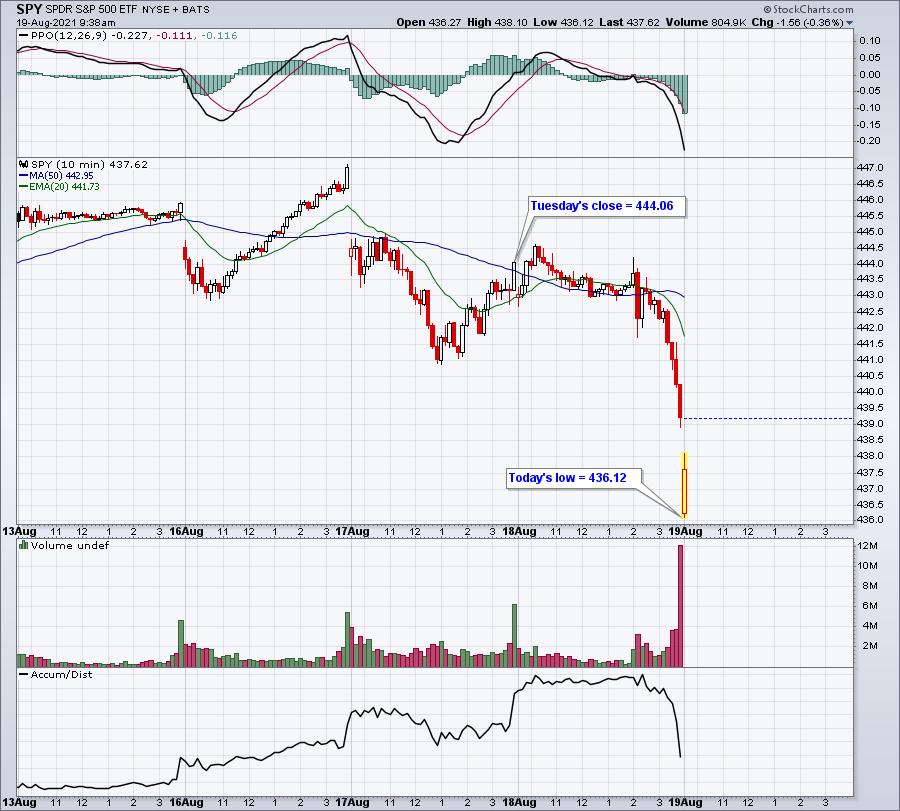
The net in-the-money call premium drops by $70 million for every dollar the SPY falls. So, already since Tuesday's close, we've seen the SPY fall 8 bucks to today's low, trimming that net in-the-money call premium by $560 million. Crazy!
I also want to mention that I did an analysis of trading this year (2021). We've had 158 trading days thus far. 89 have been higher, 69 have been lower. I further broke down performance during options expiration week. Here is how the S&P 500 has performed this year during options expiration week (Tuesday through Friday):
- Tuesdays: 2 up, 6 down, annualized return -57.03%
- Wednesdays: 3 up, 5 down, annualized return -54.28%
- Thursdays: 2 up, 5 down, annualized return -18.02%
- Fridays: 1 up, 6 down, annualized return -99.34%
If we strip out the Tuesday through Friday options expiration week activity, the balance of the year has seen 81 up days and just 47 down days. You want to see your trading results pick up? Sit out options expiration week, or consider shorting those stocks that are optionable with tons of net in-the-money call premium.
Let me explain it another way. The S&P 500 began the year at 3756.07. At Wednesday's close, the S&P 500 was at 4400.27. That's a net gain of 644.20 points. Here's the breakdown in points gained (lost) during non-expiration week and expiration week:
S&P 500, beginning of year: 3756.07
Tuesdays-Fridays of options week: -284.11
All other days of the year: +928.31
S&P 500, August 18th close: 4400.27
How much clearer does this picture have to get? All the headlines and fear mongering serves one purpose and one purpose only. It lines the market makers' pockets. This month it's taper talk. Recently, it's been hyperinflation. Pick a topic each month. If taper talk was truly impacting our markets in a big way, the biggest response should have been the selling of bonds and rising treasury yields. At the time of yesterday's FOMC minutes release, the 10-year treasury yield stood at 1.30%. After the announcement, we've seen the yield move as low as 1.26% this morning. Traders are BUYING treasuries, sending yields lower! If you knew the Fed was about to taper its bond-buying program, wouldn't you want to sell your bonds, driving yields higher? That's not what happened in the bond market. So why should taper talk have such a major impact on stocks? I'll tell you why. Options expiration.
The bottom line is that there are plenty of short-term inefficiencies in the stock market and monthly options expiration is just one of them. But if you like to short-term trade and don't understand the impact of options expiration, you're WAY behind those in the know. Smart money always prevails.
I'll be announcing the 10 equal-weighted stocks in our 4 stock portfolios later today. It's our portfolio "DRAFT"! If you'd like to see which stocks made our list for this upcoming 3-month period, you can sign up for a 30-day FREE trial. CLICK HERE to subscribe! Our flagship Model Portfolio has gained 217% since its inception on November 19, 2018. The benchmark S&P 500 has gained just 64% by comparison.
Happy trading!
Tom


