I've studied the major indices from a historical perspective for decades. I believe there are reasons why bullish and bearish tendencies develop over time and why such seasonality repeats itself. For instance, I've published articles here in this blog and in ChartWatchers discussing significant tendencies before, during, and after earnings season. I believe the numbers I've produced are undeniable. One part of this study suggests that the first half of calendar quarters are much stronger than the second half of such calendar quarters. Let's look only at the current secular bull market, which I define as April 10, 2013 through today (April 10, 2013 was the day that the S&P 500 cleared tops from years 2000 and 2007). Average S&P 500 performance by each half of calendar quarters since 2013 are as follows:
- January 1 - February 15: +4.64%
- February 16 - March 31: -4.83%
- April 1 - May 15: +4.59%
- May 16 - June 30: +3.28%
- July 1 - August 15: +4.17%
- August 16 - September 30: -0.97%
- October 1 - November 15: +4.50%
- November 16 - December 1: +2.71%
The first half of each calendar quarter outperforms the second half of that calendar quarter. Q1's bifurcation has been extreme. The quarter, overall, has been flat throughout this secular bull market. It's been exceptionally strong during the first half (best half quarter of the year), but extremely weak during the second half (worst half quarter of the year).
Today, we begin that August 16 through September 30 period, where we've seen the S&P 500 lose ground, despite the secular bull market environment. StockCharts.com has a seasonality tool that you can use to gauge seasonal strength/weakness as well. Here's how the S&P 500 has performed by calendar MONTH since 2013:
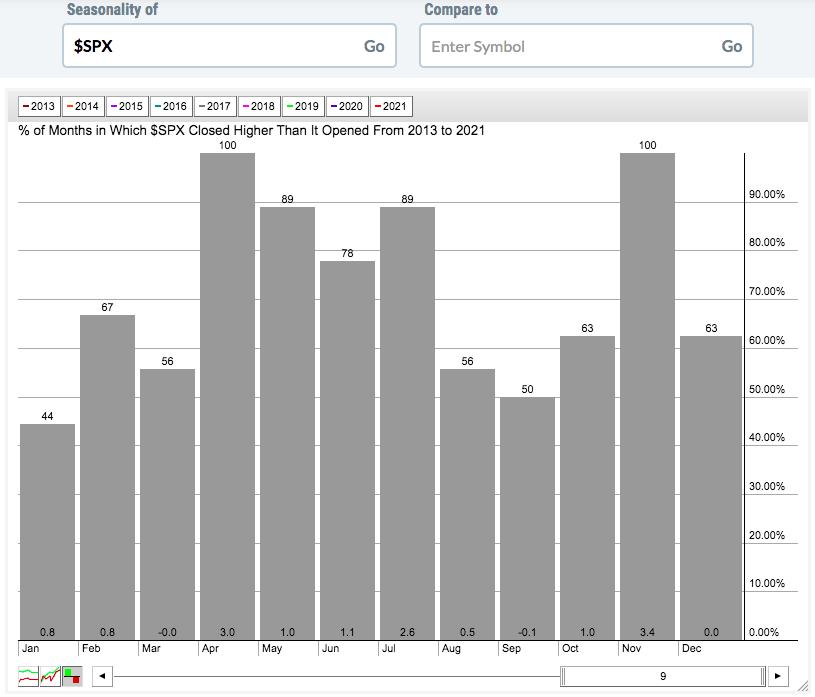
While we've seen substantial gains in the S&P 500 since 2013, focus on the average returns during the 4 calendar months that END calendar quarters - March, June, September, and December. Only 1 - June - has averaged gaining ground. 6 of the 12 months average gaining at least 1%, including incredible strength in November (averages +3.4%) and April (+3.0%).
It's clear to me that these are seasonal patterns that we need to be aware of. But should we sit the market out? Or even think about short selling? Well, that's a personal decision and I'm not licensed to provide anyone advice, but if a secular bull market tells us one thing, it's that trying to time tops is an exercise in futility. I have seen so many tops called throughout the duration of this bull market and yet, here we sit, at all-time highs. Long-term investors should be encouraged by the strength and resiliency of this bull market. I continue to believe that long-term investors will be rewarded by remaining fully invested and riding the inevitable bumps along the way.
Short-term is a different story in my opinion. As a swing trader and creator of our portfolios at EarningsBeats.com, each of which represents 10 equal-weighted stocks designed to be held 3 months, I'll be discussing our strategy later today at 4:30pm ET. If you'd like to join the event, "Sneak Preview - Top 10 Stock Picks", it's completely FREE. In addition to the live event, we'll also send out the recording to everyone in our EarningsBeats.com community, including our free EB Digest subscribers. To join the event later today, you can either CLICK HERE to register (enter name and address - no credit card required) for our free newsletter OR join using the link on our HOME PAGE (after 4:00pm ET, which is when the room will open). If you choose the latter option, we'll make sure you get added to our EB Digest newsletter and receive the event recording.
Happy trading!
Tom


