It's an interesting question. After all, during periods of economic expansion, transportation stocks ($TRAN) should ship more goods, report higher profits, and be rewarded with higher stock prices. If you're not already aware, the TRAN and the S&P 500 have a very tight long-term positive correlation. When we see inverse correlation, red flags should go up. Below is a 6-month chart that features the price action of both indices:
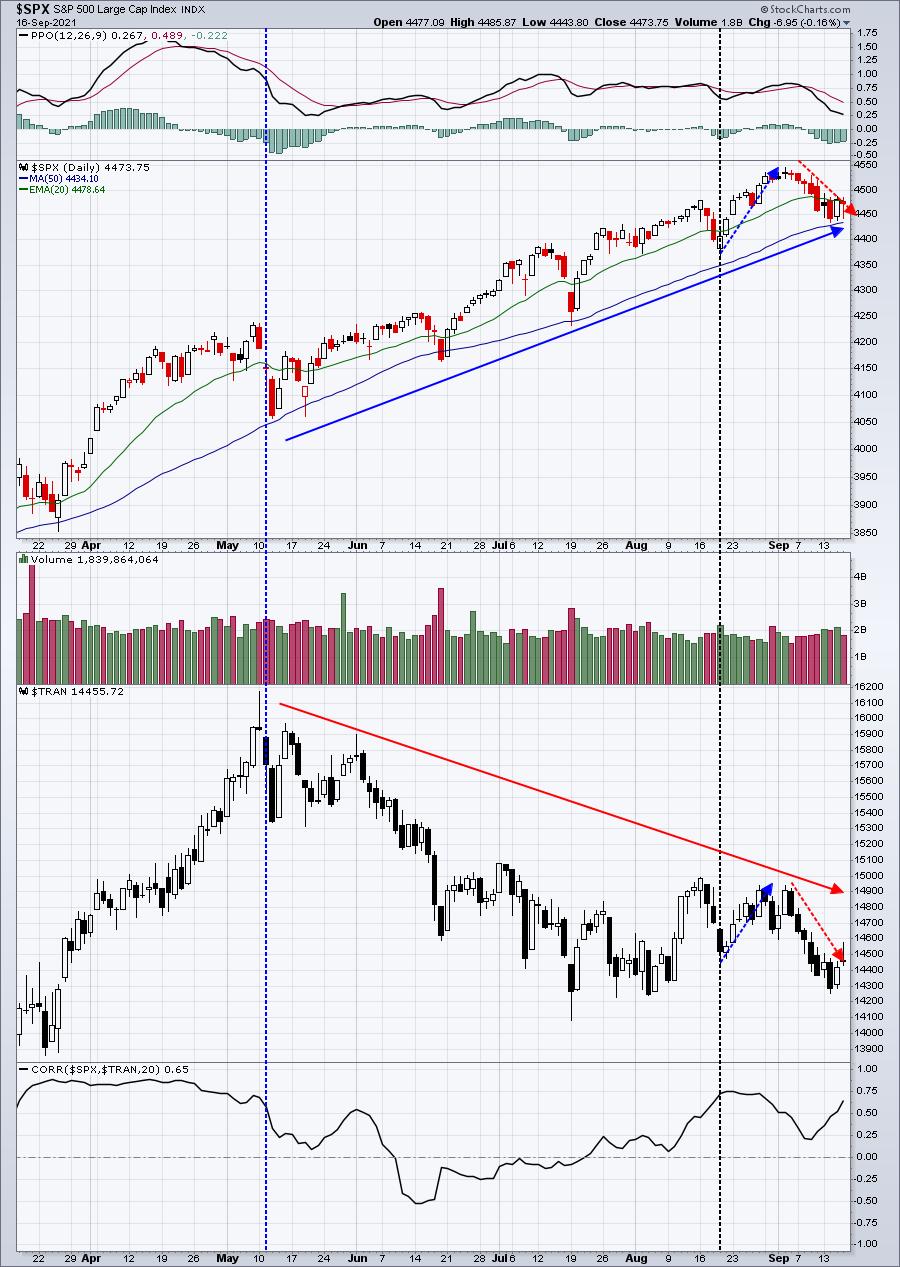
During the second week of May, we saw the S&P 500 and TRAN top (blue-dotted vertical line). After a quick pullback in the S&P 500, it quickly resumed its prior uptrend. The TRAN, however, failed to re-establish its uptrend and, instead, began a multi-month downtrend. You can see the correlation reach a low of -0.50 (inverse correlation) before turning higher. But why did it turn higher? The S&P 500 kept going up and the TRAN has continued moving lower, right? Well, the correlation default is 20 periods, so on a daily chart it's 20 days. The black-dotted vertical line shows the last 20 days (to the right of the line). It looks like the S&P 500 and TRAN are mostly following one another over the past 20 days, so the correlation has turned significantly positive. This suggests we move out to a longer-term weekly chart and see how the current weekly correlation stacks up with history and what signal it could be providing us:
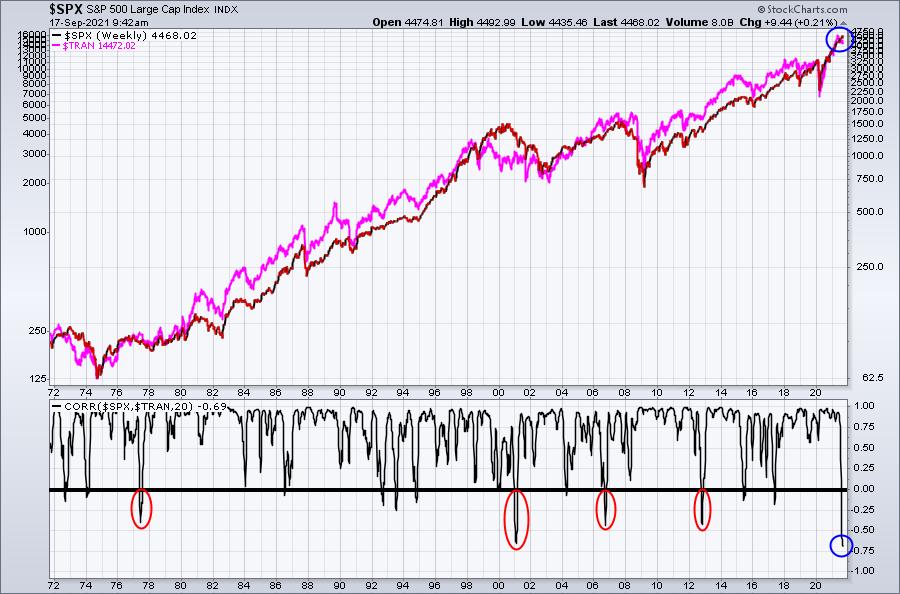
Now THIS is an interesting chart. The inverse correlation between these two indices has not been stronger over the past 5 decades! Remember, the correlation default (which I've used) is 20 periods - so, in this case, 20 weeks. That takes us back, coincidentally, to late April. In the daily chart, that's very close to when the divergence in performance began. The red circles above highlight the previous periods in which inverse correlation exceeded -0.25. There have only been 4 other occurrences. You can see that there's been very strong positive correlation over 20 weeks throughout the past 50 years. It's really not subject to debate. Transports and the S&P 500 definitely tend to move together. Of the four previous inverse correlations similar to the current period, three of them (1977, 2001, 2006) accompanied bearish periods in history. The only one that was different was in 2012 and that surge in transports reversed the inverse correlation and coincided with the April 2013 breakout on the S&P 500 above the 2000 and 2007 double top.
So what does all this mean? Well, I'm not sure 20 weeks is a great barometer of correlation in the current market environment. We're coming out of a 100-year pandemic and market behavior has been so unpredictable. It might be more useful to use a monthly chart and see how correlation plays out over 20 months. Here's what the monthly chart and correlation look like now vs. history:
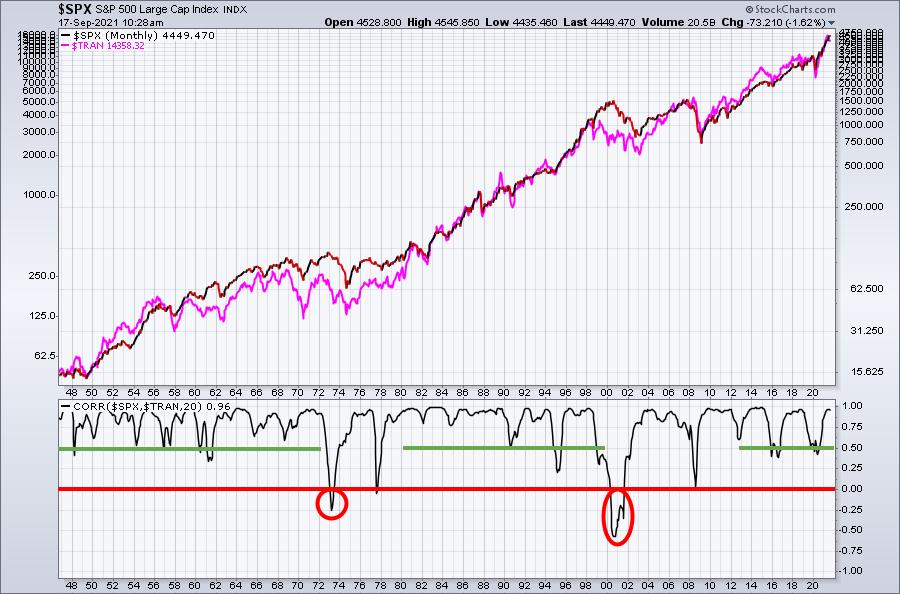
Inverse correlation over 20 month periods is extremely rare. Both breaks below the zero line (thick red horizontal line) started lengthy secular bear markets in the 1970s and 2000s. The thick green lines show that monthly positive correlation typically does not fall below .50 during secular bull markets. The 1950s and 1960s represented a two-decade secular bull market as did the 1980s and 1990s. Currently, we still have very solid positive correlation, so we'd need to see much more weakening in transports while the S&P 500 rises in order to generate a more bearish signal.
Conclusion
I have my concerns about 2022. I believe it is going to be much more volatile for the benchmark S&P 500 next year. But there are few, if any, accompanying bear market signals right now. As a result, I wouldn't be expecting a secular bear market. Instead, I'm looking for many more years of this secular bull market. I'd also look for transportation stocks to outperform in Q4, but beyond that let's just keep an eye on the above charts and make calls as we have more information.
I'm planning to highlight my favorite transportation stock for Q4 in our Monday EB Digest newsletter. It's free and available for everyone. There's no credit card required and you may unsubscribe at any time. To register with your name and email address, CLICK HERE.
Also, don't miss any of my articles here at Trading Places. Scroll down and subscribe to my blog with your email address. Then simply hit the green "Subscribe" button. Then all of my Trading Places articles will be sent to your email address the moment my article is published!
Happy trading!
Tom


