One of my favorite times to trade is leading up to options expiration, because it's one time where I feel fairly comfortable which side of the trade that market makers are on. It's options expiration week and a time where we do a lot of research of EarningsBeats.com, trying to uncover great trading opportunities for our members. Of course, nothing is a guarantee, but I do believe tendencies are in our favor.
A Look Back
2021 has been a strong year for options-related trading as we've sped towards prior options expiration Fridays (and into the following week). I wanted to point out a few of our "max pain" related calls from August, so that you can get a feel for what we look for. Let's start with the major indices. I always review all call and put open interest the Tuesday before options expiration Friday for both the SPY and QQQ (ETFs that track the S&P 500 and NASDAQ 100, respectively). One month ago, here's where the SPY was and where "max pain" resided:
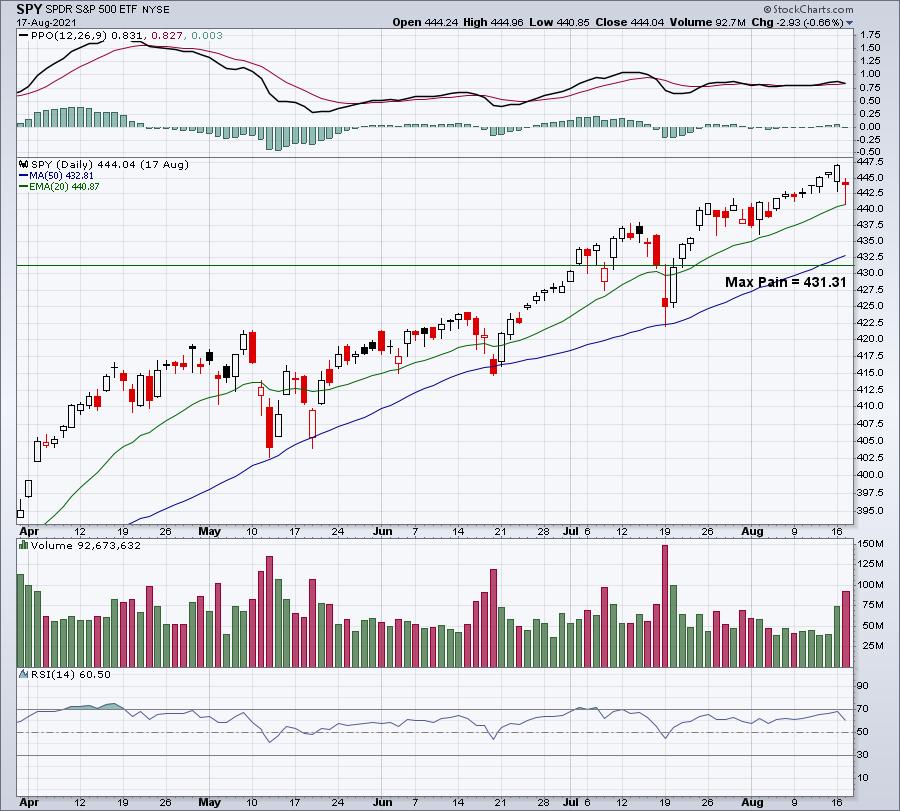
At that time, there was a total of $855 million of net in-the-money call premium just on the SPY. Every dollar that the SPY dropped would save market makers roughly $70 million. While the SPY never moved down to that 431 level, it did drop over the next two days to hit a low of 436.12. It's extremely important to keep in mind that market makers can protect themselves against loss in the event that the SPY went higher. It's the covered call strategy, where you can buy a stock and sell a call. Owning the stock protects you against losses from selling the call. That's why max pain's directional clues don't always work. Again, it's very important to understand that this strategy will not work every time. However, it's possible for market makers to make a windfall of profits. Consider this scenario:
Trader A wants to buy 10 calls of ABC stock with a strike price of $20. The stock currently trades for $21. So Trader A must pay $1 for this call because it's one dollar "in-the-money", PLUS a premium for time and volatility. If there are no willing sellers, then a market maker provides the liquidity by selling those 10 calls. If the market maker doesn't buy the stock and ABC stock shoots higher to $30 before the date of the option, the market maker will lose a small fortune. However, if the market maker sells the 10 calls and turns around and buys 1000 shares (1 call equals 100 shares), then that market maker is protected against that price surge higher. The premium paid for those 10 calls becomes the profit to the market maker. But what if the stock were to move to $30 a week before options expire and the market maker decides to get aggressive? The market maker could sell the ABC stock position at $30 and begin shorting ABC shares to drive the price lower. What if the market maker drives the price down $10 by shorting back to the $20 level. Let's recap what would happen in this scenario.
Trader A loses 100% of his/her capital on this trade. The calls expire worthless. But how did the market maker do? Well, the long position from $21 to $30 netted a $9 gain, or $9,000. The short position netted profit from wherever shorted down to $20. And how about that call? 100% profit. They make money on their long position, make money on their short position, and completely confound the Trader A, who watches his/her entire capital lost in a matter of days as ABC stock falls apart short-term from the sudden overhead supply provided by the market maker. Think this doesn't happen?
I'm not suggesting this scenario plays out every time. Of course it doesn't. But I have seen it play out plenty of times.
Real Life Examples
Ok, so let's move on from ABC stock and Trader A. Let's discuss real scenarios from last month. On Tuesday, August 17th, I held an "August Max Pain" webinar and provided a total of 8 potential trading candidates to our EB.com members where stocks had made significant moves in both directions, were optionable, and were subject to a possible advance/decline based on max pain. Of the 8 potential trades, I view all 8 as successful trades, but some were much more successful than others. Here are two that were unbelievably profitable:
TCOM:
At the time of our August 17th webinar, TCOM traded at 24.06 and max pain resided at 27.88. Here was the chart we provided to our members at that time:
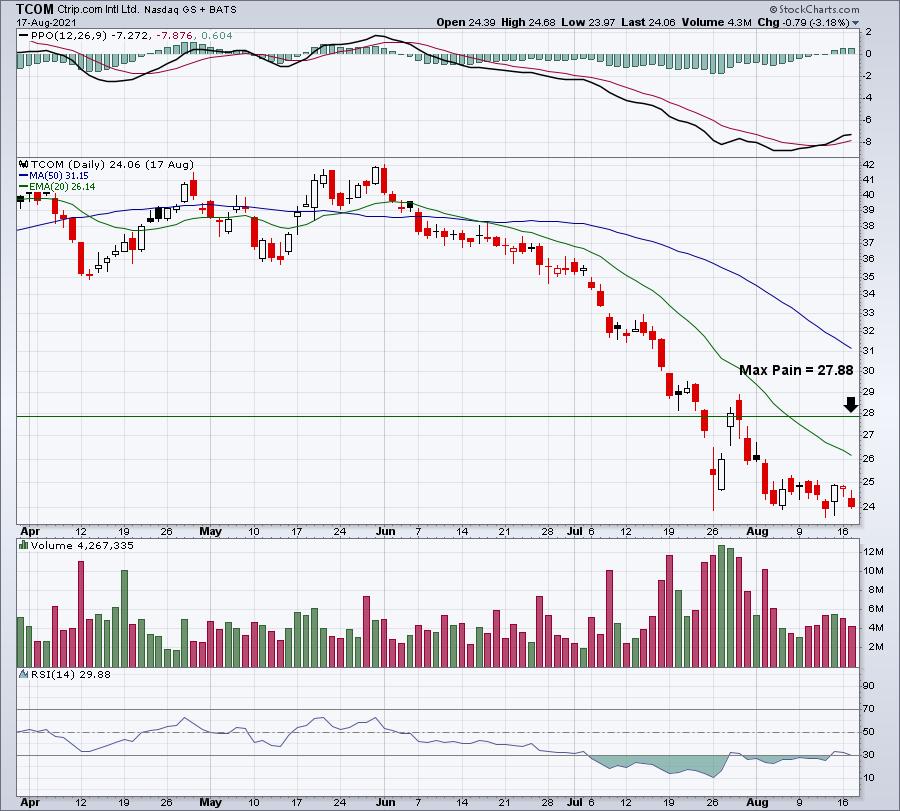
By Friday's close, TCOM had surged back to an intraday high of 27.07. There was plenty of net in-the-money put premium on Tuesday. By Friday? Vanished. POOF! And look at where TCOM finished just one week after our webinar:
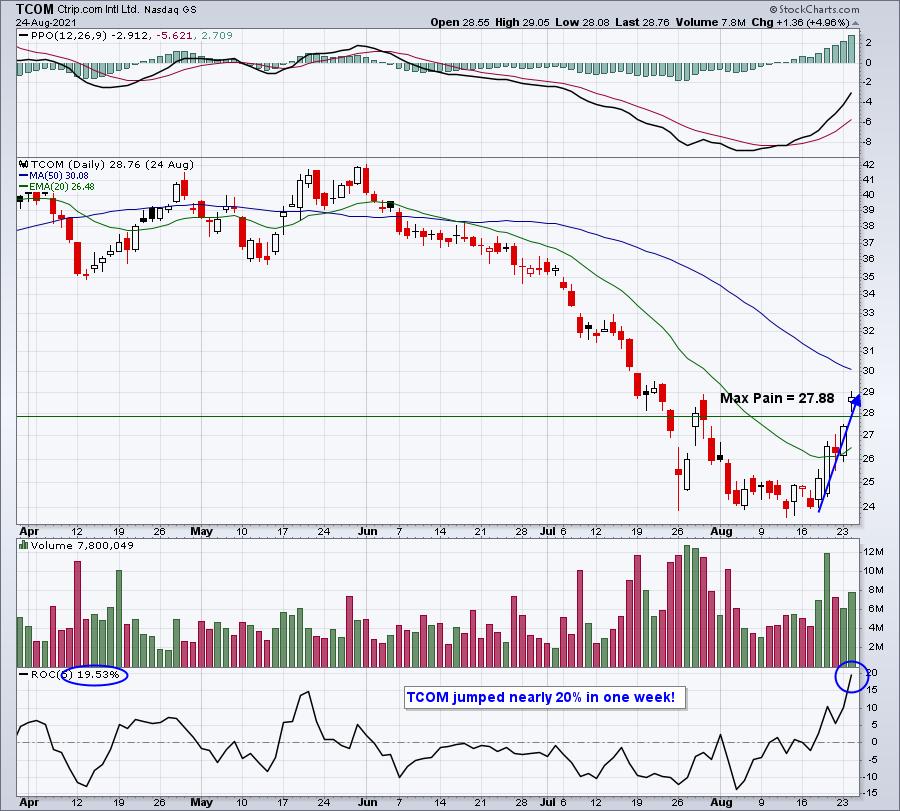
Coincidence or market maker magic? You be the judge.
LVS:
TCOM only had $3 million of net in-the-money put premium on the table. LVS was at another level, with nearly $40 million of net in-the-money put premium. Let me "cut to the chase" here as the chart below also shows what happened over the week following our webinar:
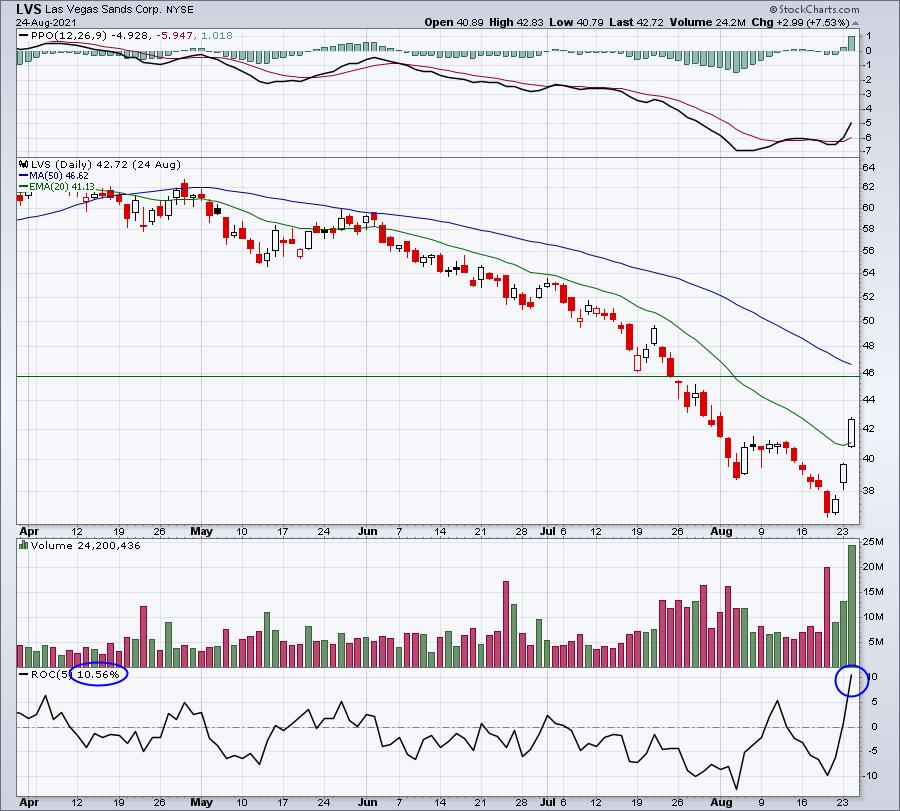
We didn't reach max pain, but LVS made a directional move to the upside, which is what I look for. Even just a 50 cent move to the upside saves premium dollars. In the case of LVS, we saw a 10.5% jump from the Tuesday before options expiration Friday to the Tuesday after.
These are the types of trades we look for during options expiration week. Believe me, they do not all work like the two I just showed you. I don't want you to get the wrong impression. But max pain provides us knowledge that many other traders don't have and it gives us a trading advantage, in my opinion. I will be spending the balance of today researching hundreds of stocks, trying to uncover the best "September Max Pain" candidates, both on the long and short side, to try to take advantage of market maker manipulation. I'll unveil those max pain trading candidates, along with max pain levels on both the SPY and QQQ, in our monthly webinar.
The Event
Today at 4:30pm ET, I'll be hosting our "September Max Pain" event. I'd love for you to join us. If you're not already an EarningsBeats.com member, we do offer a FREE 30-day trial, which will allow you to join me. CLICK HERE (and then click the green "JOIN TODAY" button) to get your FREE 30-day trial started. I hope to see you this afternoon for what should be another great event!
Happy trading!
Tom


