I guess the first question I'd ask is, "Are we talking about the short-term or the long-term?" Because I'd say there's very little chance that we've just reached a long-term top. But could this be a short-term top? Absolutely. Let me explain two reasons why a quick selloff is a definite possibility.
Critical Price Resistance Tested
Both the Dow Jones and S&P 500 tested all-time high closes yesterday, before falling just shy at the close. Failed breakouts can result in short-term selling. Here are the two charts:
Dow Jones:
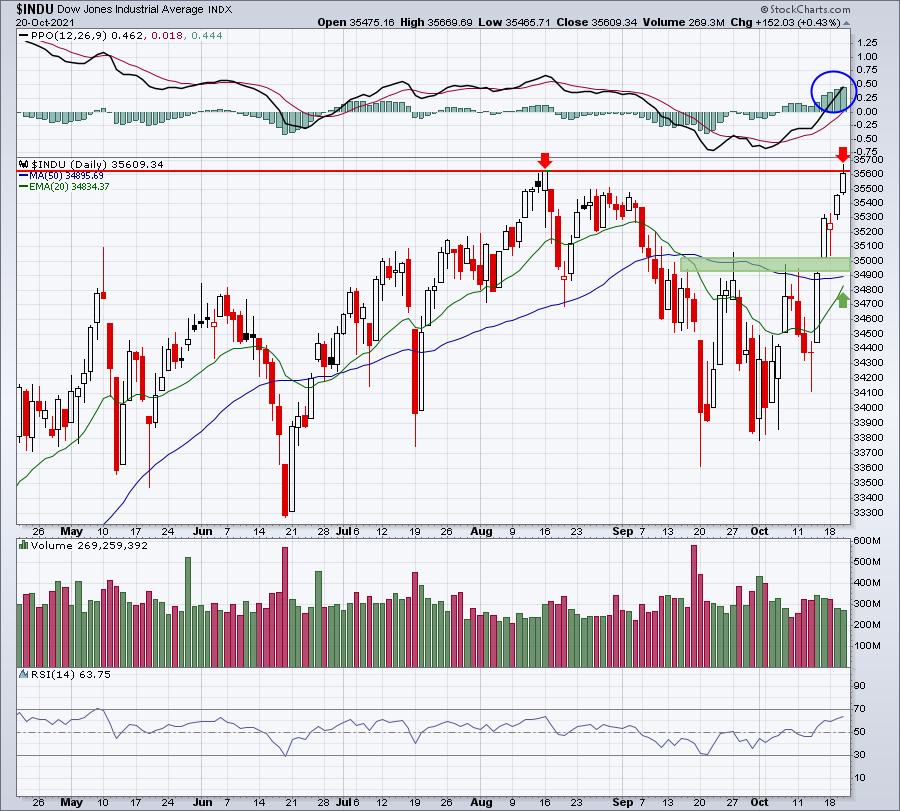
I love the look of this chart, but yesterday the Dow Jones hit a record intraday high at 36,669.69, besting its August 16th intraday high. The problem is that it didn't hold that high into the close, finishing just beneath August 16th's close. That has the look of a short-term top. The good news for bulls is that the PPO is showing accelerating bullish momentum, so any test of the rising 20-day EMA is likely to hold. But we could we see a quick 1-2% drop? Sure.
S&P 500:
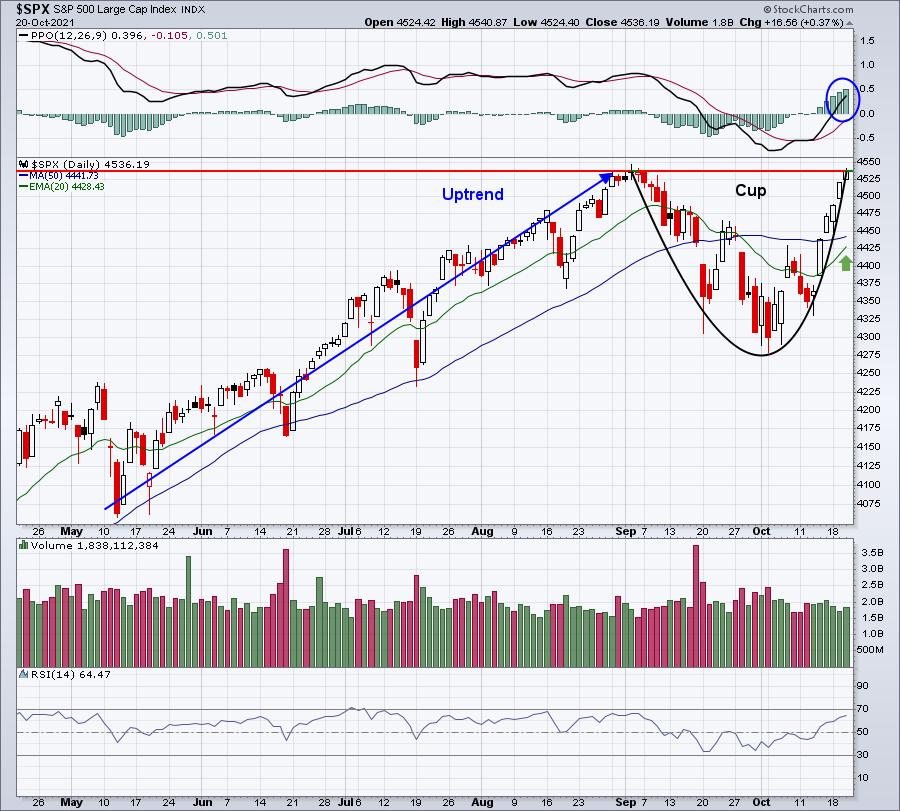
Does that not look like a perfect cup to you? It comes after a prior uptrend, so I'd be treating this as a very bullish cup with handle continuation pattern. But we're missing one thing. The handle. So could I see the S&P 500 pulling back to test the rising 20-day EMA to print a handle? Most definitely.
I'm not saying that a pullback is guaranteed. I believe most of you know how bullish I have been for YEARS. I've said to ignore the media headlines and stay invested in this secular bull market. But pullbacks do occur and this would be a technical opportunity for a shallow one.
History Is Flashing A Caution Light
I have a spreadsheet that has every trading day on the S&P 500 and NASDAQ since 1950 and 1971, respectively. I love to analyze and I can assure you I've analyzed the heck out of these numbers. One historical fact is that, at the close today, we will be entering the worst historical week of the year. The October 21st close through the October 27th close has a tendency to show weakness. Before I show you the numbers, keep in mind that the 19th through 25th of EVERY calendar month has produced annualized returns of -8% on the S&P 500 since 1950. So this October weakness is really nothing new. It just happens to be the worst of the bunch. Below are the annualized returns by calendar day on the S&P 500, followed by the NASDAQ:
S&P 500:
- October 22: -91.85%
- October 23: -5.14%
- October 24: -39.18%
- October 25: -48.74%
- October 26: -55.45%
- October 27: -19.51%
NASDAQ:
- October 22: -55.71%
- October 23: -48.75%
- October 24: -72.45%
- October 25: -48.57%
- October 26: -86.88%
- October 27: -75.47%
But here's the good news. Once we get past this October 22-27 period, the market skies turn a very bright blue (or maybe green in stock market terms). Check out the historical returns for October 28th through November 5th on the S&P 500 since 1950:
- October 28: +114.31%
- October 29: +78.05%
- October 30: +55.50%
- October 31: +19.81%
- November 1: +45.47%
- November 2: +86.10%
- November 3: +101.54%
- November 4: +45.52%
- November 5: +72.52%
It's like the water faucet is turned from ice cold to scorching hot at the October 27th close. So, if we do pullback in the short-term, don't lose sight of what's on the horizon historically.
If you like stats, I have a doozy for you on Friday morning in our EB Digest newsletter. You won't believe the winning streak that this area of the market has during the month of November. It's been like printing money since this bull market began. Our EB Digest newsletter is FREE (no credit card required) and you may unsubscribe at any time. Register with your name and email address HERE. Then enjoy this amazing stat in tomorrow's edition!
Happy trading!
Tom


