Have you ever heard a meteorologist describe the odds of a tornado touching down? They usually start by outlining the "conditions necessary" for a tornado. Early in the day, or possibly even the prior day, the meteorologist will say something like "this area has a 30% chance of a tornado, while this other area has a 40% chance or a tornado". It's based on the various conditions expected.
Well, I'd describe short squeezes in much the same way. Most stocks have very small short interest, so there is literally a 0% chance of a short squeeze. The condition (high short interest) isn't present. Other stocks that have high short interest and are trending lower have no panicked short sellers. They're all making money because the stock is trending lower.
Then there's a third group and this is where the stock market "weather" can grow violent from time to time. This group has high short interest AND it's beginning to show bullish momentum. I define "bullish momentum" in the case of short squeezes as simply PPOs rising above their zero, or center, line. You CANNOT have a short squeeze if stock is trending lower. That should make common sense. Why would shorts panic and BUY if they're making money? It's the thought of unlimited risk/loss that will force shorts to buy those shares back. It's like a fire starting in a huge forest in dry conditions. The fire is going to spread. But add wind and the fire EXPLODES! A PPO that rises into positive territory is a spark in the forest, but heavy volume and a rapidly-rising PPO is the wind.
My point of all this is that the rising PPO and the PPO moving into positive territory is a precursor to a potential short squeeze. We maintain a Short Squeeze ChartList (SSCL) at EarningsBeats.com that we maintain for our members. It's a part of our research platform. Currently, there are 45 stocks on this ChartList that sport a short percentage of float above 20%. And the number of stocks on this list with PPOs above zero are the highest since December 2020. If you recall, the whole GameStop (GME) craze began in January and GME had the largest short interest I've ever seen. Shorts were caught in the worst short squeeze tornado of my lifetime.
In December 2020, of the 67 stocks on our Short Squeeze ChartList at that time, 38 had positive PPOs. Because of the huge January rise in many heavily-shorted stocks, the PPOs at the end of January were positive as well. Since then, however, most SSCL stocks have seen their PPOs remain below zero. For instance, our Short Squeeze ChartList at the end of each of the previous 4 months had the following number of stocks with PPOs above their zero lines:
- July 2021: 8 of 30
- August 2021: 11 of 35
- September 2021: 10 of 42
When I checked yesterday, 25 of the 45 Short Squeeze ChartList stocks have PPOs in positive territory and more are likely on their way. Here's one stock that's already well into a potential squeeze, though it's lower today:
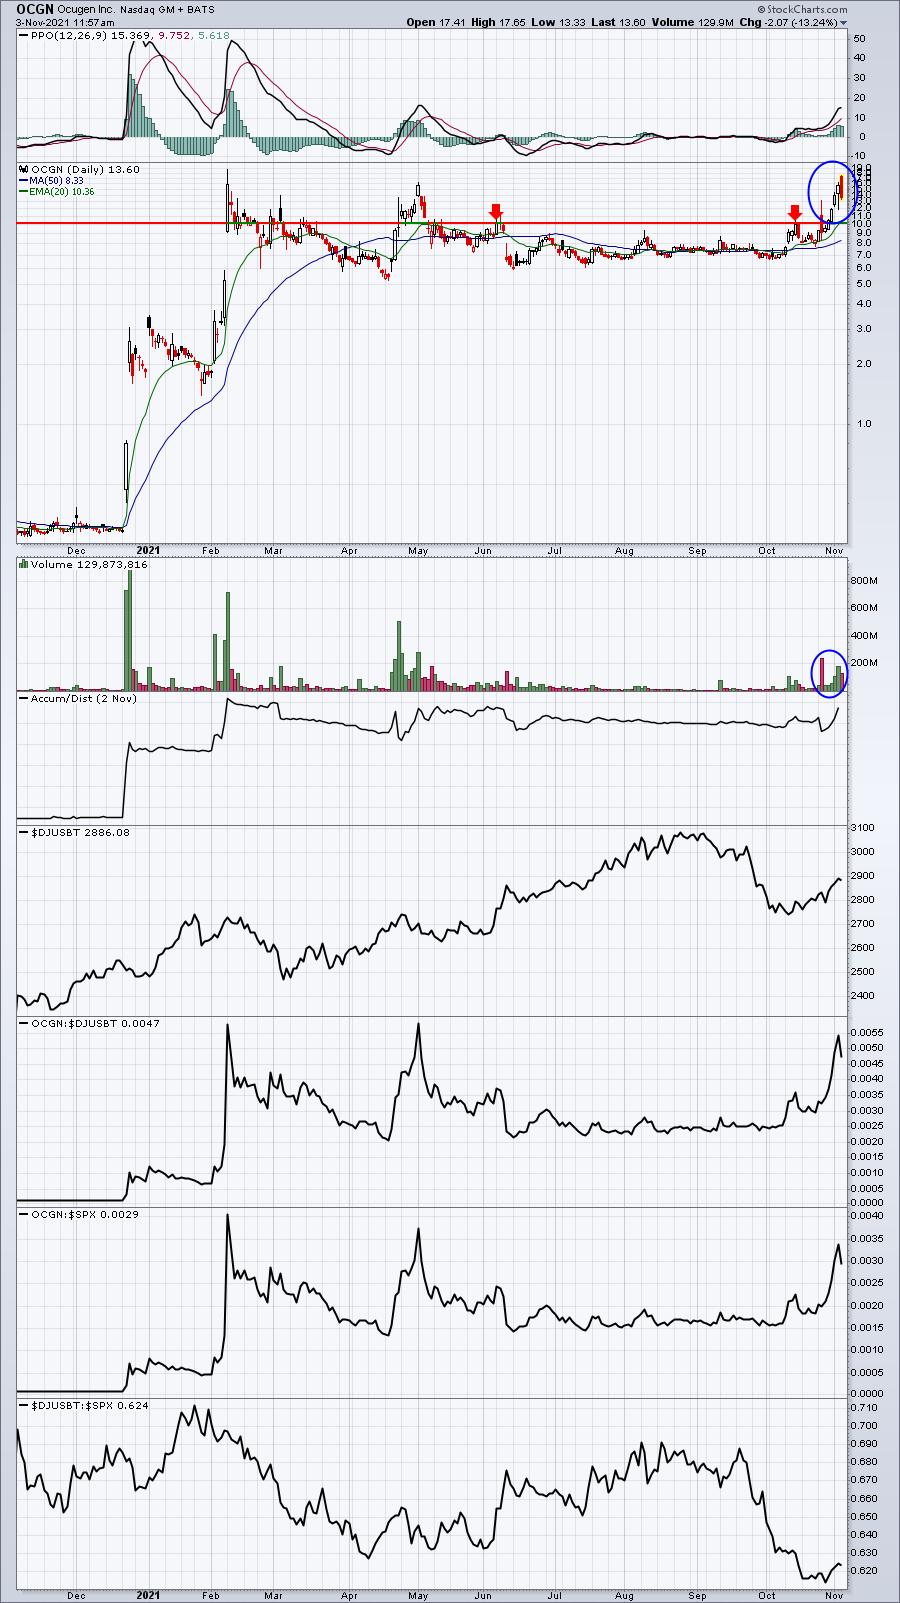
Maybe today is a topping candle? Maybe not. There is so much volatility associated with this stock right now. It's truly like being on a casino floor, which will not be appealing for many of you whose primary objective is to protect capital. For those looking to hit one "out of the park", well, a stock like OCGN can do that, especially if the shorts begin running for cover. A strong afternoon of action in the stock could trigger such a response. We'll see.
Here's a second stock that looks like a potential short squeeze could be right around the corner:
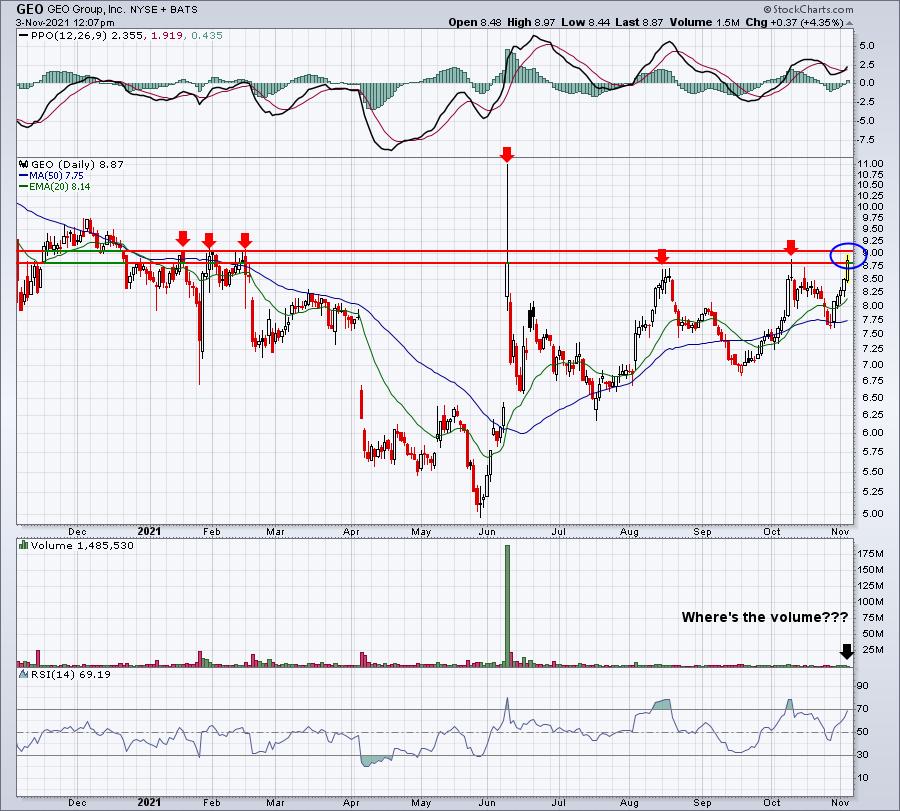
If GEO can close above 9.10, nearly every short seller will have shorted at lower prices, meaning that they'll be losing money. That's when the pressure to cover can begin to increase. GEO has 22% of its float short, so we'll be able to tell if shorts run for cover based on a substantial increase of volume to accompany the buying. On the chart above, it doesn't look like volume is increasing at all, but the massive volume in June skews volume on other days. So I shortened the chart to only focus on the last 4 months:
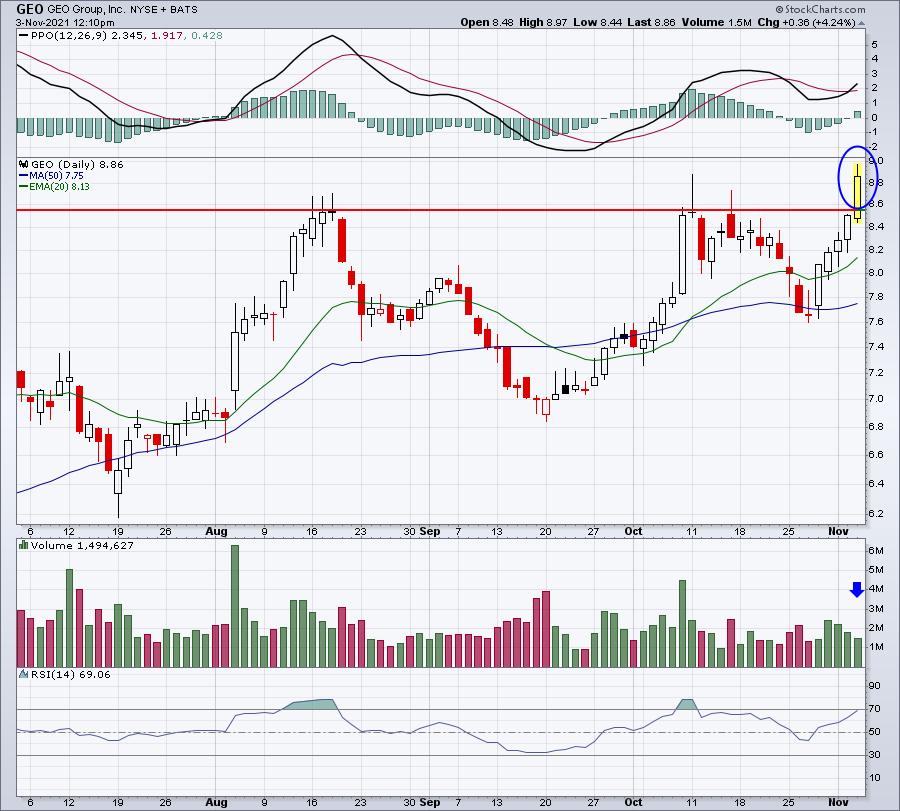
This looks a little different. We're just shy of the halfway point of the day and volume is on pace for perhaps 3 million shares or more today, which would be one of the heavier volume days of the past 4 months. But it's still not short-squeeze-type volume. But we haven't broken out either. This afternoon's action could be interesting if the price rise continues. Again, we'll see.
Our Short Squeeze ChartList (SSCL) is a ChartList that is only important a few times a year. "Conditions have worsened" for those on the short side and a tsunami of short covering could begin at any time. For a few stocks like OCGN, it may have already begun. The SSCL is just one of many ChartLists that our members can view or download. If you're already a StockCharts.com Extra or Pro member, you can download our ChartLists directly into your StockCharts.com account. To start your 30-day FREE trial at EarningsBeats.com, simply CLICK HERE and review everything we have to offer!
I'll also be hosting our FREE "Sneak Preview: Earnings Reactions Portfolio" event later today at 4:30pm ET. This portfolio just began on August 10, 2021. It's a new portfolio that's provided excellent results-to-date. I'll be providing next quarter's list of 10 equal-weighted stocks in this portfolio next Wednesday. Tonight, however, I simply plan to discuss how I select these stocks and illustrate their performance. It should be another fun, educational event. It's a FREE event and you can attend by clicking on the following room link AFTER 4:00PM ET TODAY:
https://earningsbeats.zoom.us/j/81251812641
We require those who attend our free events to be free EB Digest newsletter subscribers, so we'll add you to our list after the webinar, if you decide to join. The EB Digest does not require a credit card and you may unsubscribe at any time.
Hope to see you later today!
Tom


