If you're not already familiar with relative strength, then I have to ask why not? Yes, absolute price action is extremely important, but so is relative strength. I'm going to give you a perfect example of why you need to be aware of relative strength. Texas Instruments (TXN) is one of the better-known semiconductor companies. It's got a market cap of $176 billion and it's been trading for nearly three decades. Clearly, it's a solid company. Since the S&P 500 cleared its double top from 2000 and 2007 in 2013, TXN has gained a lot of ground. In the past 8 years, it's risen by 454%. A doubling over 8 years is considered a nice return, so gaining 454% over that period would certainly appear to be outstanding. But before you jump to that conclusion, check out this chart:
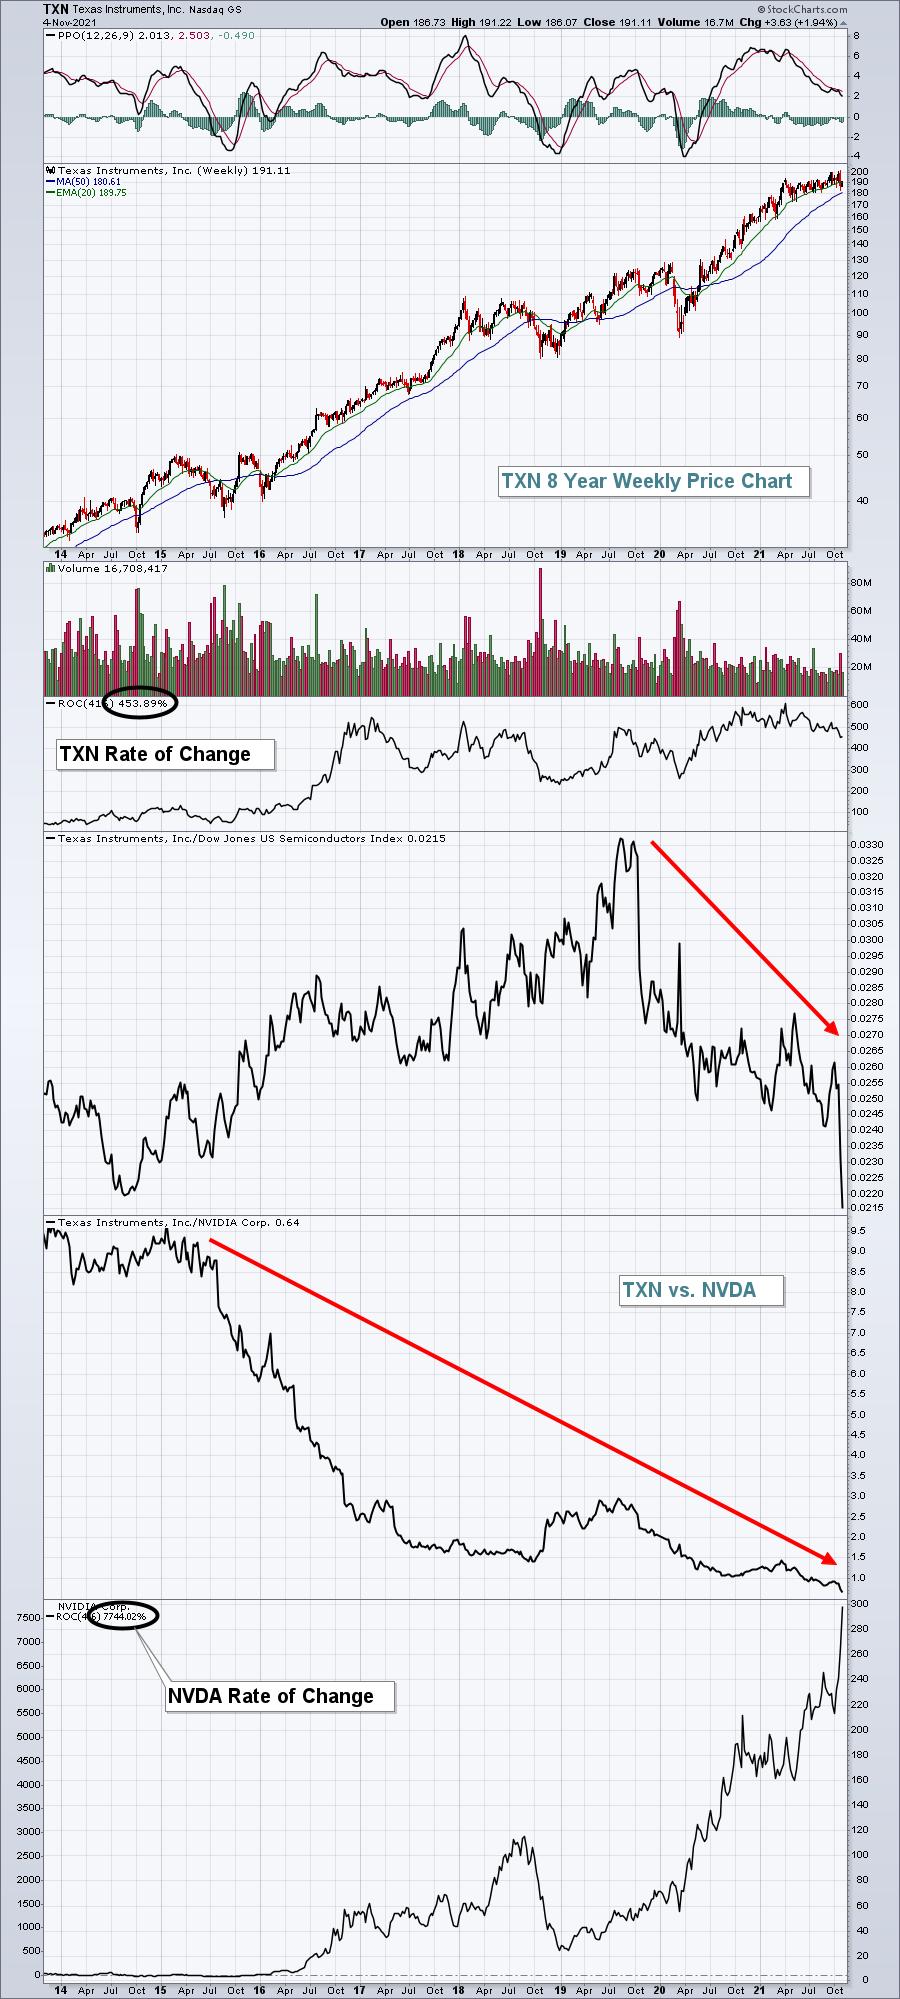
The TXN rate of change is reflected just below the volume. Next to the rate of change (ROC), you'll see the number 416. That represents the number of weeks over the past 8 years (8 x 52). You'll then see TXN's relative strength vs. its semiconductor peers, which has been ABYSMAL for the past two years. Below that is a relative performance chart pitting TXN against NVDA. TXN has been underperforming NVDA by a very large margin for a very long time. To put into numbers the opportunity cost of owning TXN instead of NVDA, I provided the 8 year ROC for NVDA in the bottom panel. Yes, that number is correct. NVDA has gained 7744% over the same 8 years as TXN.
Without the use of relative strength, that TXN chart looks pretty darn good. It's been rising consistently for 8 years. BUT, it's underperformed its peers as a whole and if you compare TXN to NVDA, the difference is remarkable. In fact, I went back to the exact date of the S&P 500 breakout on April 10, 2013, and calculated what $1,000 invested in each company would be worth today. This is mind blowing:
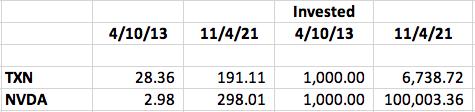
The TXN return is very solid, but hopefully you can see what happens to your portfolio if you own NVDA instead of TXN. That's where relative strength comes into play and it's one of our staples at EarningsBeats.com. We've crushed the S&P 500 since the inception of our portfolios (our Income Portfolio has slightly underperformed that benchmark). Here's where we stand as of Thursday's close, in terms of portfolio performance:
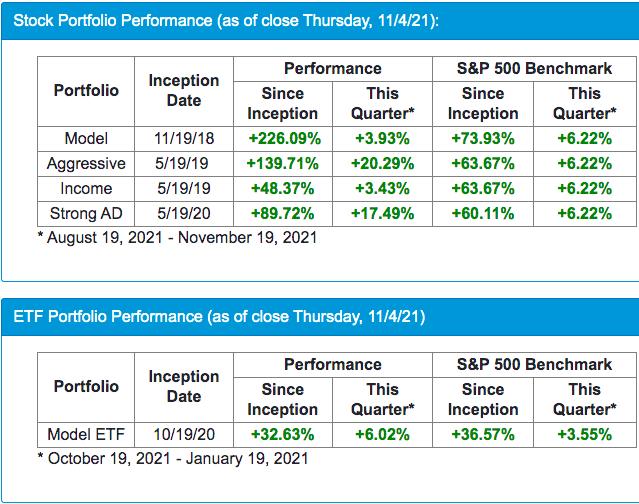
Look at those "Since Inception" returns. That type of outperformance over time makes a big difference in terms of achieving financial freedom. We've reached these levels because of our approach - selecting leading stocks in leading industry groups.
Let me give you another example of how relative strength can be useful.
StockCharts.com uses their StockCharts Technical Rank system (SCTR) to show relative strength among stocks and ETFs in different asset classes. It's a great way to quickly assess relative strength. If you're not familiar with it, you can check out the article HERE in ChartSchool. I've said many times that relative strength provides us necessary clues as to what Wall Street is buying. If they're buying, it's likely because of very good reasons. Therefore, I'll probably want to buy too. Through my years of research, I've found that stocks showing relative strength tend to produce better quarterly earnings results. We produce an Upcoming Earnings ChartList for every trading day. Thursday's Upcoming ChartList, for instance, was comprised of all companies with market caps > $1 billion that reported their quarterly results either Wednesday after the closing bell or Thursday before the opening bell. That way, this ChartList includes companies that will be opening on Thursday with new fundamental information that must be digested in the form of price reactions.
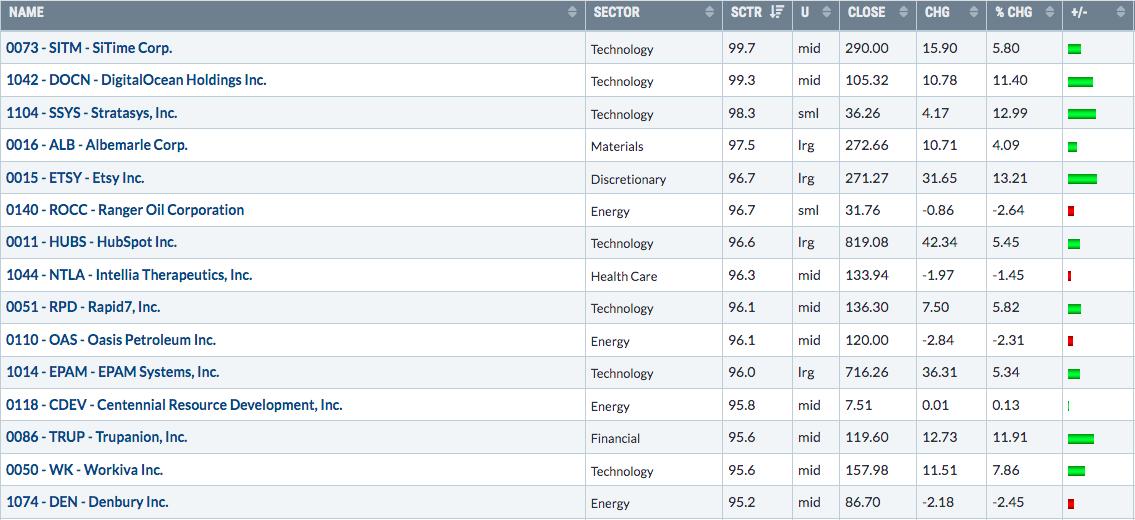
What I found very interesting about Thursday's ChartList was how the top-rated SCTR stocks performed after earnings vs. the lowest-rated SCTR stocks. Here are the top 15 SCTR score companies and the bottom 15 SCTR score companies. Take a look at this and you decide if there's any correlation between relative strength and initial market reactions after earnings:
Top 15 SCTR scores that reacted to earnings on Thursday:
Bottom 15 SCTR scores that reacted to earnings on Thursday (plus 4 companies that had no SCTR):
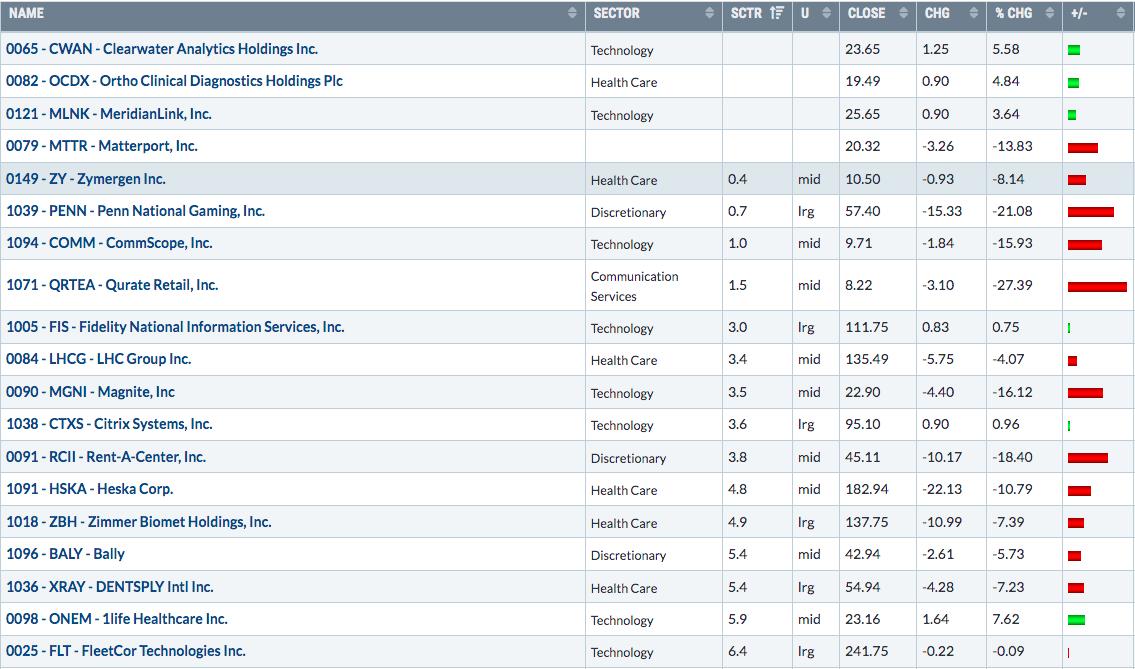
It certainly appears to me that leading stocks mostly get rewarded after earnings, while lagging stocks tend to suffer.
We provide these daily Upcoming Earnings ChartLists to everyone that's a subscriber to our FREE EB Digest newsletter. It costs absolutely nothing, so why wouldn't you want this information. I'm giving it away! In fact, if you'd like to try today's Upcoming Earnings ChartList, which features those companies with market caps > $1 billion that reported results after the bell on Thursday or before the bell on Friday, simply CLICK HERE and enter the password "EARN8779". If you're an Extra or Pro member at StockCharts.com, you'll be able to download this ChartList directly into your account. It's a very cool feature that we use for our EarningsBeats.com members all the time. If you're not a StockCharts.com member, however, you'll be able to view each chart individually, but you won't be able to access the ChartList in Summary form like I illustrated above. It'll be worth taking out a 30-day FREE trial to StockCharts.com simply to check out this ChartList.....and then to experience the rest of the StockCharts.com platform, which I find is absolutely amazing. I use it every minute of every day - almost literally!
If you enjoy this ChartList, then please subscribe to our EB Digest newsletter. It's completely free, published 3x per week, and there's a link in every EB Digest article that takes you to our Upcoming Earnings ChartList like the one I provided you above. Learn more and more about relative strength and I promise you that you'll become a better investor/trader!
Happy trading!
Tom


