Technical analysis pays off. Thank you John Murphy for all the wisdom and inspiration. The warning signs that I see from time to time don't always pay off and that's really not what technical analysis is all about. It's never a guarantee. I use it to analyze and manage risk.
Yesterday, the S&P 500 lost neckline support in a very bearish head & shoulders topping pattern. I've annotated this pattern dozens of times now, but here's the first time where we can actually see the breakdown:
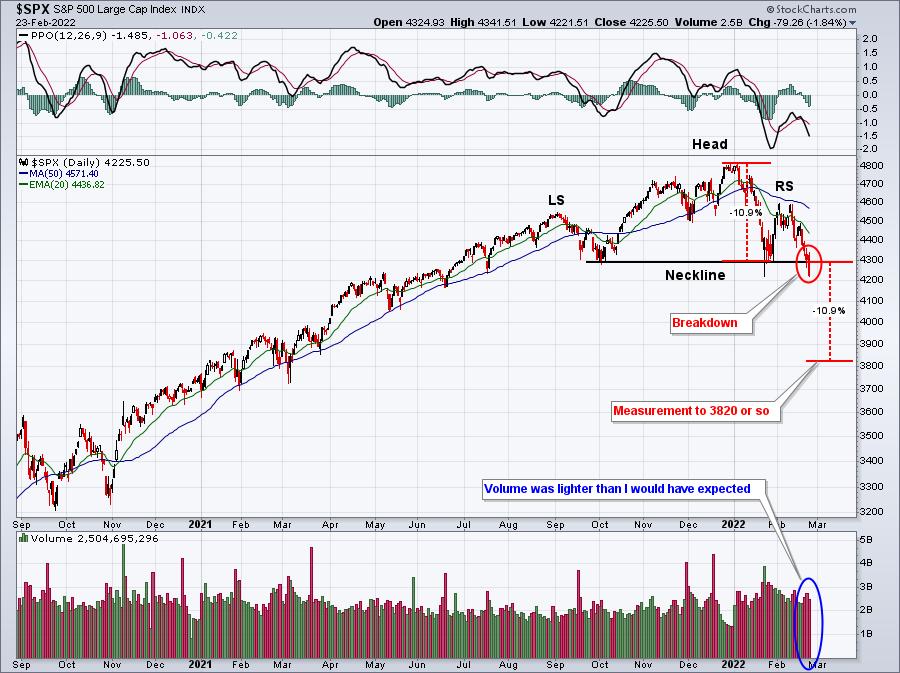
Head & shoulder patterns are overused in technical analysis. I see them in use in many instances where I don't feel they belong. There are a few keys, in my view, to a true head & shoulders pattern. First and foremost, they MUST follow an uptrend to be a topping pattern. That should seem obvious, but trust me, I've seen folks annotate a head & shoulders pattern on a chart where there isn't even an uptrend. The second key for me is that I don't like "uptrending" head & shoulders patterns. By that, I mean I don't want the neckline to be moving higher from left to right. If the neckline is moving higher from left to right, that means that we could see a breakdown in the future that doesn't even break beneath the left or right side of the neckline. How can that type of breakdown be taken seriously if the two key price support levels aren't even lost?
I will say there's one silver lining in the above chart. I typically look for VERY heavy volume to confirm a H&S topping pattern when the neckline is broken. We didn't see that yesterday. However, the volume today will likely be confirming if we remain weak throughout the day.
A better (more bearish) head & shoulders pattern is when the neckline is sloping lower. When that neckline breaks, you KNOW that price support has been lost. In our Monday EB Digest newsletter, I provided our community a bigger and more important head & shoulders pattern to watch. Here it is:
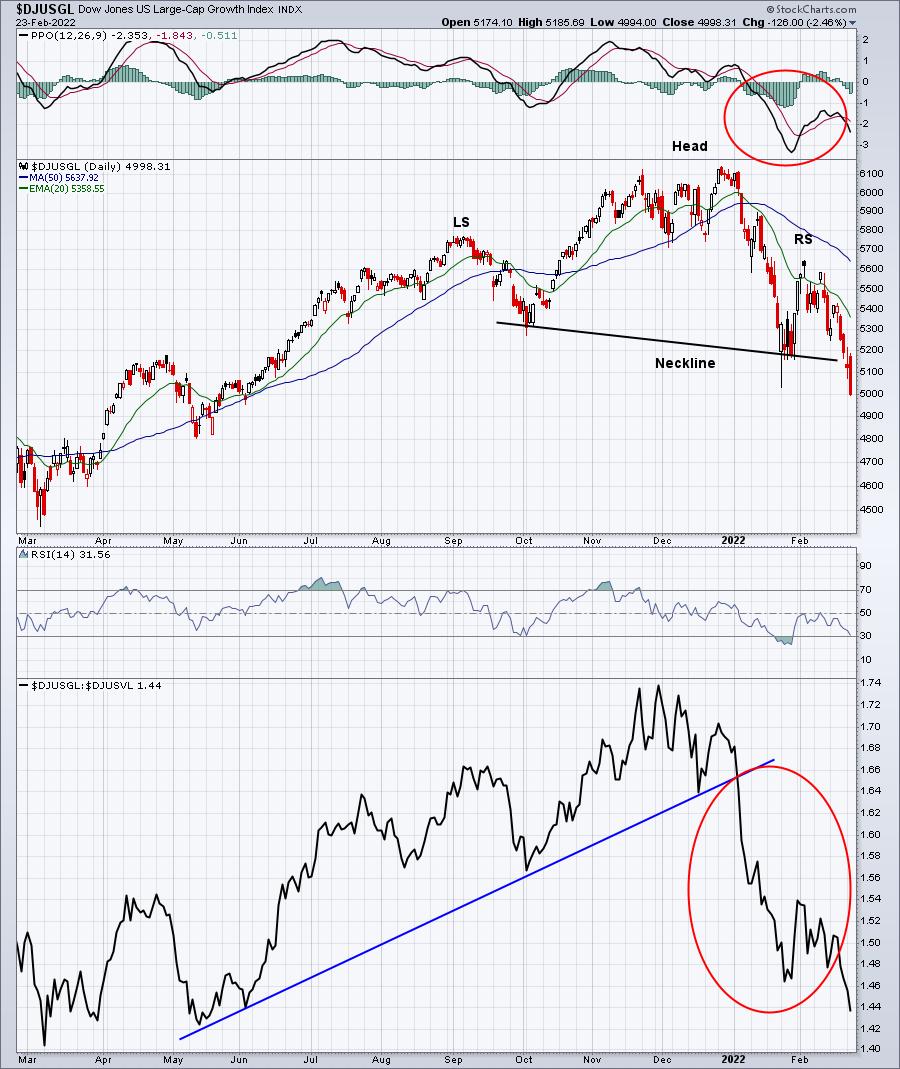
Large cap growth stocks was the last bullish piece of the S&P 500 puzzle. One of the reasons I turned very bearish was the relative breakdown (lower chart panel above) of this extremely influential part of the market. And check out that head & shoulders pattern. Do you see the difference? When that neckline broke this week, there was no price support to be found. The selling accelerated yesterday and, of course, futures this morning are cratering. The move lower now is being led by some of the most well-known and respected companies. Companies like Apple (AAPL), Microsoft (MSFT), Alphabet (GOOGL), Amazon.com (AMZN), Tesla (TSLA), Meta Platforms (FB), and so on - these are the companies that have most recently broken down and that's why the S&P 500 neckline support finally caved in.
We've got more weakness ahead. For those who think we're not in a bear market, let me remind you of how much our major indices have fallen since their respective highs:
- Dow Jones: -10.34%
- S&P 500: -12.31%
- NASDAQ: -19.58%
- S&P 400 (mid cap): -14.64%
- S&P 600 (small cap): -16.62%
Here are a few other key indices that I like to follow:
- Dow Jones U.S. Large-Cap Growth: -18.72%
- Dow Jones U.S. Mid-Cap Growth: -20.68%
- Dow Jones U.S. Small-Cap Growth: -24.13%
And here are our 3 key (aggressive) sector ETFs:
- Technology (XLK): -17.40%
- Consumer Discretionary (XLY): -21.49%
- Communication Services (XLC): -23.81%
These drops are before today's huge gap lower.
So are we in a bear market? Split hairs if you'd like, but I say yes we are and it's going to get worse. At EarningsBeats.com, we have three pillars in our business model:
- Market Guidance
- Market Research
- Market Education
Our members were very well-prepared for this 2022 bear market. If you'd like to join our growing membership, CLICK HERE to get your 30-day FREE trial started!
Happy trading!
Tom


