There's no denying it was a super rally to end last week. Any time you see stocks jumping like they did on Thursday's reversal and Friday's follow through, it's easy to become much more optimistic. But during periods of high volatility, the market makers will drag your emotions through the mud. Despair can turn into optimism in just a day or two. It's crazy how quickly we forget the bad stuff when the good stuff returns.
We need to try to objectively evaluate the good stuff, however.
Have you looked to see the "net effect" of last week's selling and recovery? It was more rotation into defense. Check out this sector leaderboard for last week:
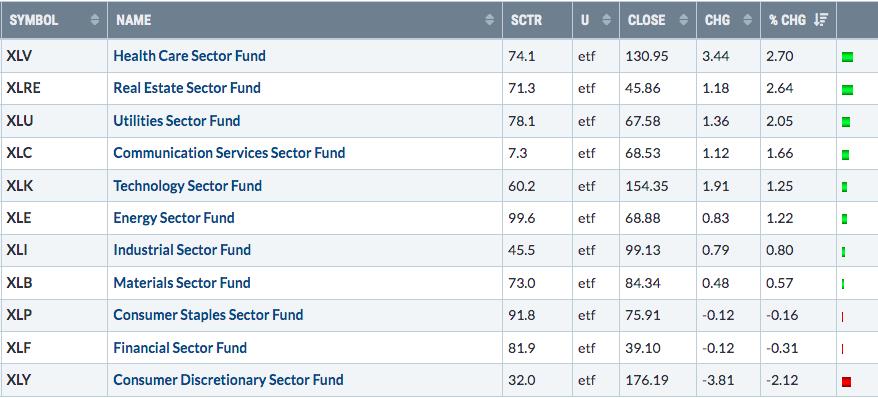
3 defensive groups led during this volatile period. Also, check out the worst performer - the aggressive consumer discretionary (XLY) sector. In the end, the crazy selloff and recovery resulted in more buying of defensive stocks. More bearish rotation. Does it make you feel bullish to know that Wall Street continues to rotate into defense? Yeah, me neither.
The good news is that we've seen a tremendous recovery off the panicked low from Thursday. Check this out:
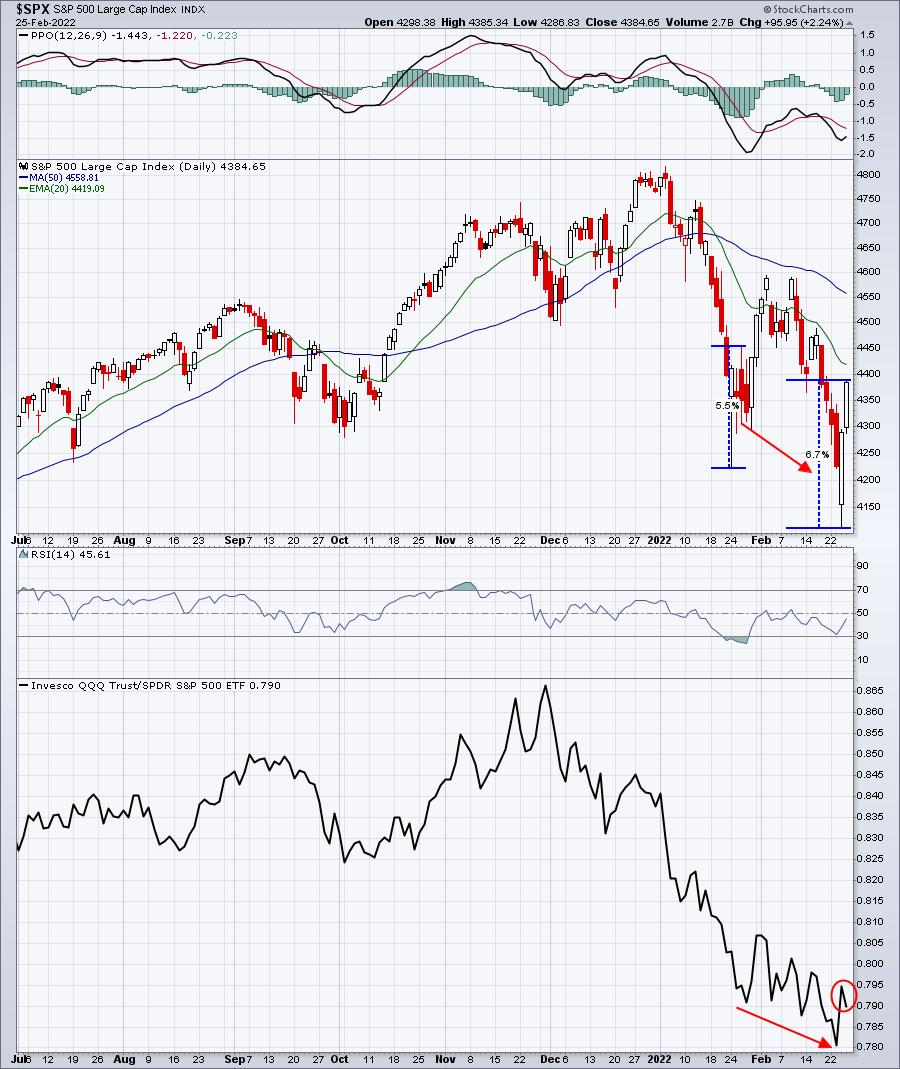
It's the second time in a month that we've seen a HUGE recovery after panicked selling. The first one didn't end so well as we quickly reversed to challenge neckline support at 4300 before a more sustained advance to nearly 4600 to print a right shoulder. The good news on this recovery is that we've closed at or near our intraday high both Thursday and Friday. Based on that, I don't think this rally is quite done. But beware a reversal and a weak afternoon finish.
I sent out a Special Report to our members on Friday morning that detailed the last 6 cyclical bear markets and how they unfolded. They ALL included bullish rallies like the ones we've seen this year. As an example, let's review the 1990 cyclical bear market and its panicked selloffs, followed by false rallies:
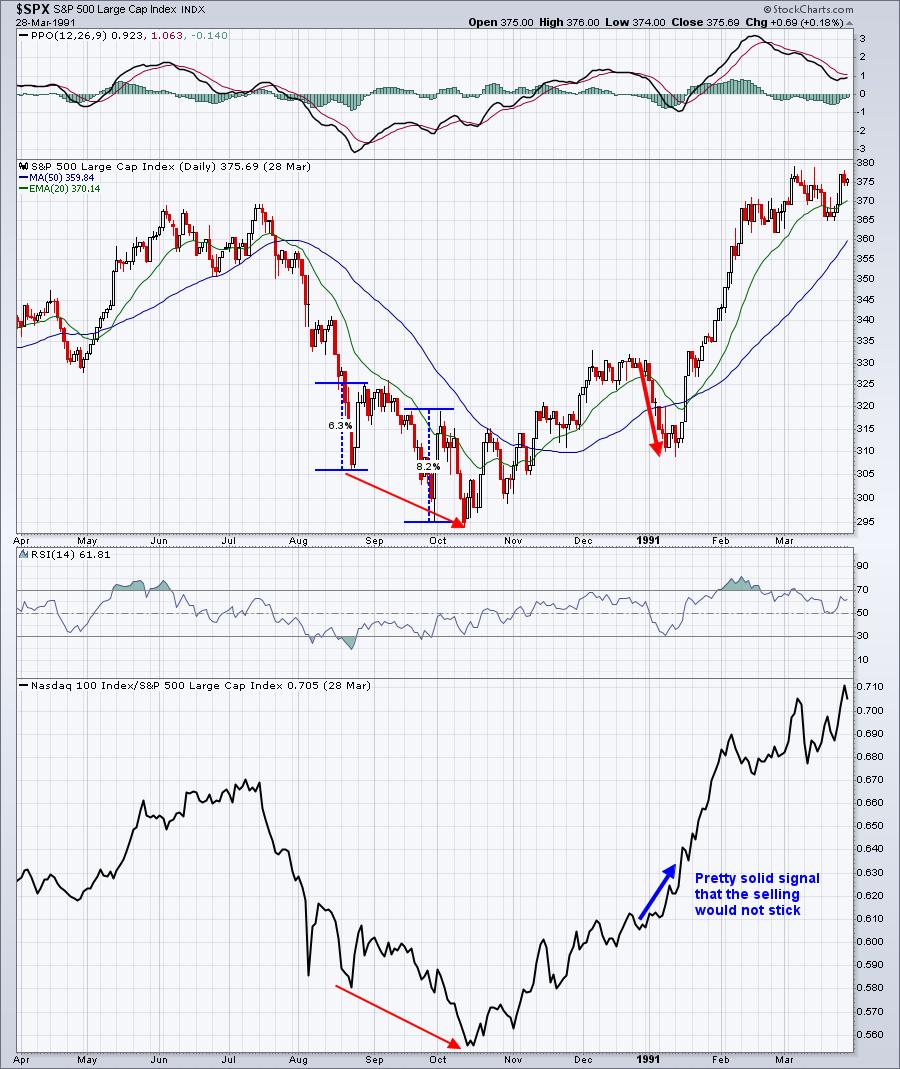
The bottom panel shows the S&P 500 continuing to decline as the more aggressive NASDAQ underperformed the more defensive S&P 500. It's difficult to say exactly how this current cyclical bear market comes to an end, but if each S&P 500 low is accompanied by a fresh new low in the NDX:SPX ratio, I'm going to question the sustainability of any rally.
If you go back up to the 2022 cyclical bear market chart that I provided earlier, check out that circle in the bottom panel. Yes, the rally continued right through Friday's close, but why did Wall Street begin to turn away from the more aggressive NDX? Is this a signal for more weakness ahead?
It's quite possible. Please be careful. Most cyclical bear markets last approximately 90 days. The S&P 500 topped in very early January, so a "potential" end date for this current cyclical bear market would be early April. That leaves us the next 4-6 weeks to navigate what's likely to be a severely volatile period.
If you like this kind of "beneath the surface" research and analysis instead of the "same ole, same ole" from CNBC, I'd suggest that you subscribe to my FREE newsletter, the EB Digest. There's no credit card required, you may unsubscribe at any time, and we'll always respect your privacy, NEVER providing your email address to third parties. CLICK HERE to sign up! Again, it's free!
Happy trading!
Tom


