I began studying stock market behavior back in the 1980s. It started as a result of my practicing CPA days. While auditing clients, I realized that most of my clients had consistent payroll dates that were generally the beginning and middle of the month. That's a lot of 401(k) contributions that would make their way into the Vanguards and Fidelitys of the world. When 401(k) contributions (and employer-matching contributions) arrive at those big investment firms, they do not try to time entry. They take our money and invest it IMMEDIATELY based upon our directives. Those consistent money flows had to have significant bullish consequences, didn't they?
Yes they did....and still do. I keep an Excel spreadsheet that has tracked every S&P 500 close since 1950 and every NASDAQ close since 1971. After many years of analyzing, I've come to several conclusions and I'm going to talk about them tomorrow night in an EarningsBeats.com members-only event. Here are just a couple of topics that will immediately improve the trading chances of success for every attendee:
All Calendar Days Are NOT Created Equal
One of the first things I realize when I analyze 7 decades of information is that there are two periods of EVERY calendar month that have produced strong annualized returns on the S&P 500 over a 72-year period. Those same calendar days (roughly) have produced very strong annualized returns on the NASDAQ over the past 50 years as well. The odds do not favor shorting during these period of the calendar month. You're swimming against the tide. As you might suspect, there are also two very bearish periods of the calendar month where U.S. equities have tended to trend lower. Knowing the difference between these periods is ESSENTIAL to developing a successful trading strategy.
Day of the Week
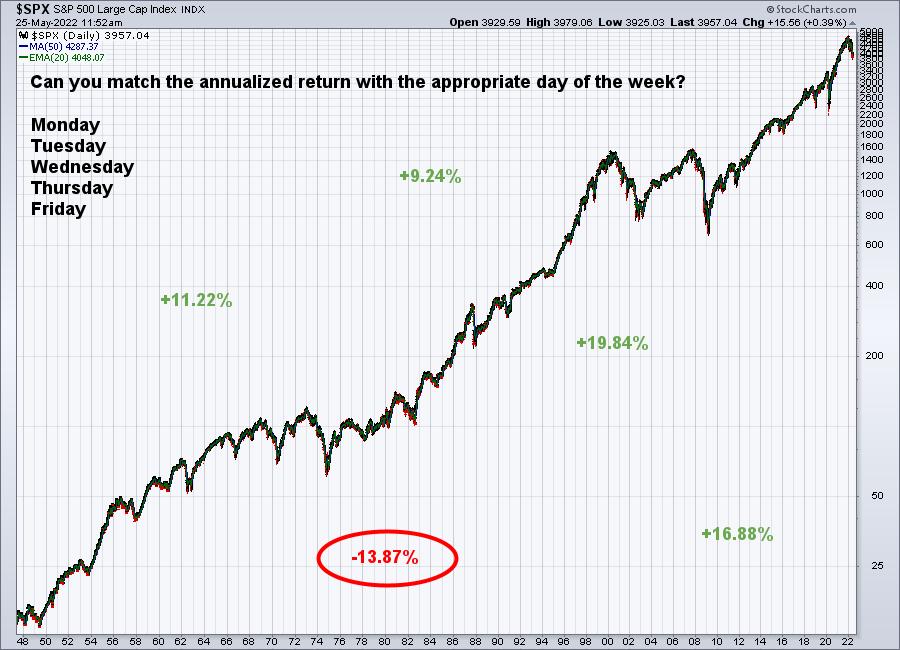
Do you think it makes any difference whether it's a Monday or a Thursday? A Friday or a Tuesday? If you think "NO", you better think again. Below are two long-term charts of the S&P 500 and NASDAQ with the annualized returns of the 5 days of the week scattered. Do you know which return belongs to which day?
S&P 500:
NASDAQ:
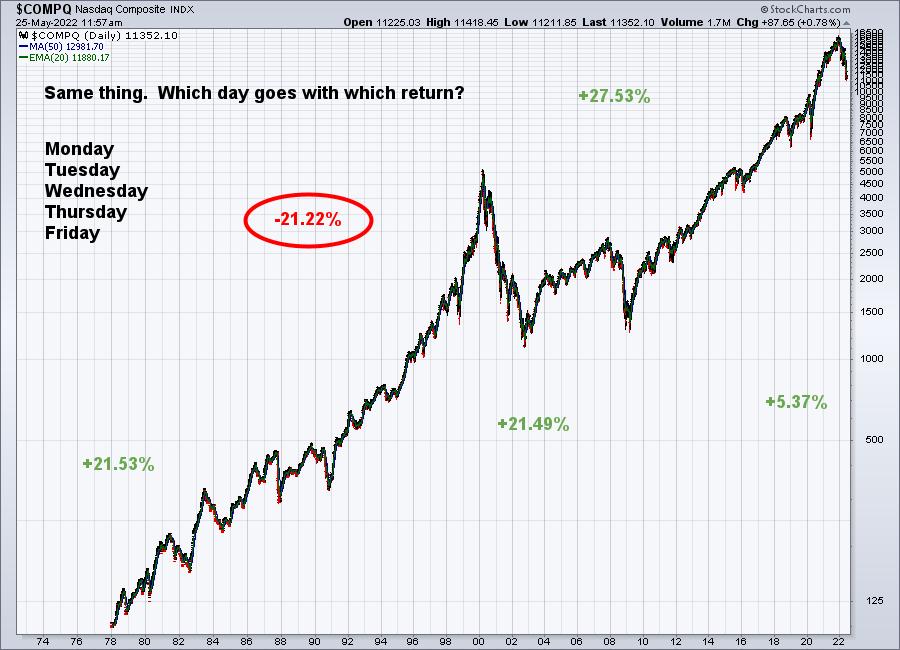
Look at those red-circled annualized returns. When I first stumbled across that, I was absolutely stunned. To put this in context, let me focus on the NASDAQ's -21.22%. There have been 2447 trading days that have fallen on this day of the week since 1971. Remember, I'm covering 50 years worth of data on the NASDAQ, so each day of the week equals roughly one decade of trading. Imagine a DECADE of market action where we fall an average of 21% every year. That's essentially what happens on this day of the week. You need to know this tendency.
You probably have never thought about it, but knowing the bullish days of the week that fall within the bullish calendar days of the month significantly improves your odds of trading successfully. It's definitely not the PRIMARY indicator for knowing when to trade, but it's a secondary indicator that you absolutely should be aware of.
Why do these trends and patterns occur and why have they been consistent over decades? I'll be discussing that and much, much more, including the key takeaways from the "Go Away in May" and the "January Effect" phenomena.
On Thursday, May 26th, at 4:30pm ET, I'll be discussing all of the above. It will be very enlightening to many of you, so I hope you can make it. It is an EarningsBeats.com members-only event. If you'd like more information and would like to become a 30-day FREE trial member in order to claim a seat, CLICK HERE.
We're also in the middle of our Spring Special, which I can guarantee will be our best deal of the year. Our Spring Special ends on Monday, so checking out our service with our 30-day FREE TRIAL now comes at a great time. I hope you take advantage of it!
Happy trading!
Tom


