Everyone is entitled to their own opinion and mine is that the issues we've experienced in the first half of 2022 will be mitigated in the second half. Until 2022, many of you I'm sure viewed me as a perma-bull. I've always said that isn't true, but that I won't talk bearishly about the U.S. stock market unless I have reason to do so. Since 1950, the S&P 500 has risen on an annual basis 54 years out of 72. You can be like the Peter Schiffs of the world and call for a market collapse every time you open your yap if you'd like, but I'll gladly decline and be right 75% of the time. And if I can call a few of those 18 annual declines, even better!
If you had asked a large audience what the biggest issue was heading into 2022, I'm sure you'd have heard a smattering of the usual suspects - our debt, the Fed, inflation, higher rates, housing bubble, stock market bubble, etc. Throw in the newest issues like the Russia-Ukraine war, soaring crude oil prices, and you'd most definitely have interesting choices.
But I believe the biggest issue of all had nothing to do with any of that. To me, most of that is noise. It's media banter. It's what everyone is talking about right now. I hate to see portfolios ravished over a 4-5 month period, but quite honestly, this is exactly what the U.S. equity market needed - a breather.
From the March 23, 2020 low to the January 3, 2022 high, there were 451 trading days. On the 75-year S&P 500 daily chart below, I've included a 451-day rate of change (ROC) so that you can see the March 23, 2020-January 3, 2022 rally, compared to the history of that 451-day ROC:
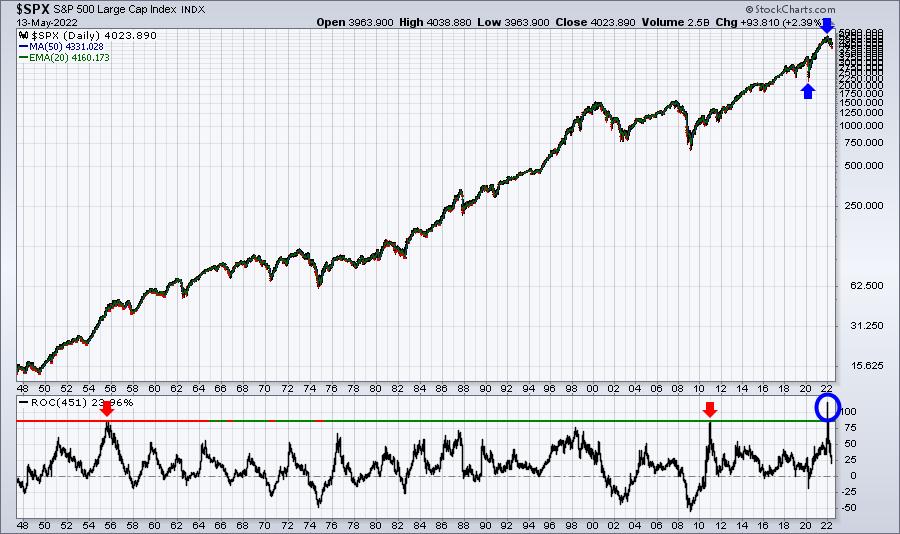
The blue arrows mark the March 2020 low and January 2022 high and the blue circle highlights the 451-day ROC above 100%. Note that the U.S. stock market has NEVER moved so quickly to the upside. NEVER!!!! We had simply run way too far. And the 2020 pandemic introduced a whole new set of investors and traders to the stock market. This group only knew one thing - higher prices. Think about the Reddit folks. They thought it only took a quick mention or tweet of a stock and it would triple in price. These were not disciplined investors and/or traders. These were pure speculators and this extreme bullishness showed in the equity only put call ratio ($CPCE).
On January 8, 2022, we hosted our MarketVision 2022 event. I talked extensively about the sentiment issues we faced heading into this year. For sentiment, I want to know what people are doing with their money. Some sentiment readings deal with "feelings" about the current market environment. I couldn't care less about that. Show me what people are doing with their money! Generally speaking, calls traded are bullish, while puts traded are bearish. That's why I like to follow the CPCE. There's no guesswork involved here. I'll share with you a couple charts that I shared back at MarketVision 2022. Here's the first and what the chart looked like at the time of the event:
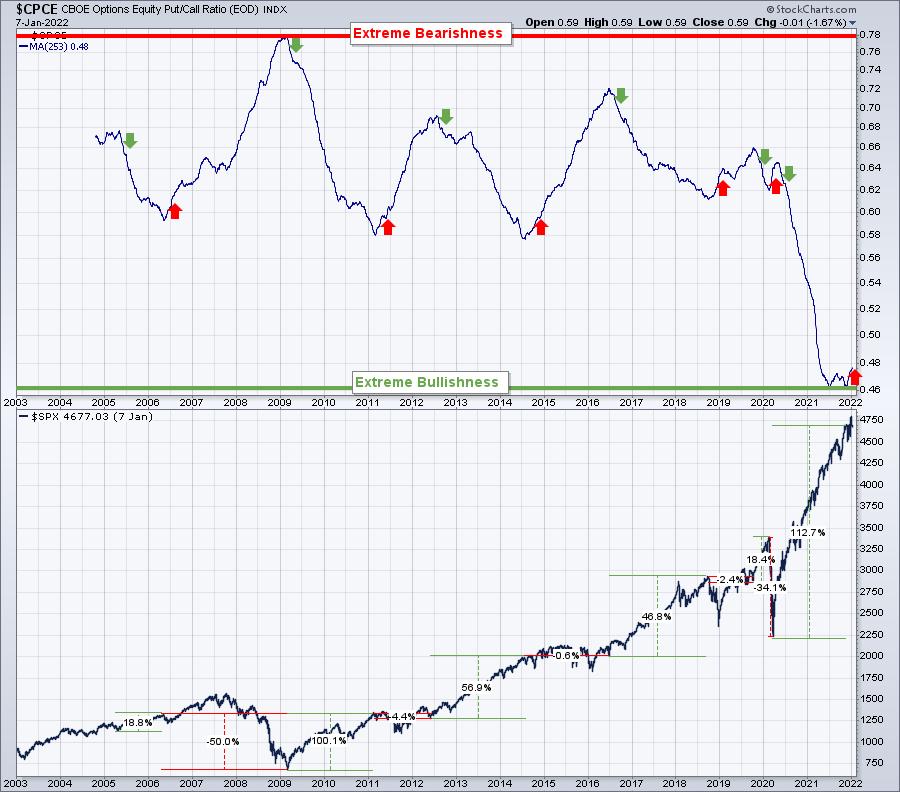
I highlighted the HUGE gains that were experienced off that March 2020 low and how the 253-day (1-year) average of the CPCE had fallen to a CRAZY bullish level - a level never seen before. The AVERAGE of the equity only put call ratio FOR A YEAR was at .48 and just beginning to rise. Let me illustrate how crazy this is. Below is a daily chart of the CPCE, so that you can see the equity only put call readings every day for the past 18 years:
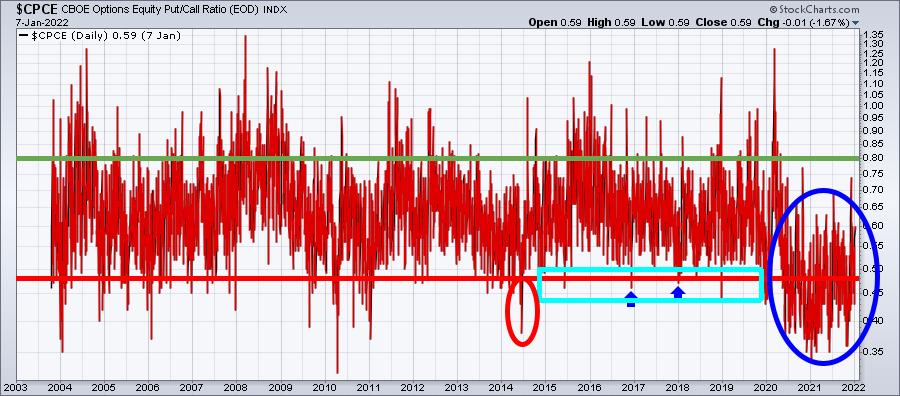
When the CPCE dropped in mid-2014 below 0.40, the S&P 500 struggled for the next year before finally topping in May 2015. Note that the CPCE barely dropped beneath 0.48 at the time of that top. ONE DAY'S .48 reading!!! Now look at that cluster of readings for the past two years at an unusually low level. Sentiment had NEVER reached this extreme bullish level before and probably never will again. We needed to "reset" sentiment before the stock market had a chance of further appreciation. So now scroll back up and look at that 253-day moving average of the CPCE that was just beginning to turn higher at the start of 2022. Want to know where it is today? Check this out:
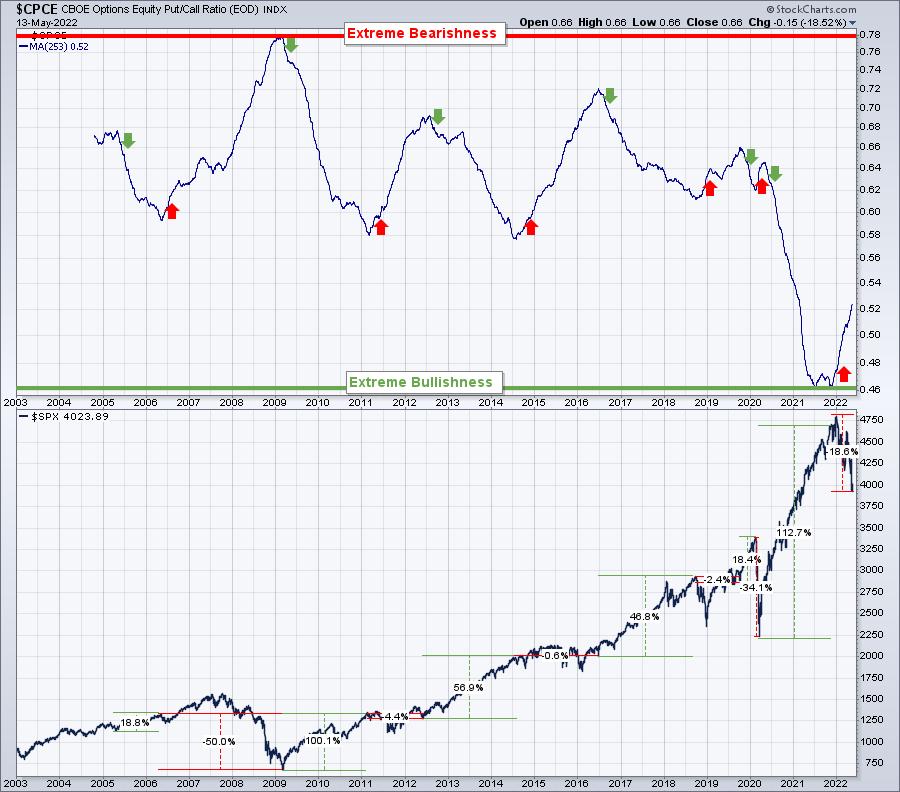
The U.S. stock market historically struggles as sentiment is resetting higher. And sentiment was our biggest challenge as we opened 2022, not inflation, not interest rates, not the war, not the Fed. Those were the reasons the media focused on to enable sentiment to reset.
I don't know that we've bottomed, but I do believe we're getting very close. I said in our MarketVision 2022 event that the key to being successful in 2022 was going to be our ability to exercise PATIENCE. That's what I've done. I've traded, but mostly remained in cash. My goal is to be ready with MORE buying power when we ultimately bottom. If you believe we're just getting started to the downside, I want to show you one more S&P 500 chart. On this chart, I'll show you another rate of change at the bottom. This time it'll be the 91-day ROC. Why 91 days? Well, that's the number of trading days it took for us to go from our January 3rd high to the Thursday, May 12th low close. How does this 91-day ROC compare to the rest of history?
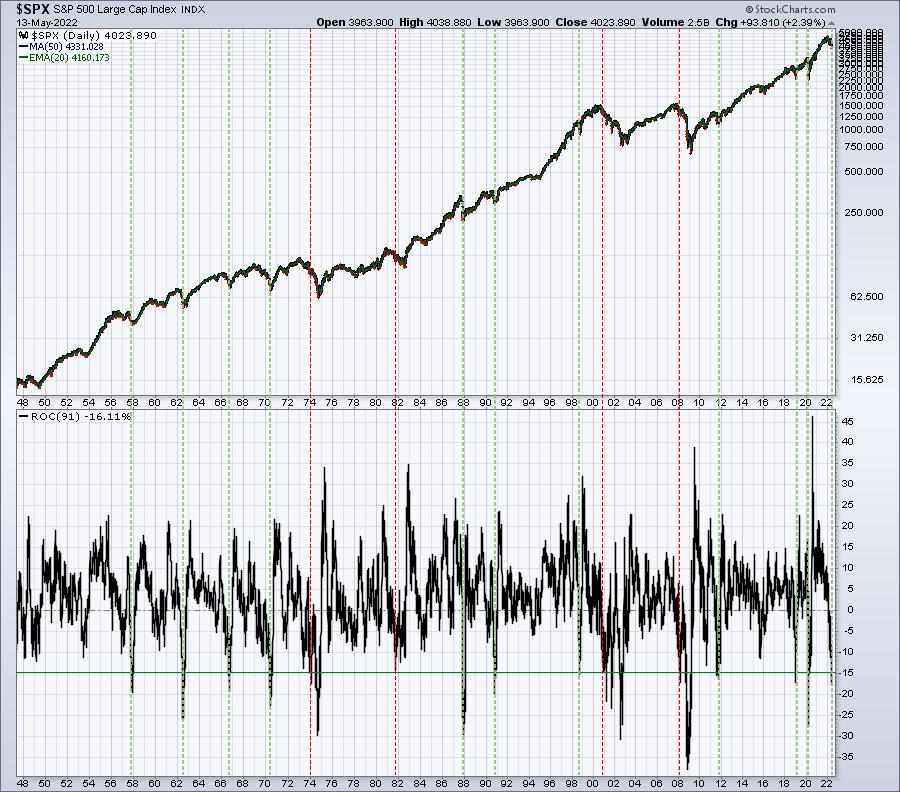
I've drawn a green horizontal line on the 91-day ROC panel to highlight times when this ROC has reached -15%. I count 15. Of these 15, 4 (red-dotted vertical lines) have resulted in further downside action. 3 of these 4 occurred during secular bear markets (1974, 2000, and 2008). 11 (green-dotted vertical lines) other times since 1950, we've seen this 91-day ROC hit -15% and they've all essentially marked major market bottoms.
I have said repeatedly that we are in a secular bull market. Feel free to disagree with me. But I've remained steadfast to that argument for the past several years and it's served me well. So I'll stick with it again.
I believe firmly that our biggest challenge heading into 2022 was sentiment. As I've discussed above, you can see that's one challenge that is beginning to take care of itself. I can't go anywhere now that a discussion doesn't break out about the myriad of problems we have now. And the media is going to be on all of them like a dog on a bone. The good news for us bulls is that market bottoms come a lot sooner than rosy media forecasts.
I hope you're ready to pounce on this generational opportunity. I know I am.
To stay abreast of TONS of market-related news and charts, CLICK HERE to join our growing EB Digest community of professional and individual investors/traders. It's completely free and requires no credit card to join.
Happy trading!
Tom


