Most of you are probably aware by now that I'm not a fan of CNBC, or any media for that matter. It's because their goals and objectives differ from mine. I want to educate. They want clicks, viewership, and ad revenue. Whatever it takes to achieve those goals is fair game for media outlets. No thank you, I'd rather golf.
If you don't believe that Wall Street manipulates the heck out of retail traders, then consider this. The NASDAQ 100 ($NDX) was 16,320 on December 31, 2021. It closed at 11,546 on Friday, October 28, 2022. That's a decline of 4,774 points, or 29.25%. Do you know that if you bought the QQQ (ETF that tracks the $NDX) at 2pm ET every day in 2022 and sold it at 4pm ET (close) that very same day, you'd be up 17.05% year-to-date? To me, this is one of the biggest reasons why I'm convinced this is a CYCLICAL bear market (short-term), not SECULAR (long-term). It's a solid indication of ACCUMULATION.
One of my sustainability ratios that I like to follow is the QQQ:SPY. The QQQ is more growth-oriented than the SPY, so a rising QQQ:SPY ratio would suggest that growth is more in favor and the opposite would be true when this ratio is declining. During a bear market, my expectation would be to see a declining QQQ:SPY ratio, signaling Wall Street's rotation from growth to value. When I called an S&P 500 bottom in mid-June 2022, one reason was the QQQ:SPY ratio relative to the direction of the S&P 500. Check out the divergence:
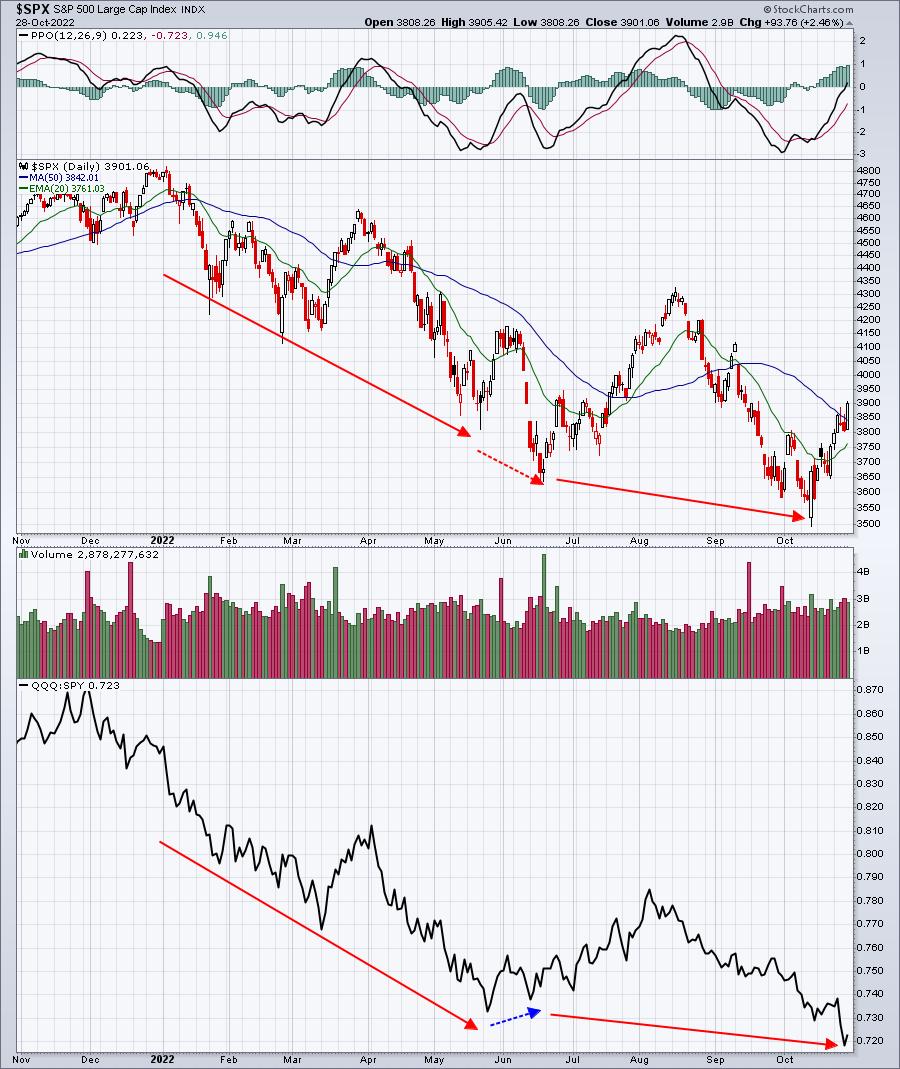
On the surface, it appears that money has rotated away from growth again - at least based on the QQQ:SPY ratio's new low. But I thought more about the intraday rotation, which is when institutions can actually buy and sell. I can assure you that institutional trades (potentially millions of shares) are not being placed at the opening bell as market orders.
So what does the INTRADAY rotation of QQQ:SPY look like? Well, I created a User-Defined Index (UDI) here at StockCharts and introduced it to our EarningsBeats.com members this past week. This IGNORES all opening gaps and shows the true rotation between QQQ and SPY throughout the trading day. The title of my UDI is "@SPYQQQ", but the actual calculation is based on QQQ:SPY. Here's what the intraday view looks like:
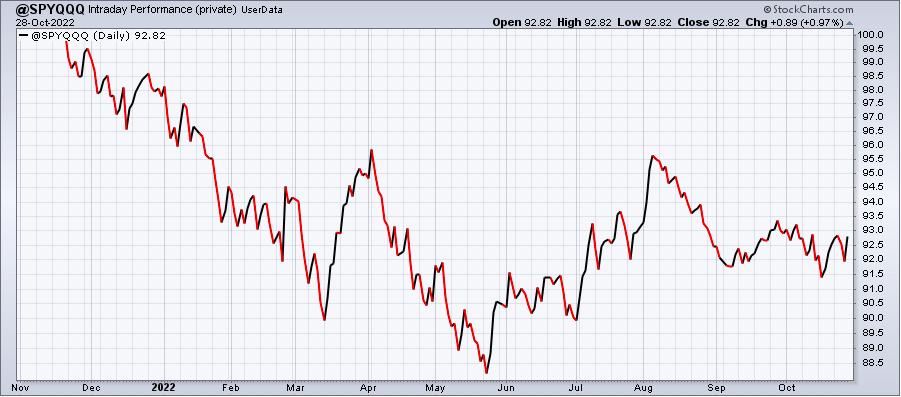
This shows a completely different picture. Distribution seems to have remained rampant through the May low. However, since then, I see solid intraday rotation INTO the QQQ, not out of it. Gaps really mask the true rotation taking place and the manipulation that's allowing big Wall Street firms to prey and capitalize on retail traders.
And this is just the tip of the iceberg in terms of market manipulation. Those who are unaware of Wall Street's tactics are much more subject to the whipsaw action and psychological warfare that takes place during bear markets.
That's why I'm hosting our biggest event to date this Saturday, November 5th. If you'd like to attend (or receive a recording of) our FREE virtual "Understanding Market Manipulation" event, which will begin promptly at 10am ET, be sure to CLICK HERE for more information and to register for the event. It only takes a name and email address. Space is limited, so you need to sign up NOW!
I hope to see you on Saturday!
Happy trading!
Tom


