Like all of you, I'm just waiting. The Fed concludes its two-day meeting this afternoon and its latest policy decision will be released at 2pm ET. It's widely expected that the Fed will raise the fed funds rate by 75 basis points. Anything other than that would be a major surprise and would likely have significant short-term ramifications. The Fed tries to be very transparent, so I am looking at the market assuming that rate hike will take place and is already baked into market prices. But what will they say about December? About 2023? Are their rate hikes throughout 2022 working? Will they become more data dependent? Do they plan to slow their pace of hikes? Is there an end in sight?
Both the bond market and stock market are looking for direction. As we approach this big meeting and announcement, I will have my eyes on three key things:
10-Year Treasury Yield ($TNX)
In my humble opinion, the bond market is smarter than the stock market. If interest rates are jumping for the wrong reason (inflation), then the stock market usually takes its cue and sells off. There's a fairly strong positive correlation between the 10-year treasury yield ($TNX) and the S&P 500 over time. In other words, when yields rise, the stock market tends to rise along with it. The reason? Well, usually the TNX rising is due to a strengthening economy or the anticipation of a strengthening economy. A strengthening economy means more business for S&P 500 companies. Their revenues and profitability jump, driving share prices higher.
But that's not the reason for the TNX rising. While we can point out areas of strength in our economy, I think most will agree it's not a vibrant economy. We're holding our own. The recent positive Q3 GDP (+2.6%) is a positive, but it comes on the heels of two negative quarterly GDP readings. Nonfarm payrolls (we'll get the latest here on Friday) have remained positive, though not "off-the-charts" positive. Areas like housing, sentiment, etc. point to a difficult market environment.
I believe a big clue today will be whether the TNX jumps and breaks out above the recent yield high of 4.33% (bearish for equities) or whether the recent downtrend back to the 20-day EMA accelerates. A push in the TNX below 3.91% would signal a further drop in the TNX (bullish for equities). Here's a 3-month hourly chart to highlight these two levels to watch:
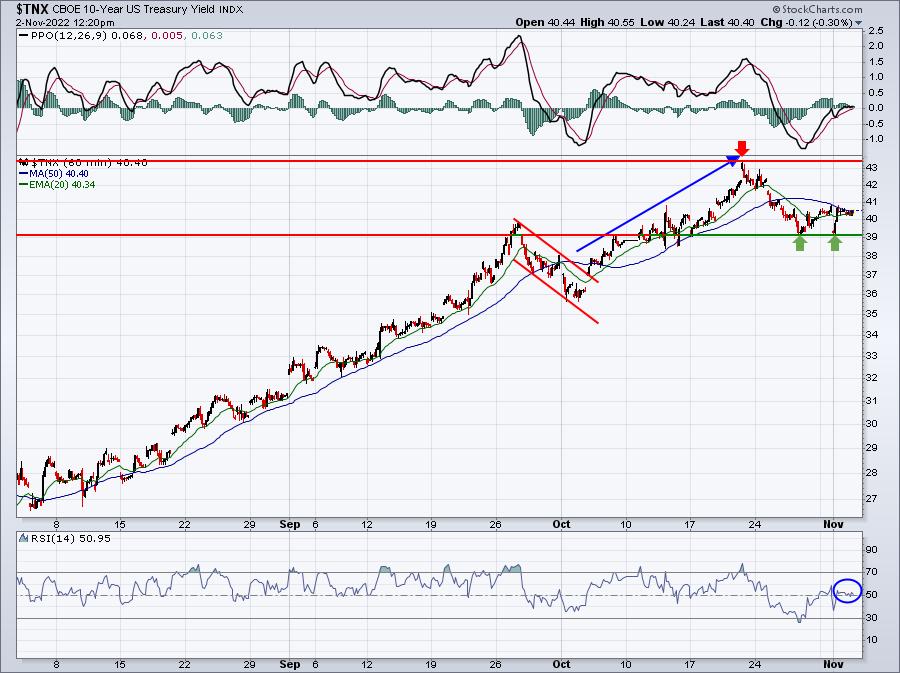
Check out the RSI, which is sitting squarely at 50. Also, the hourly PPO is right on the zero line and the TNX is at the 50-hour SMA. Which way are we going to go? I have no idea. But it will be important.
The daily chart shows a negative divergence, which USUALLY results in a PPO centerline test and 50-day SMA test (pink arrows). If that were to occur, I'd be expecting a big absolute and relative rally in NASDAQ shares. But that's a GREAT BIG IF:
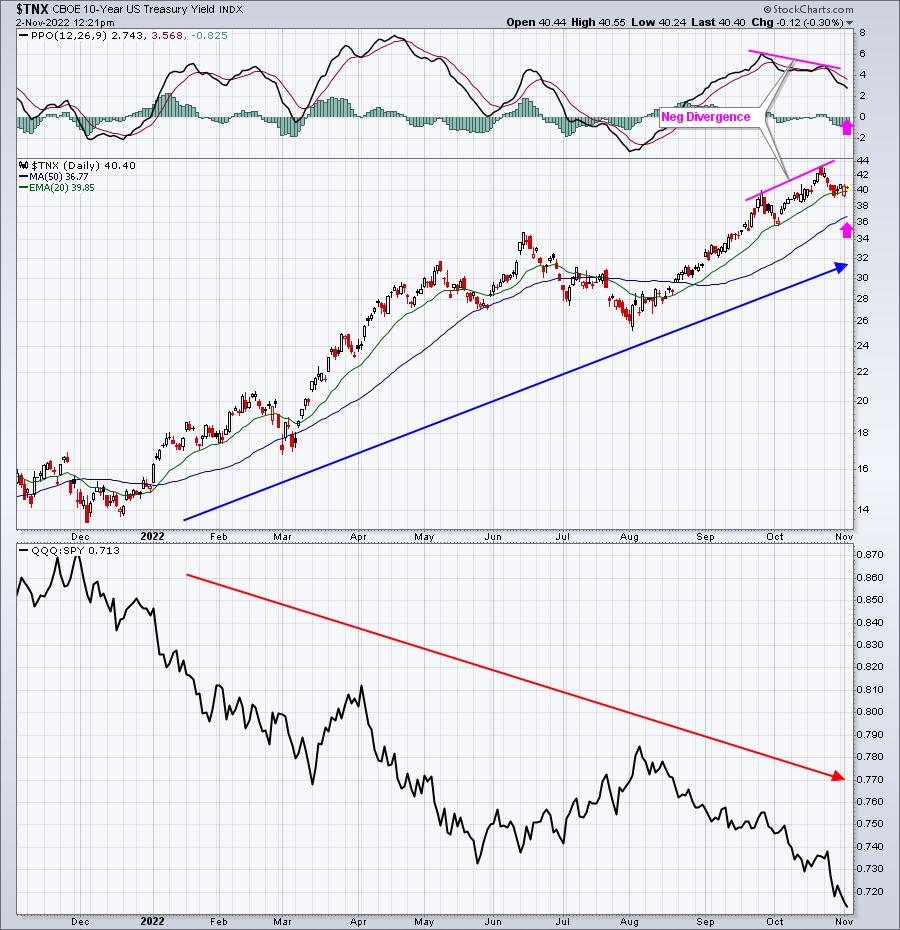
This chart highlights that negative divergence, but it also shows what higher interest rates have meant to the relative performance of NASDAQ stocks (vs. the more value-oriented S&P 500) throughout 2022. A potential change in Fed policy would very likely reverse this relationship. The Fed's policy statement will be scrutinized for ANY such signal.
S&P 500 Support & Resistance
3900 has proven, on many occasions, to be significant price support during downtrends in 2022, but also solid price resistance on recovery attempts. After the recent positive divergence formed, I indicated that 3900 was a likely target in the short-term. Well, we just opened near the 3910 two days ago before seeing another significant selling event. Therefore, a confirmed close or two above 3900 is required before growing more optimistic near-term. Meanwhile, if this truly is the start of an uptrend, then the now-rising 20-day EMA should provide us excellent support on further selling. Here's how all of this looks on a daily chart:
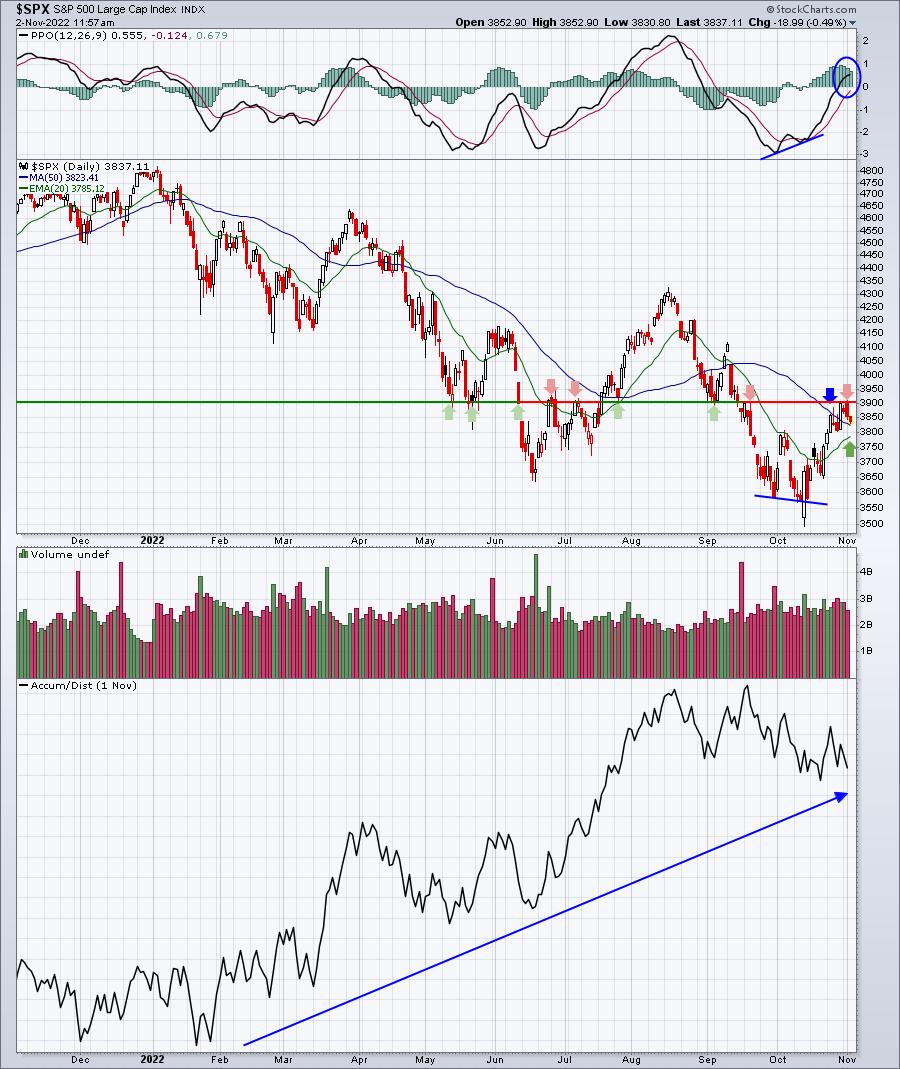
The positive divergence led to a 50-day SMA test (blue arrow) and a test of the PPO centerline (blue circle). Now that we've arrived here, I believe momentum is telling us NOTHING about which way we'll go. Other signals may provide clues, but the PPO and price action is quite uncertain at this moment. The light-shaded red arrows (price resistance) and light-shaded green arrows (price support) highlight the number of times that 3900 has played a role in reversing price action. It just did it again this week.
So now I'm watching that 3900 level, which needs to be cleared from a bullish perspective. The 20-day EMA, currently at 3785 is the moving average that the bears are looking to take out. As I approach the Fed meeting today, do we close above 3900 or below the 20-day EMA first? While head fakes are always entirely possible, we need to respect whichever occurs. We can always adjust later if it turns out to be a false move. I get back to a saying from a long-term friend of mine.
"It's okay to be wrong, just don't be wrong for long!"
Market Rotation
The key for me here is (1) does the stock market move higher, while aggressive areas lag, or (2) does the stock market move lower, while aggressive areas lead? The former is bearish and the latter is bullish. Here's a chart that will provide me a few clues:
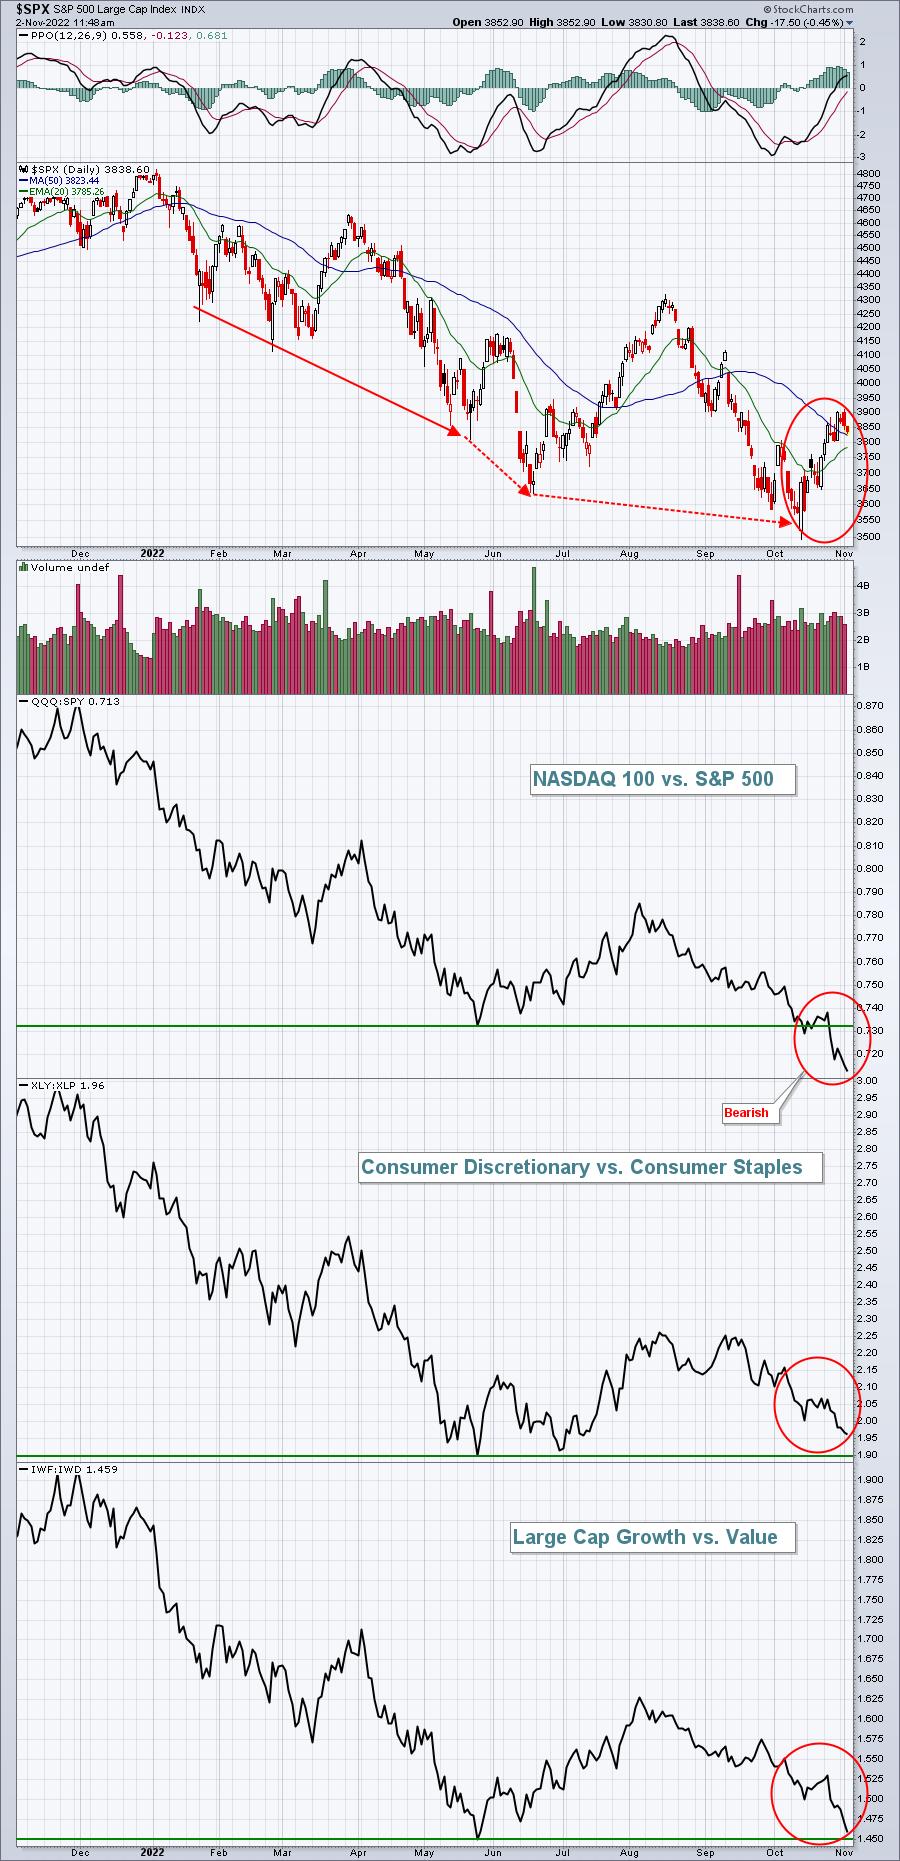
When I see the benchmark S&P 500 rising and key aggressive ratios declining, it's an indication that the stock market could be prepping for a significant market decline. This exact scenario played out in December 2021, just prior to the bear market of 2022. I have developed a way to look at this rotation on an INTRADAY basis, which provides a MUCH more bullish look into current rotation, but we can't completely ignore these red circles above. What happens to these ratios AFTER the Fed announcement. I want to see them turn higher.
There has been SO much manipulation in the U.S. equity market throughout 2022. Some of this manipulation we see every year, while some of it applies to this bear market alone. I'm going to share 3 areas of market manipulation that EVERY SINGLE INVESTOR OR TRADER should be aware of.
Our FREE "Understanding Market Manipulation" virtual event will be held LIVE this Saturday (November 5th) at 10am ET. You DO NOT want to miss this event as I'll be uncovering a few of Wall Street's best kept secrets. Even if you cannot make the event live on Saturday, we'll send out a recording to all those who register. CLICK HERE for more information and to register with your name and email address. Seating will be limited, so SAVE YOUR SEAT NOW!
Happy trading!
Tom


