If you're looking for stocks that are momentum gainers, the best place to start is to find the leading industry groups. So which sectors were strong in 2022?
The first step is to identify the strong and/or strengthening industry groups. I keep an industry group relative strength ChartList in my StockCharts.com account that we provide to our annual members at EarningsBeats.com. Using the "Summary" feature, I can quickly identify the best relative performers over various time frames. At the end of 2022, here were the top 10 industry groups in Q4:
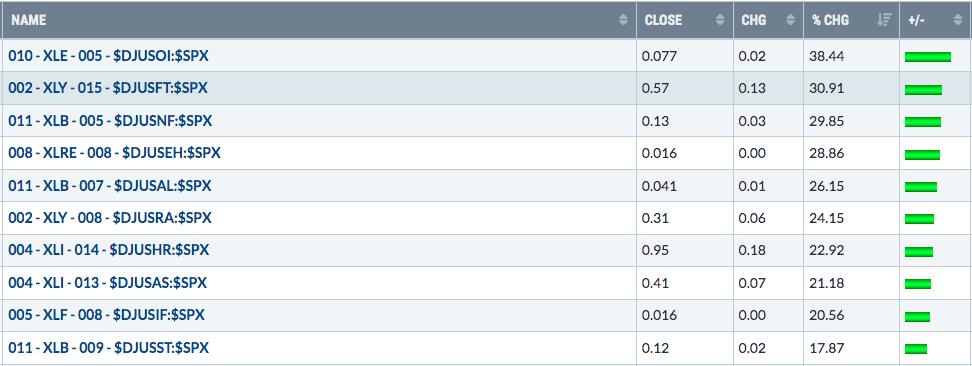
As I look at this list of Q4 leaders, I can't help but notice that materials (XLB) has three industry groups in the top 10—nonferrous metals ($DJUSNF), aluminum ($DJUSAL), and steel ($DJUSST). Clearly, materials had a strong Q4, but there were two sectors that did even better. Check out this Q4 sector leaderboard:
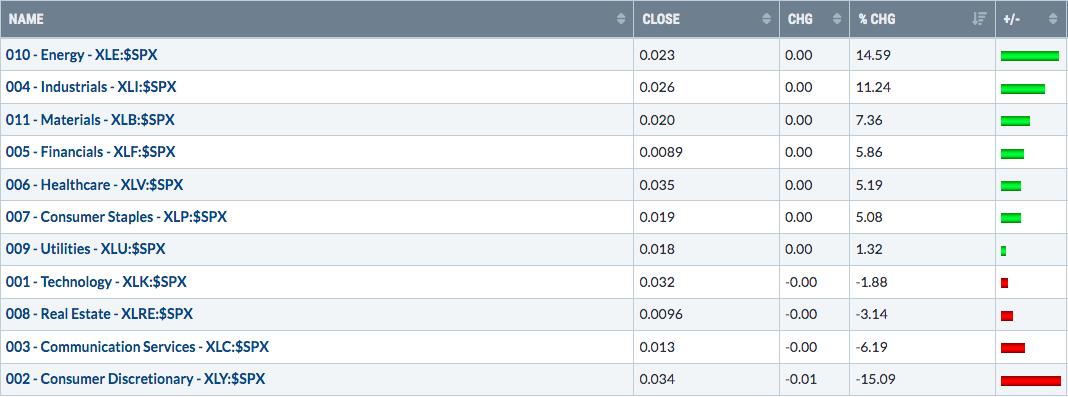
Energy (XLE) and Industrials (XLI) saw significant money rotating their way at the expense of Consumer Discretionary (XLY) and Communication Services (XLC). I'm not a fan of poor relative strength among the three aggressive sectors—XLY, XLC, and Technology (XLK).
However, there's definitely a silver lining. The money rotating away from these aggressive groups isn't leaving the market. Instead, it's simply sending other areas of the market higher. That's why the S&P 500 index was higher in Q4. That's good, not bad. But until you start to see relative strength in the XLK, XLY, and XLC, the NASDAQ Composite and other growth-oriented stocks will likely underperform.
Aerospace Took off in 2022
One group on this top 10 list is aerospace ($DJUSAS). Check out the chart of Boeing (BA).
Another group that I personally found to be shocking was footwear ($DJUSFT), especially given how poorly most consumer discretionary stocks performed in Q4. Yet, here was a former leader, getting its act together as we head into 2023 (see chart below).
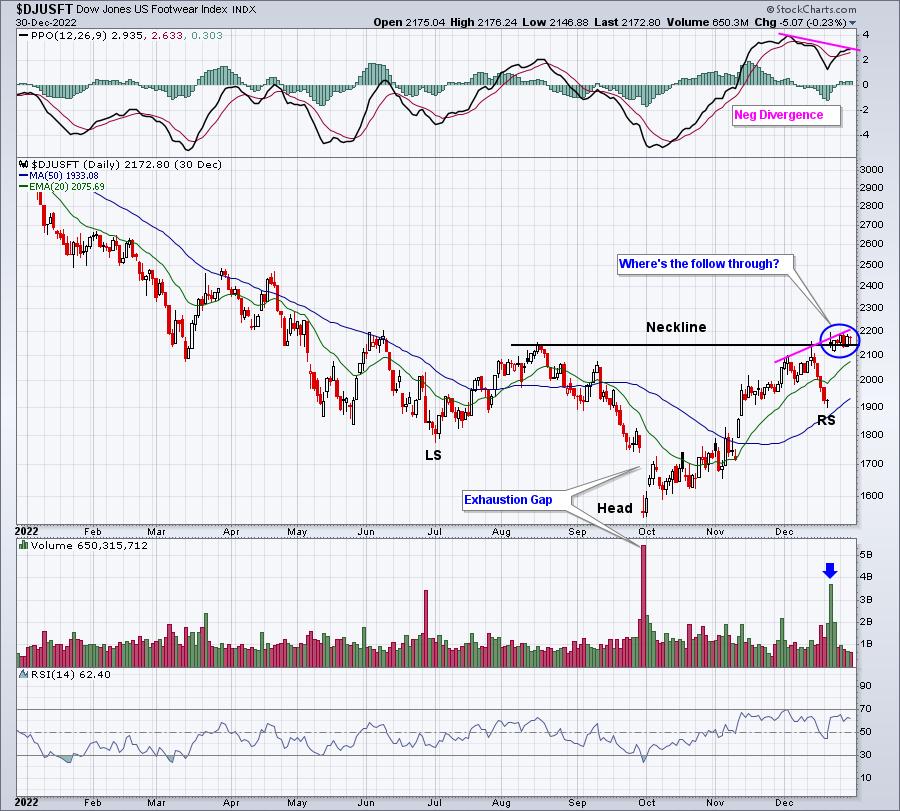
Usually, when you see a big breakout on confirming volume, there's follow-through and the beginning of a nice uptrend. But we've yet to see that. In addition, there's a negative divergence, which is a signal of slowing bullish momentum. While what's going on right now with footwear is encouraging, don't be surprised to see short-term disappointment and perhaps a slight pullback to the 20-day exponential moving average. We'll soon find out.
If you'd like to hear my thoughts on the upcoming year and the thoughts of my StockCharts.com colleagues and good friends David Keller, CMT; Julius de Kempenaer; and Grayson Roze, be sure to CLICK HERE and register for this Saturday's 4th annual MarketVision event, "The Road Ahead: Navigating an Uncertain Market". It's a FREE virtual event that does NOT require a credit card. Simply click on the link above, provide your name and email address, and check out the details of the event. Even if you cannot attend the event live on Saturday, we'll make sure you get a copy of the recording!
Happy new year and happy trading!
Tom


